Search "pullback in stock market" and the results split into two camps. Neither one tells you what you need while the move is still happening. One camp hands you index-level thresholds: a pullback is 5 to 10 percent, a correction is 10 to 20, and above that you're in a bear market. Usually there's a post-war frequency count attached. According to Yahoo Finance's coverage of market pullbacks, these bands come from named research houses counting episodes in a broad index going back decades. The other camp skips the numbers entirely and goes straight to entry tactics — buy the first green candle, wait for the 50-day average, trail your stop. Neither half of that split is wrong, exactly. Both are incomplete the same way. The thresholds are measured after the fact, on an index, and they get borrowed onto single stocks and intraday charts where the arithmetic simply does not transfer. We built this piece to close that gap. It defines pullback depth in units of the instrument's own volatility, states what you can actually check while a move is in progress, and puts the index-level numbers back in the context they came from instead of letting them leak onto a single name.
Why a Fixed Percentage Breaks on a Single Stock
An 8 percent drawdown means two completely different things depending on what you're holding. On a high-volatility growth name that routinely swings 3 to 4 percent in a single session, an 8 percent retracement is Tuesday. It is noise the stock produces most weeks, and treating it as a "pullback signal" generates false alarms constantly. On a slow, low-volatility utility or consumer staple that moves 0.5 to 0.8 percent a day, the same 8 percent move is a structural event — something has actually changed in how the stock is being priced. A single fixed percentage threshold cannot serve both instruments at once, because the threshold has no information about how much the instrument normally moves. That's the whole flaw in porting the 5-to-10-percent index convention onto a single name: the index number was never calibrated to that stock's volatility in the first place, it was calibrated to the index's.
This is also why the sub-10-percent band — the zone most traders actually care about — has no formal definition anywhere. Wikipedia's entry on market corrections reports that a correction starts above 10 percent and a bear market above 20. It says nothing about anything smaller. That's not an oversight. Below 10 percent on an index is genuinely too noisy to standardize, because index-level daily volatility is itself low and fairly uniform across constituents. Single stocks don't have that luxury of uniformity. The gap below 10 percent is exactly where a volatility-adjusted measure has to do the work a flat percentage can't.
The National Bureau of Economic Research, which maintains the official chronology of U.S. business cycles, is a useful reminder of how differently episode-counting looks depending on the window you use. Counting pullbacks "since the post-war period" spans a dramatically different market structure, trading infrastructure, and volatility regime than counting them over the last decade. A base rate calculated across 80 years of index history is not automatically the base rate that applies to this week's single stock.
Measuring Pullback Depth in Volatility Units Instead of Fixed Percent
The fix is arithmetic, not philosophy. Instead of asking "what percent did price retrace," ask "how many average true ranges did price retrace." Our data from the Average True Range (ATR) glossary entry defines the trailing range measure: ATR over a 14-period window, averaging the true range (the greatest of high-low, high-previous close, and low-previous close) across those periods. Once you have ATR, depth-in-volatility-units is just:
Depth (in ATRs) = (Swing High − Current Low) ÷ ATR(14)
Run that formula on two instruments with very different volatility profiles. The same percentage move produces two different verdicts. Take a hypothetical fast-moving growth stock trading near $150 with a 14-day ATR of roughly $6, about 4 percent of price. Compare it against a slower large-cap also trading near $150, but with a 14-day ATR of roughly $1.80, about 1.2 percent of price. An identical $12 retracement is 8 percent on both names by price alone. In ATR terms it's only 2.0 ATRs deep on the fast name but 6.7 ATRs deep on the slow one. The fast stock has barely moved relative to its own noise floor. The slow stock has just produced a retracement more than six times its typical daily range — the kind of move that actually warrants attention. Same percentage, same dollar amount, opposite read, once you measure in the instrument's own units instead of a borrowed index convention.
This is the arithmetic that quietly disappears whenever a trader reads "a pullback is a 5 to 10 percent move" and applies it to a watchlist of names with wildly different volatility profiles. The number stays fixed; the thing it's supposed to measure keeps changing underneath it.
As a working scale, we treat anything under 1.5 ATRs as routine noise regardless of the instrument, 1.5 to 3.5 ATRs as a standard pullback worth tracking, and above 3.5 ATRs as deep enough to start asking whether the prior trend structure is actually holding. These are working bands from our own charting process, not a universal law — the point of the exercise is that the band has to be expressed relative to the instrument, not as one number for every ticker.
Where to Measure From — and Why the Intraday Extreme Inflates Everything
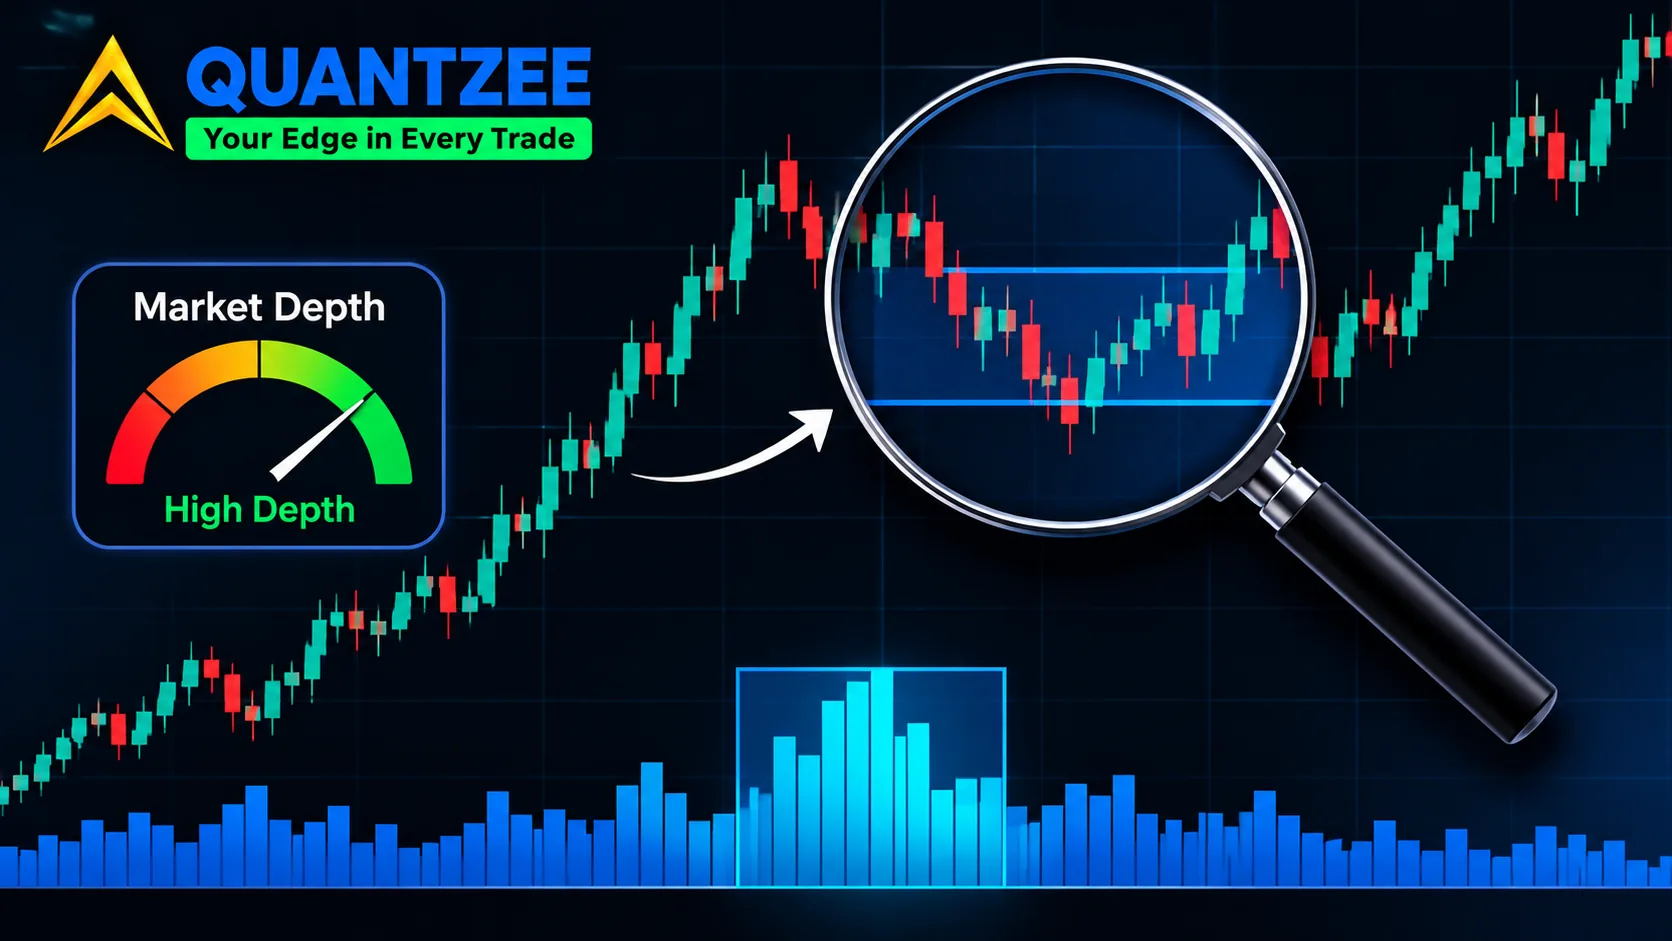
The denominator matters less than people assume; the two endpoints matter more. Measure from the completed swing high to the completed swing low on a closed structure — a confirmed local top that price has actually turned away from, down to a confirmed local bottom. Measuring from an intraday extreme instead — the single lowest tick of a flash move, or the single highest wick of a blow-off top — inflates every depth figure you calculate, because intraday extremes are, by definition, the most extreme print in the sample. A chart that printed a brief stop-run wick 4 ATRs below the real swing low will show a "4-ATR pullback" that reverses within the hour and was never a real retracement of the trend at all. Our market structure framework treats a swing point as confirmed only once price has closed back through it in the opposite direction — not merely touched it intraday. That one rule removes most of the false-depth readings that come from measuring off a wick instead of a close.
There's a related trap in picking which swing to measure from at all — the same ambiguity that shows up in Fibonacci retracement's swing-selection problem: on a noisy chart, three different traders will pick three different "most recent swing high," and each one produces a different depth reading from the same price action. The fix there is the same fix as here — anchor to the most recent swing that has actually been confirmed by a close-through, not the most recent local extreme your eye happens to land on.
Three Checks You Can Run While the Move Is Still in Progress
The index-level base rates are backward-looking by construction — they count completed episodes after the fact. None of them tell you, in real time, whether the pullback you're watching right now is routine or structural. Three checks do, and all three are available before the move is finished:
Has the prior swing low held? If the current retracement stays above the low of the move before it, the trend's internal structure is intact — the market is still printing higher lows even if this particular leg down feels sharp. A break below the prior swing low is structurally different from a deep-but-contained pullback, regardless of how many ATRs it measures.
Is range expanding or contracting into the move? A pullback that arrives on contracting range — smaller daily ranges, lower volume, the kind of quiet consolidation our Volatility Contraction Pattern work quantifies — reads as digestion within a trend. The same depth arriving on expanding range, wider bars, higher participation, reads as distribution or a genuine change in who's in control of the tape.
Has the retracement exceeded the depth of the previous pullback in the same trend? Trends tend to produce pullbacks of a roughly similar character while they're healthy — each dip retraces a comparable fraction of the preceding advance. When a pullback suddenly runs 2 to 3 times deeper in ATR terms than the last one did, in the same trend, that's often the first objective sign the character of the move has changed, well before any index-level base rate would register it.
None of these three checks requires waiting for the move to finish. That's the entire point of building a depth-plus-structure framework instead of leaning on a post-hoc base rate: you need a verdict while the position is still open, not six months later when someone tabulates the episode.
Putting the 5-to-10-Percent Convention Back in Context
The index-level numbers aren't wrong, they're just scoped to something narrower than most readers assume. The 5-to-10-percent pullback and 10-to-20-percent correction bands, per the source data from Yahoo Finance's coverage of market pullbacks, are conventions applied to broad indices — they describe how often a benchmark like a major large-cap index has historically retraced by that magnitude, counted across a long sample. That's a statement about the index's own historical behavior, not a trading rule for any individual constituent of that index, and not a threshold anyone should expect to hold on an intraday chart of any timeframe. The post-war frequency counts behind those bands are a similar story — they tell you how often the index itself has produced a pullback or correction since some start date. That number says nothing about whether any specific stock you're watching today is behaving the same way the index behaves on average, because single names routinely move with far more idiosyncratic volatility than the index that contains them.
Treat the index thresholds as a reference point for "how indices have behaved historically," full stop. The moment you need an answer for a specific stock or a specific intraday chart, the index convention stops being load-bearing and the volatility-unit measure above has to take over.
CME Group's own breakdown of pullbacks, corrections, and bear markets makes a similar point from the futures side: the labels are useful shorthand for conversation, but the number attached to each label is a historical observation about an index, not a trigger level for any single contract or stock. Treat it the same way here — shorthand for discussion, not a signal.
Pullback, Correction, Reversal — a Depth-Plus-Structure Question
Once you separate depth from structure, the labels stop being about magnitude alone. A shallow retracement that breaks the prior swing low is more significant than a deep retracement that doesn't, because the break changes what the chart is telling you about control, while the depth alone only tells you how far price traveled. Practically: a pullback is a retracement, of whatever ATR depth, that keeps the prior swing low intact — the trend's structure survives. A correction is a deeper retracement, still within the broader trend context but larger and often slower to resolve, usually several ATRs deep with contracting-to-neutral volume. A reversal is the case where the prior swing low gives way and the pattern of higher highs and higher lows (or lower highs and lower lows, in a downtrend) actually breaks — at that point you're no longer looking at a pullback of any depth, you're looking at a different trend. The percentage number by itself answers none of this; it's the combination of depth-in-volatility-units and the swing-low-held question that does.
A Four-Step Measurement Procedure You Can Apply Today
We built this into a repeatable sequence rather than a one-off observation, because the value is in applying it consistently across charts, not in any single calculation:
Step one — identify the most recent confirmed swing high and swing low: a close-through reversal in each direction, not an intraday wick. Step two — compute the 14-period ATR on the same timeframe you're analyzing (intraday ATR for an intraday read, daily ATR for a daily read — don't mix timeframes between the swing points and the range measure). Step three — divide the retracement distance (swing high minus the current low, or current price if the move hasn't finished yet) by that ATR to get a depth-in-volatility-units figure, and compare it against your working bands: under 1.5 ATRs is noise, 1.5 to 3.5 is a standard pullback, above 3.5 is deep. Step four — check structure: has the swing low prior to this one held, is range contracting or expanding into the move, and is this retracement deeper than the trend's last comparable pullback. Combine the depth figure from step three with the structure verdict from step four, and you have a reading you can act on without waiting for a post-hoc base rate to confirm it months later.
This procedure generalizes across instruments precisely because it never references a fixed percentage. A $400 stock, a $12 stock, and a futures contract all get measured the same way — by their own trailing range, not by a number borrowed from an index they don't trade like.
Where This Fits Inside Quantzee's Chart-Reading Toolkit
This depth-plus-structure framework is the same lens our bull flag pole-depth analysis runs on continuation patterns — a flag that retraces a shallow, volatility-adjusted fraction of its pole tends to hold; one that retraces deep relative to its own range tends to fail. We'd rather give traders one consistent depth-measurement habit that works across pullbacks, flags, and corrections than a different percentage rule for each pattern name. The toolkit Quantzee builds is designed around exactly this kind of measurable, chart-agnostic rule — numbers you can recompute on any symbol, rather than folklore percentages lifted from an index.
Frequently Asked Questions
Historical measurement here is based on a fixed sample of index and single-name price behavior and is not predictive of any individual stock going forward. This is analytical software, not investment advice — it does not recommend trades or forecast returns. Paper trade any measurement framework on your own charts before relying on it with real capital.