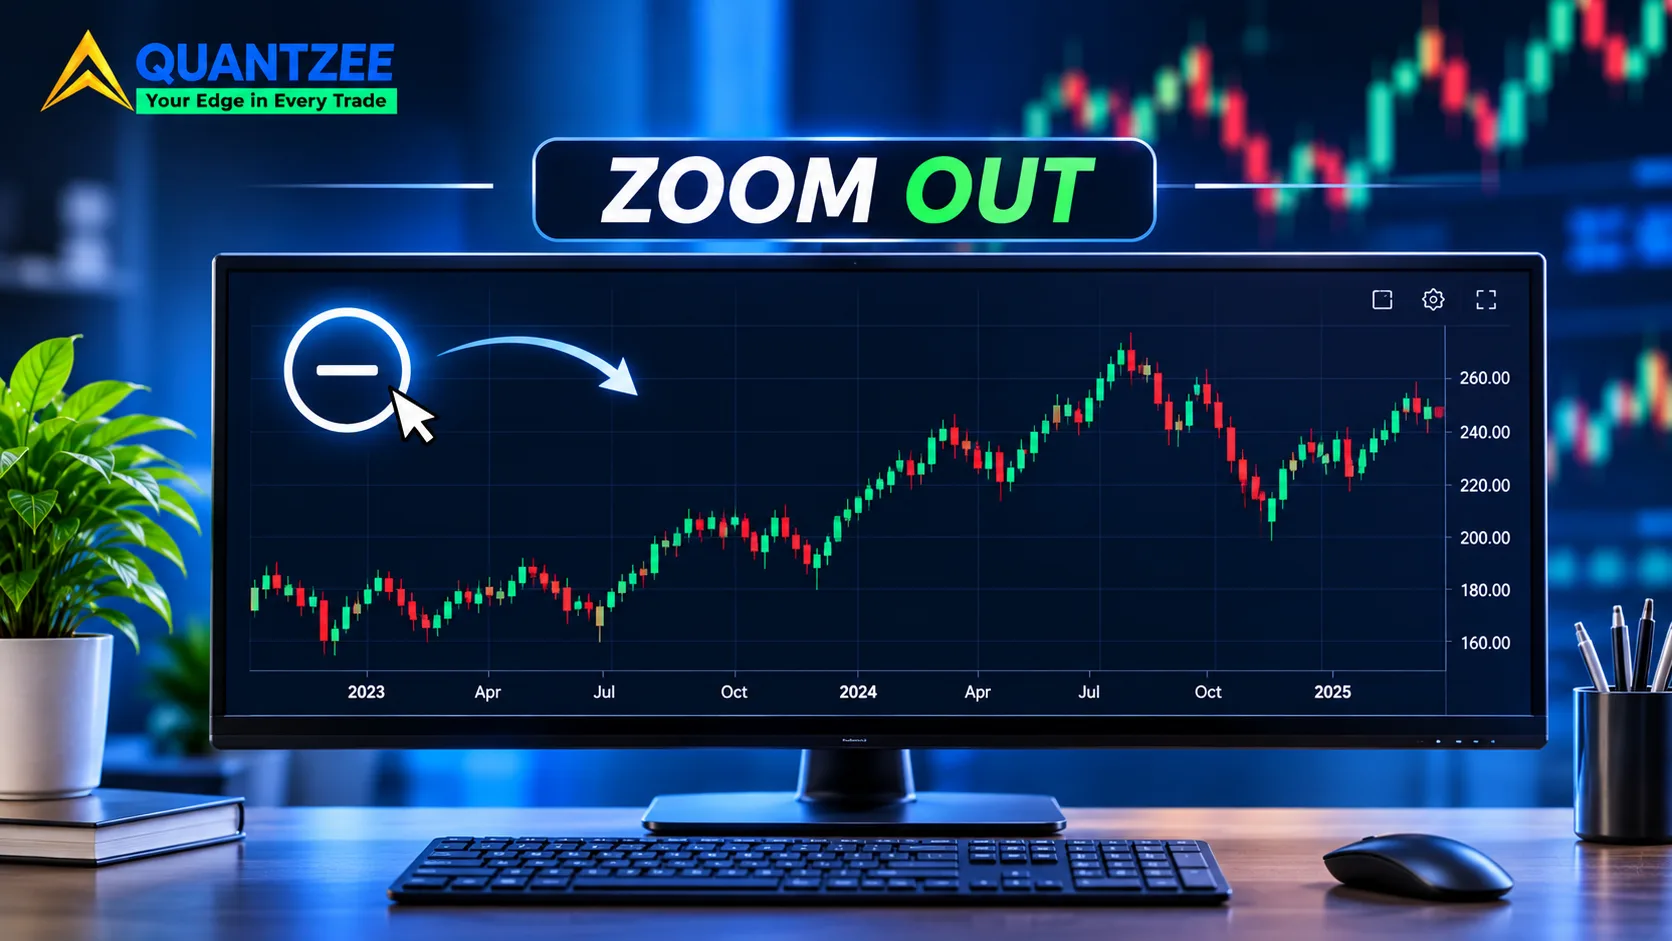
To zoom out on TradingView, scroll the mouse wheel down over the chart, press Ctrl and the Down arrow (Cmd and Down on a Mac), or drag the time axis along the bottom to the left. On a phone, pinch your fingers together. To get back to the default view, use the reset-chart control or the Alt+R shortcut. That is the whole answer to how to zoom out on TradingView, and you can stop reading here if that's all you needed.
Most people keep reading because the shortcut works and the chart still looks wrong. Candles that were tall and dramatic a second ago are now a thin squashed ribbon. A trend line that touched three swing lows now floats in empty space. Nothing is broken. You changed one axis and the other one quietly changed itself, and this post explains which is which.
The shortcuts, quickly, for desktop and mobile
Shortcut sets change between releases, so treat this list as a starting point and check it against the keyboard-shortcuts panel inside the app (the question-mark icon, or Ctrl+/ on most setups) before you build a habit around it. The platform's own help center at tradingview.com/support is the first-party place to confirm option names.
- Mouse wheel: scroll down over the chart pane to zoom out in time, scroll up to zoom in.
- Keyboard: Ctrl+Down (Cmd+Down on Mac) zooms out and Ctrl+Up zooms in, on the layouts where I've seen it behave as expected.
- Time axis drag: click and drag the date labels along the bottom edge. Dragging left compresses the timeline, which means more bars fit on screen.
- Reset: the reset-chart button near the bottom right of the pane, or Alt+R, snaps back to the default zoom and re-enables the automatic price scale.
- Mobile: pinch to zoom out, double-tap the price scale to return it to automatic.
Four lines of shortcuts is exactly what every other page on this keyword gives you. The interesting part starts after you've pressed them.
Zoom is a time-axis operation. The price axis does its own thing.
When you zoom out, you are changing how many bars are visible. That's it. The horizontal axis now covers a longer stretch of history. The vertical axis, meanwhile, is set to automatic by default, which means it rescales itself so the highest high and lowest low among the visible bars just fit in the pane. You didn't ask for that. It happens every time the set of visible bars changes.
Here is an illustrative example with round numbers, not a real instrument. Suppose the last 120 daily bars sit between 40 and 60. The price axis stretches roughly 40 to 60 across the pane height, so a 2-point daily move fills a tenth of the pane. Now zoom out to 900 bars, and suppose that longer stretch includes a low of 18 and a high of 95. The axis now spans about 77 points instead of 20. The same 2-point move that used to fill 10% of the pane takes up about 2.6%. The candles didn't get smaller in any real sense. The ruler got longer.
That's why the same candles look steep after zooming in and flat after zooming out. It's also why a chart screenshot is a weak piece of evidence on its own. Without the price labels, you can't tell whether a move was large or whether the axis was just tight.
In our experience the most common misdiagnosis is "TradingView zoomed wrong." It didn't. Time zoom worked, and auto-fit did what auto-fit does.
Scale lock: stop the price axis moving while you navigate
TradingView has a setting that freezes the price axis, usually called lock scale, found in the price-scale right-click menu and the small icons at the bottom right of the chart. With it on, scrolling and zooming through time no longer re-fits the vertical range. The bars keep their height. If the visible stretch drifts past the locked range, the candles run off the top or bottom of the pane, which is the trade-off.
When to switch it on is easier to describe by symptom than by rule. Turn it on when a drawing no longer touches the bars it was anchored to after you pan or zoom. Turn it on when you're comparing the height of two moves from different periods and need them on the same ruler. Leave it off when you're scanning a long history and just want everything visible.
I've seen people lock the scale, forget about it, and then spend ten minutes wondering why the chart won't follow price after a gap. If the latest candle has wandered off screen and zooming won't bring it back, check the lock first.
Auto-fit versus a manually dragged price axis
Dragging the price axis up or down with the mouse stretches or squeezes it by hand. The moment you do, TradingView switches off automatic fitting for that pane. From then on, zooming in time no longer rescales price, even if you never touched lock scale. This catches people out because there's no obvious message that auto mode ended.
To get back to automatic, double-click the price axis, or click the small "A" (auto) button in the bottom-right corner of the chart so it highlights. If the chart still looks off, press the reset control, which clears manual scaling and returns the time range to default in one go.
A simple way to remember it: the time axis you drag horizontally changes what you see. The price axis you drag vertically changes how you see it. Only one of those two is a zoom in the sense most people mean.
Logarithmic versus linear: a change of character that isn't zoom
Long-history charts look different on the log setting, and the difference has nothing to do with how far out you've zoomed. On a linear scale, equal vertical distances mean equal point changes. On a logarithmic scale, equal vertical distances mean equal percentage changes. According to the general definition of a logarithmic scale, each step along the axis multiplies the value by a constant factor rather than adding a constant amount.
Take a price that rises from 10 to 20 and later from 100 to 200. Both are 100% gains. On a linear axis, the second move looks ten times bigger because it covers 100 points instead of 10. On a log axis, both moves have the same height. That's why a multi-year chart on linear scale shows a violent late surge and an almost flat early period, while the log version shows a steadier staircase.
If you zoom out over a decade and the early years look like a flat line, don't blame zoom. Try the log toggle (the "L" button near the "A" button, or Alt+L) and compare. Keep in mind that the choice also changes the geometry of any trend line, because a straight line on a log axis is a constant percentage growth rate while a straight line on a linear axis is constant point growth. Same two anchor points, different line.
Zoom, timeframes, and saved layouts
Changing timeframe is not the same as zooming. Switching from the daily to the hourly chart loads different bars entirely, so the chart recalculates what's visible and then auto-fits the price axis to the new set. Zooming within one timeframe only changes how many of the same bars are displayed.
A saved layout stores the chart setup, but what it stores about the visible range and price-scale mode can differ from what you expect, and I would not claim to know every detail of what TradingView remembers across sessions. The first-party documentation is the place to settle that. What you can rely on in practice: if a layout opens at a view you don't recognise, run the reset control, confirm auto is on, then re-apply your own settings in order. Time range first, then scale mode, then lock, then drawings.
Bar replay and zoom
Bar replay hides every bar after the replay point, so the visible range during replay is shorter than the real one. Auto-fit then rescales to whatever is showing up to the replay cursor. Zooming out during replay won't reveal future bars, but it can change how the visible history looks relative to the price axis. If you're using replay to rehearse how you'd have read a chart at the time, set the scale treatment before you press play. Otherwise the axis keeps re-fitting as new bars arrive and the picture shifts under you. If replay and zoom behave oddly together on your plan, the repainting test walkthrough covers how bar-by-bar views change what an indicator appears to have done.
The practical rule for anyone drawing levels
If you draw support, resistance, or trend lines, fix the axis treatment before you draw anything. Decide on linear or log. Decide whether the scale is locked. Then zoom to the range you intend to work in and only then place anchors. A line drawn on an auto-fitted axis at one zoom level can look misplaced at another, even though its price coordinates never changed. The coordinates are the same. The ruler isn't.
That is the same reasoning behind the six-rule protocol in how to draw trend lines the same way twice. Scale choice is one of the silent variables that makes two people draw different lines on identical data. The Chartered Market Technician body, cmtassociation.org, treats charting method as something to be standardised, and axis treatment is the cheapest place to start.
If you need to reason about what the bars themselves contain, open versus close, how volume is attached, the OHLCV data glossary entry is a short reference. And if you're setting up Quantzee's toolkit on a fresh chart, the install guide is worth a look, because indicator panels sit on the same time axis you've just learned to zoom.
Quantzee's tools are analytical software for reading charts, not advice. A clearer chart doesn't tell you what to do. It just makes sure you're looking at what you think you're looking at.
Frequently Asked Questions
Changelog
2026-11-06: first published. Shortcut and option names should be re-checked against the in-app panel after TradingView releases.