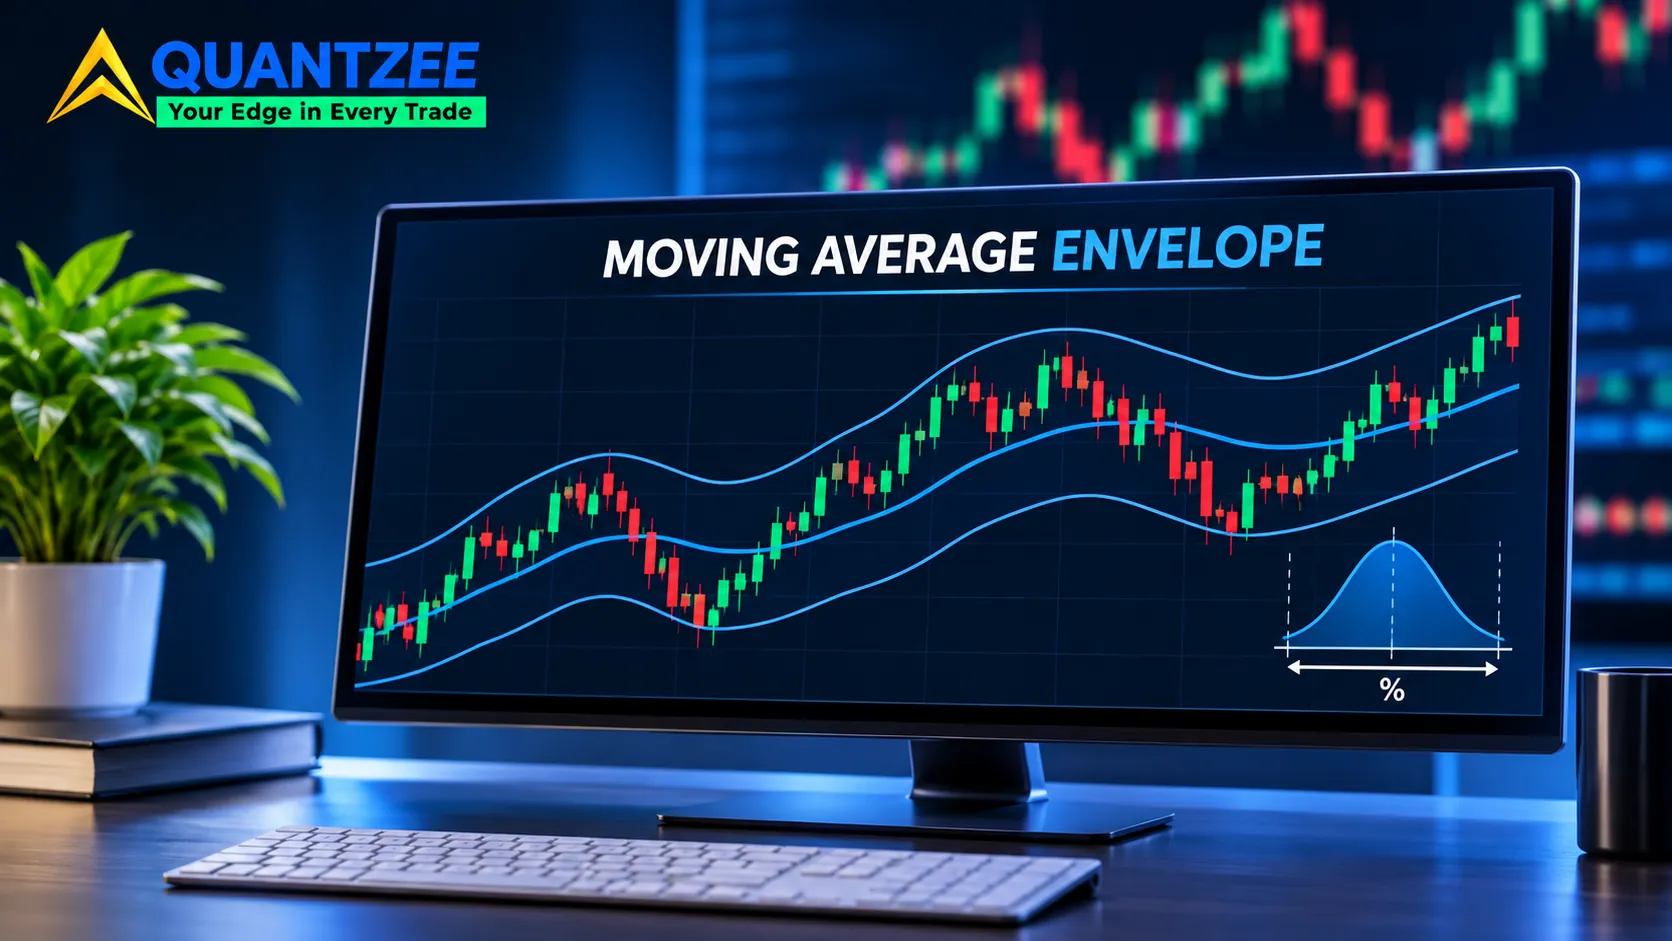
The env indicator is a moving average with two lines drawn a fixed percentage above and below it. That's the whole build. The only real decision it asks of you is how far away those lines sit, and the platforms you copy settings from disagree about that answer by a factor of four or more.
This post is about that one number. We'll cover the formula, the conflicting defaults, and a ten-minute method for choosing the percentage from your own price history instead of from a tutorial screenshot, with a note on how the auto-fitting price axis changes a zoomed-out chart so the bands read the same each time. Everything numeric in the worked example is illustrative, and we say so each time it appears.
What the env indicator actually draws
Most people search "env indicator" after seeing "ENV" in a TradingView indicator list. The full name is Moving Average Envelope, and TradingView's own help page describes it as a basis line plus an upper and lower envelope. Per the TradingView help article (read 5 November 2026), the inputs are a length for the moving average, a percent for the band, and a source, with close as the default source.
Percentage bands around a moving average go back decades in the technical-analysis literature. The idea hasn't changed: if price strays too far from its own average, that distance is worth noticing.
Notice the word "distance". The envelope measures how stretched price is relative to its average. It doesn't measure momentum, volume or trend strength. Keep that in mind, because most of the confusion about the indicator comes from asking it questions it can't answer.
The formula, in both forms
There are two ways to build the bands, and they behave differently across price levels.
Multiplicative (percentage) form:
Upper = SMA × (1 + k/100)
Lower = SMA × (1 − k/100)
Additive form:
Upper = SMA + c
Lower = SMA − c
Here SMA is the simple moving average of closes over n bars, k is the percentage, and c is a fixed amount in price units. TradingView's help page writes its example the multiplicative way: upper envelope equals the 20-period SMA plus the SMA times 0.1.
Why does the distinction matter? Take two stocks, one near $40 and one near $400, both with a 20-bar SMA sitting right at that price. A 5% multiplicative envelope puts the bands at $2.00 and $20.00 from the average. An additive envelope with c = $2 gives the $40 stock a 5% band and the $400 stock a 0.5% band. Same c, wildly different meaning. The percentage form carries across price levels; the additive form only makes sense on the instrument it was tuned for.
So when a setup says "envelope of 2", ask which form it means before you copy it anywhere.
The platform-default conflict
This is where copied settings go wrong. Look at what three well-known sources use:
- TradingView: the help page works its example with a 20-period SMA and 10% envelopes.
- StockCharts ChartSchool: the entry introduces a 20-day SMA with a 2.5% envelope as its standard illustration (read 5 November 2026).
- MetaTrader: the LuxAlgo concept library lists 0.1 as the MetaTrader default, next to 10 on TradingView and 2.5 on StockCharts. We haven't read MetaTrader's own documentation, so treat that figure as secondhand.
Those are not rounding differences. 10, 2.5 and 0.1 span two orders of magnitude. A tutorial that says "price touched the upper envelope, so it was overbought" means something completely different depending on which of these produced the chart. On a typical daily chart a 10% band around a 20-day average is touched rarely, while a 0.1% band is touched almost every bar.
StockCharts is open about this effect. In its worked examples, the 2.5% envelopes on IBM are touched several times, the 5% envelopes only during one surge, and the 10% envelopes never. The page reads that last result as "this band is too wide." It also notes that Alcoa, a more volatile name, breached the 10% envelopes numerous times.
That is the whole argument in four sentences. The right percentage depends on the instrument and the timeframe. The documentation then stops short of telling you how to find it, which is the gap the next section fills.
How to choose k: a calibration method
Here's the method. It takes ten minutes in any spreadsheet and needs only your own closes.
- Decide how often you want price outside the band. Call it the outside share. If you want the envelope to flag unusual stretch, 5% to 10% of closes is a common starting range. This is a choice, not a fact about markets, and you should write it down before looking at any data.
- Pick a lookback. Use a stated window, for example the last 250 daily bars. Say the instrument and timeframe next to the result so anyone can reproduce it.
- Compute the distance for every bar. For each close, take (close − SMA) ÷ SMA × 100. This is the signed percentage distance from the average.
- Take absolute values and sort them. The bands are symmetric, so you want the size of the stretch, not its direction.
- Read k off the distribution. If you want 90% of closes inside the band, k is the 90th percentile of the absolute distances. For 95% inside, use the 95th.
That's the calibration. It turns "what number do I type in the percent box?" into "how much outside-the-band behaviour do I want?", which is a question you can actually answer.
Worked example (illustrative numbers only)
Our own worked example below uses made-up figures, not a measured result. Nothing here was pulled from a real price series, and you shouldn't read the output as a claim about any instrument.
Suppose a sample of 250 daily closes with a 20-bar SMA. After step 4 you have 250 absolute distances. Say the median is 1.1%, the 90th percentile is 3.1%, and the 95th is 4.2%. If you wanted 90% of closes inside the band, you'd set k = 3.1. That band would sit about $3.10 either side of an average of $100. A band at the StockCharts-style 2.5% would leave roughly 12% to 14% of closes outside under this made-up distribution, and a 10% band would leave essentially none.
The point of the example is the shape of the result. A default of 2.5 or 10 would have been a coincidence. The 3.1 came from a decision about outside share plus the instrument's own behaviour.
Why a fixed percentage drifts out of calibration
You calibrated k on one stretch of history. Volatility won't stay there.
A fixed-percentage band doesn't know that. When realised volatility doubles, the same 3.1% band gets touched far more often, and the outside share you chose quietly stops being true. When volatility halves, the band almost never gets touched and the indicator goes quiet for weeks.
The recalibration trigger is simple. Re-run the measurement on a rolling basis, for instance monthly, and compare the share of closes that actually fell outside your k against the share you targeted. If the live outside share is running at roughly double or half your target for a few weeks, k is now too tight or too wide. Our team treats a sustained gap like that as the cue to re-measure, not as a trading signal.
You can also use the ATR as a check. If the average true range has moved sharply since you set k, your calibration window no longer describes the market you're in.
Envelope vs Bollinger Bands vs Keltner Channels
The envelope is the simplest member of the band family. Its width is a fixed percentage of the average, so it never reacts to volatility by itself. Bollinger Bands set width from standard deviation of closes, and Keltner Channels set it from ATR, so both widen and narrow on their own. Our Keltner Channels vs Bollinger Bands comparison covers how those two differ in detail.
Because the volatility-scaled bands adjust automatically, they usually hold their calibration better than a fixed envelope. So when would you pick the fixed band on purpose?
One case stands out: a stable, range-bound instrument where you want a constant, easily explained threshold. If an asset has traded in a narrow volatility regime for a long time, a fixed 3% band is predictable and easy to document. A volatility-scaled band gives you a moving target you'd have to re-explain every week. The other case is when you want the threshold itself to stay put, for example to compare how often different periods breached the same line. A band that moves with volatility can't answer that question.
Lag, trends and ranges
Every envelope inherits the lag of its moving average. A 20-bar SMA trails price by roughly half its length, so in a fast move price can run well past the band before the basis catches up.
That has a practical consequence. A band touch in a range and a band touch in a trend are different events. In a range, price pushing to the upper band and then drifting back toward the average is the pattern the indicator was drawn for. In a trend, price can hug or ride the band for many bars while the basis climbs toward it, and each of those bars is a "touch" that tells you nothing new. StockCharts' own examples show this: it shows International Game Tech breaking below its 10% envelope to establish a downtrend in late October 2009, rather than snapping back.
So a touch alone doesn't say which situation you're in. You'd need a separate read on whether the average itself is sloping or flat.
Basis length and timeframe change k too
The percentage isn't independent of the other inputs. A shorter moving average hugs price, so the distances you measure shrink, and k comes out smaller. A longer average lags more, the distances grow, and k comes out larger. Change the length from 20 to 50 and you have to redo the calibration. A k borrowed from a 20-bar setup is wrong for a 50-bar one, even on the same chart.
Timeframe works the same way. A close-to-average distance on a 5-minute chart is tiny next to the same measurement on a weekly chart, because each bar covers far less time and far less movement. That's why a single "good" percentage can't exist across timeframes, and why a tutorial that shows a 2% band on a daily chart tells you nothing about what to type on an hourly one.
The practical rule: calibrate per instrument, per timeframe and per basis length, and store all three beside the number.
Doing the calibration in a spreadsheet
You don't need code. In a sheet with closes in column B and a 20-bar average in column C, put this in column D from row 21 down: =ABS(B21-C21)/C21*100. That's the absolute percentage distance for each bar.
Then read the percentile directly with =PERCENTILE(D21:D270, 0.90). That single cell is your k for a 90% inside-the-band target. Change 0.90 to 0.95 and watch k grow. Seeing how fast the number climbs between the 90th and 99th percentile is itself useful: the tail is where the surprises live, and a band set at the 99th percentile will almost never fire.
One caution. If your lookback happens to be unusually calm or unusually wild, the percentile inherits that. Run it over two or three different windows, such as the last 120 bars and the last 500, and compare. If the answers are far apart, the instrument's volatility regime has shifted, and the shorter window is probably the more relevant one, though you'll want to check it against the longer one before trusting it.
Signed distances are worth a look too. If the lower tail is much longer than the upper tail, for example on an instrument that falls faster than it rises, a single symmetric k will split the difference badly. Some traders use separate upper and lower percentages in that case. That's a legitimate refinement, as long as you measure both from the data rather than guess.
What the indicator cannot tell you
A band touch is a statement about distance. Price is X% from its 20-bar average. That's all.
It is not a reversal signal, and the calibration method above doesn't change that. All it does is make "outside the band" mean the same thing every time on your instrument. What happens after the touch is a separate question, and you answer it with testing on your own data, not with the band itself.
If you want to learn how bands, averages and oscillators fit together, the moving averages glossary entry is a good starting point. For general guidance on how technical indicators are used and where they fall short, investor education material from FINRA's learn-to-invest pages and Investor.gov is worth reading. Indicators are analytical tools. Quantzee is analytical software, not advice, and paper trade any setting before you rely on it.
A short setup checklist
- Write down your target outside share before you look at data.
- Record the instrument, timeframe, bar count and date range next to every k you save.
- Use the multiplicative form unless you have a reason not to.
- Re-measure monthly, or after any large change in volatility.
- Never copy a percentage from a tutorial that doesn't name its platform and timeframe.
Frequently Asked Questions
Changelog
5 November 2026: first published. Platform figures read from TradingView and StockCharts documentation on this date; the MetaTrader figure is from the LuxAlgo library, not MetaTrader's own documentation. Worked example is illustrative, not measured.