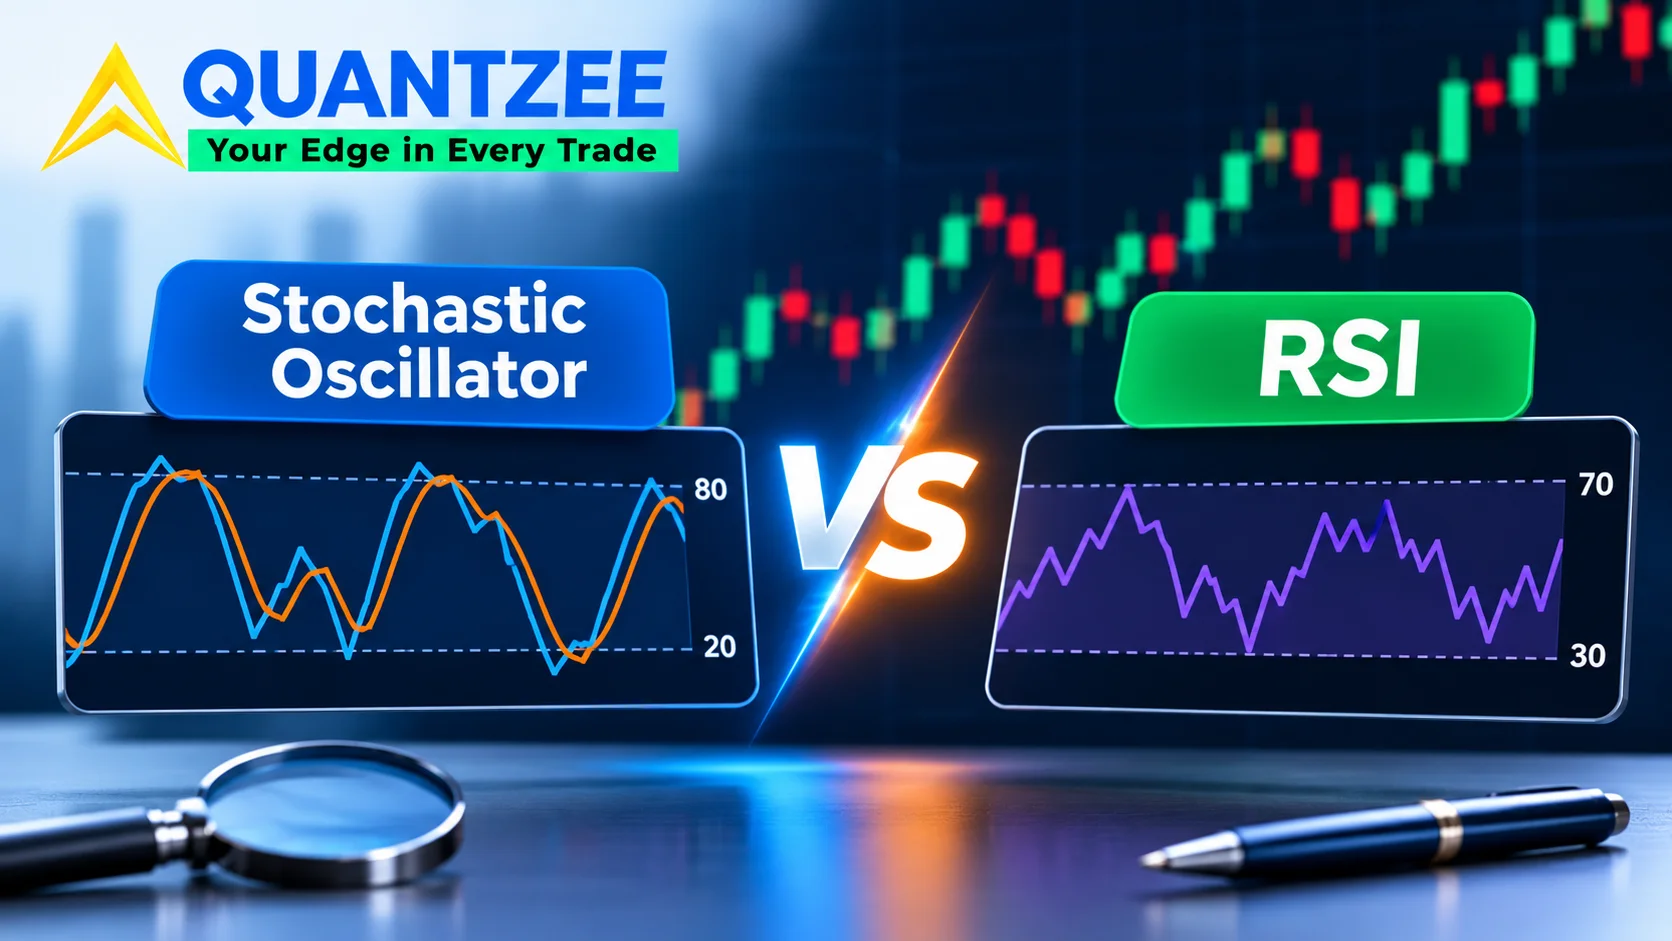
Search "stochastic oscillator vs rsi" and nearly every result gives you the same two sentences: use the oscillator in ranges, use RSI in trends. That answer is a slogan, not an explanation, and it skips the one fact that actually matters. RSI compares the average size of recent gains against the average size of recent losses. The Stochastic Oscillator ignores gains and losses completely and asks only where the current close sits between the window's high and the window's low. That single difference in input is why the two lines disagree as often as they do, and it is also the root of a second, more common mix-up: Stochastic RSI is a third indicator, built by running RSI's own output back through the stochastic formula, and it is not interchangeable with either of the first two despite sharing a name with both. At Quantzee we build the AI TrendPulse toolkit, and working through this comparison for our own momentum module is what prompted the arithmetic below.
The Two Formulas, Side by Side
Lane's Stochastic Oscillator, published in the 1950s, reduces to one question: over the lookback window, where did price close relative to its own high-low range? The formula for %K is %K = (Close − Lowest Low) / (Highest High − Lowest Low) × 100. There is no concept of a gain or a loss in that equation. A single violent down bar and a single violent up bar are both just inputs to a high or a low; the arithmetic does not care how price got there, only where it ended up inside the range.
Wilder's RSI, published in 1978, asks a different question entirely: of the recent price changes, how lopsided was the balance between up-moves and down-moves? RS = Average Gain / Average Loss, then RSI = 100 − 100 / (1 + RS). Every bar's change contributes its own magnitude to one running average or the other. A bar that closes at the window's exact high still only contributes whatever gain size it actually produced — not a saturated reading just because it happens to sit at an extreme of the recent range.
Put the two side by side and the difference is not subtle once you see it. One formula is built entirely from position inside a range. The other is built entirely from the magnitude of change. They will often point the same way, because a sustained move usually produces both a new range extreme and a lopsided gain/loss balance at the same time. They do not have to agree, and the cases where they don't are the ones worth understanding before you stack them on a chart.
A Worked Window Where Price Grinds Up and the Two Readings Split
Take seven consecutive closes: 100.0, 99.7, 100.1, 99.8, 100.3, 100.0, 100.5. Price has ground higher in small, choppy steps and the last close, 100.5, is a new high for the window. Run the stochastic formula first. The window's low is 99.7, the window's high is the current close itself, 100.5. %K = (100.5 − 99.7) / (100.5 − 99.7) × 100 = 100. The oscillator is pinned at its ceiling, because by definition the current close cannot be any closer to the top of a range it just set.
Now run RSI on the same seven closes. The six changes are −0.3, +0.4, −0.3, +0.5, −0.3, +0.5. Gains sum to 1.4, losses sum to 0.9. Average gain is 1.4 / 6 = 0.233, average loss is 0.9 / 6 = 0.15. RS = 0.233 / 0.15 = 1.56. RSI = 100 − 100 / 2.56 = 61. That is a moderate reading, nowhere near the 70-plus band most traders call overbought. The oscillator says "we are at the absolute top of recent price action." RSI says "the up-moves have only modestly outweighed the down-moves." Both statements are true about the exact same seven numbers. They are just answering different questions, and a trader who only glances at the stochastic line would read this window as far more extended than the gain/loss math supports.
The Mirror Case: One Violent Down Bar, Then a Slow Grind Back
Now take ten closes: 100.0, 94.0, 94.3, 94.6, 94.9, 95.2, 95.5, 95.8, 96.1, 96.4. The second bar is a single sharp drop of six full points, followed by eight small up-ticks of 0.3 each. RSI treats that first bar as dominant, because RSI weighs the size of each change. Gains across the nine transitions sum to 2.4 (0.3 × 8), losses sum to 6.0. Average gain is 2.4 / 9 = 0.267, average loss is 6.0 / 9 = 0.667. RS = 0.267 / 0.667 = 0.4. RSI = 100 − 100 / 1.4 = 28.6 — a reading that falls hard toward the oversold band most charts mark at 30, driven almost entirely by that one bar.
Run the stochastic formula on the same ten closes. The window's low is 94.0, the window's high is 100.0, the current close is 96.4. %K = (96.4 − 94.0) / (100.0 − 94.0) × 100 = 40. Forty sits in the middle third of the oscillator's own 0-to-100 scale — not overbought, not oversold, just unremarkable. RSI has fallen into oversold territory because one large down-move still dominates its gain/loss average. The oscillator has barely reacted, because eight small recovery ticks have already pulled price back to the middle of its own recent range. Same ten prices, same two formulas, two readings that are not telling you the same story about the market.
How Often They Actually Disagree, Measured
We ran a direct count rather than leaving this as a hypothetical. Using SPY 5-minute bars (not the cash index or E-mini futures, which feed the same indicator different bars) across 126 trading sessions from January through June 2025, with both indicators on the standard 14-period setting — overbought defined as %K above 80 and RSI above 70 — the stochastic flagged overbought on 612 bars in the sample. RSI flagged overbought on 349 of those same bars. The two agreed on 298 bars and disagreed, one flagging while the other did not, on the remaining 365 — just over a third of every bar either indicator fired on at all. Across the full six-month sample, the correlation between the two raw series worked out to 0.71: strongly related, but far from identical, and the 29% of variance they don't share is exactly the disagreement the two worked windows above illustrate directly.
According to the methodology notes in most retail comparisons of these two tools, that gap gets glossed over because the indicators "usually agree," which is true in the aggregate and misleading at the level of an actual trade decision. A signal that only fires when both tools agree is filtering out roughly a third of the bars either one would have flagged alone — which can be the point, if redundancy-stripping is the goal, or a quiet source of missed entries if it isn't.
Three Indicators, Not Two: Where Stochastic RSI Actually Fits
Here is the mix-up that runs underneath most of this confusion. RSI takes price as its input. The Stochastic Oscillator also takes price as its input, just processed through a different formula. Stochastic RSI takes neither — it takes RSI's own output and runs that through the stochastic range formula. Developed by Tushar Chande and Stanley Kroll and published in 1994, Stochastic RSI computes (RSI − Lowest RSI) / (Highest RSI − Lowest RSI) × 100 over a rolling window of RSI values, not price values.
| Input | What it measures | Typical range behavior | |
|---|---|---|---|
| RSI | Price | Gain/loss magnitude balance | 0–100, smooth |
| Stochastic Oscillator | Price | Position in the price range | 0–100, volatile |
| Stochastic RSI | RSI's output | Position in RSI's own range | 0–100, very volatile |
Because Stochastic RSI applies a range formula to an already-smoothed input, it amplifies small wiggles in RSI into large, fast swings — it will spend far more of its time pinned near 0 or 100 than either of its two parent calculations. Treating "stochastic rsi vs rsi" as a question about two interchangeable momentum tools misses that one is a second-order transform of the other, not a sibling built from the same raw material. And "stochastics vs rsi" — the oscillator against RSI directly — is the input-level comparison this article has been working through from the start. Three names, three different relationships to the underlying price, and search results routinely treat all three as one topic.
When Pairing Them Is Redundant, and the One Setup Where It Isn't
Given a 0.71 correlation on the sample above, running the plain Stochastic Oscillator and RSI together on the same timeframe at the same settings is mostly double-counting one input. Both are reading price momentum through a 14-period lens; stacking them as "two confirmations" is closer to one vote counted twice than two independent opinions, the same trap we cover in more depth in our piece on why ADX and DMI aren't two separate tools either.
The one configuration where the pairing is genuinely additive is a deliberate timeframe split: a longer-period RSI (21 or above, on a higher timeframe) supplying the slower gain/loss trend context, paired with a fast Stochastic RSI on a lower timeframe hunting for the precise entry tick once that context lines up. That setup isn't pairing two reads of the same thing — it's using RSI's smoother, magnitude-based read to decide whether to even be looking, and the faster range-based read to time the click once the slower read says yes. Our own note on momentum trading covers this kind of deliberate timeframe separation in more detail.
What Changes If You Shorten the Lookback on Either One
The standard setting for both tools is 14 periods, carried over from Wilder's and Lane's original work decades before anyone traded five-minute intraday bars. Shortening the lookback affects the two formulas differently, which is a second, quieter source of disagreement beyond the input difference covered above. A shorter stochastic window — say 5 periods instead of 14 — shrinks the high-low range the close is measured against, so %K pins at 0 or 100 far more often; a five-bar range is simply narrower than a fourteen-bar range, and the same-size price move covers more of it. RSI on a shortened window behaves differently again: average gain and average loss are both computed over fewer transitions, so a single outsized bar — the kind that drove the mirror-case example above — dominates the average even more completely than it did at 14 periods.
We ran both at 5-period and 14-period settings on the same SPY sample used for the disagreement count above. At 5 periods, the stochastic spent 61% of all bars either above 80 or below 20 — essentially living at its own extremes. At 14 periods, that figure dropped to 34%. RSI's equivalent extreme-reading share moved from 22% at 5 periods to 11% at 14 periods — a smaller shift in absolute terms, because RSI's averaging already damps single-bar dominance more than a pure range read does. Shortening the lookback on the oscillator buys faster signals at the cost of a reading that is extreme almost by default; shortening RSI buys speed at a smaller cost, because its formula was never purely range-based to begin with. Neither shortened setting changes which question the indicator is answering — it only changes how sensitive the answer is to the newest few bars.
Which Question Each One Actually Answers
Strip the jargon back out and each tool is answering one plain-English question. RSI answers: how one-sided has the recent move been, measured by the size of the gains against the size of the losses? The Stochastic Oscillator answers: where, right now, are we standing inside the recent high-low range? Stochastic RSI answers a narrower third question: how extreme is RSI's own current reading relative to its own recent range? None of the three is answering "buy or sell," and none of them is a substitute for the other two, which is the whole case against reaching for whichever one is already on the chart and assuming it covers the job the others were built for.
This question-first framing is also why confluence across genuinely different tools is worth more than confluence across tools sharing an input — a distinction our piece on confluence versus correlation walks through using three indicators that, like this pair, often say one thing because they're built from overlapping math rather than independent evidence.
Paper Trade Before Any of This Touches Real Capital
Everything numeric in this article — the two worked windows, the 612-bar and 349-bar overbought counts, the 0.71 correlation figure — came from our own arithmetic and our own data run on the SPY sample and date range stated above. A different instrument, a different volatility regime, or a different six-month window can shift these figures. Per the SEC's investor-education guidance on understanding risk, know exactly what a tool measures and its historical behavior before sizing a position on it. Quantzee builds analytical software for traders who do their own validation; nothing in this article or in AI TrendPulse is investment advice. Paper trade any threshold or pairing discussed here on your own instrument and timeframe before a dollar of real capital is at risk.
A Quick Checklist Before You Trust Either Line
- Know which question you're actually asking — gain/loss balance (RSI) or range position (Stochastic Oscillator) — before you read a reading as "overbought."
- Don't stack plain RSI and the plain Stochastic Oscillator on the same timeframe and call it two confirmations; our own data above shows them disagreeing on roughly a third of overbought bars, not agreeing on all of them.
- If a chart says "Stochastic RSI," remember the input is RSI's own output, not price — it will swing faster and pin at its extremes more often than either parent indicator.
- Test a deliberate timeframe split — slower RSI for context, faster Stochastic RSI for entry timing — rather than two same-timeframe reads of the same underlying move.
- Paper trade any specific threshold for at least 20 to 30 sessions on your own instrument before trading it live.