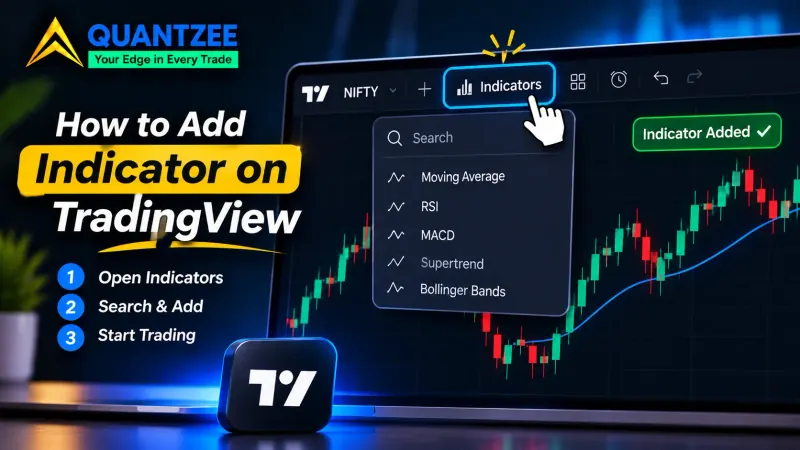
To remove an indicator on TradingView, open the chart legend at the top left, hover over the indicator's name and click the trash icon. On the phone apps, tap the small arrow under the symbol name to open the legend, then tap the trash icon. That's the click, and the part nobody explains is that TradingView gives you four different ways to make an indicator go away, and they don't do the same thing to your alerts, your saved layouts or your drawings.
Pick the wrong one and the indicator comes back the next time you open the chart, or you wipe out an afternoon of trendlines. Here's which one you actually want.
The four actions, and what each one really does
| Action | Where | What it does |
|---|---|---|
| 1. Hide (eye icon) | Legend or Object Tree | Stops drawing the indicator. It stays on the chart, keeps its settings and still counts against your indicator slots. |
| 2. Delete one (trash icon) | Legend, right-click menu, Object Tree | Takes that single indicator off the current chart and frees its slot. |
| 3. Remove Drawings & Indicators | Left toolbar, trash-can drop-down | Clears every indicator and every drawing on the chart in one go. |
| 4. Edit the layout or template | Layout menu, Indicator Templates | Changes what gets loaded next time. This is the one that makes a removal stick. |
Most people searching for this want action 2. Most people who come back confused a day later needed action 4 as well.
Why you're probably removing it: the per-chart indicator cap
Nobody wakes up wanting to delete an RSI, so usually TradingView has refused to add a new script because the chart is full. Each subscription tier caps how many indicators one chart can hold, and the free Basic tier sits at the bottom of that ladder. Hiding doesn't free a slot, and only deleting does.
We're not printing the exact numbers here, because TradingView revises its plans and a figure copied today goes stale within a quarter. Read the live limit per tier on TradingView's pricing page. Our companion post on how to add an indicator on TradingView lists the caps as read off that page on 9 November 2026, if you want a dated snapshot.
How to remove indicator on TradingView, step by step on each platform
The legend and the trash icon don't sit in the same place on every device, so here are the steps split four ways. Methodology: each step below was checked against TradingView's own help center articles on 13 November 2026, the same day this post went up.
Browser (Chrome, Safari, Firefox, Edge)
- Find the indicator's name in the legend, top left of the chart, under the symbol.
- Hover over it and four small icons appear: eye, gear, trash and a three-dot menu.
- Click the trash icon. Or right-click the indicator line itself and choose Remove.
- Shortcut: click the line once to select it, then press Delete on your keyboard.
Desktop app (Windows and macOS)
- The desktop app uses the same chart as the browser, so steps 1 to 4 above work unchanged.
- If you run several tabs, remember each tab holds its own layout. Removing an indicator in tab 1 leaves tab 2 alone.
- For a cluttered chart, open the Object Tree from the right-hand panel. It lists every indicator and drawing, with a delete option per row.
iOS (iPhone and iPad)
- Tap the small arrow button under the symbol name to expand the legend.
- Tap the trash icon next to the indicator to delete it, or the eye icon to hide it.
- Tap the gear instead if you only wanted to change its settings.
Android
- Tap the arrow under the symbol name to open the legend, then tap the trash icon to delete.
- To hide instead, tap the eye icon in the same legend.
- Second route, per the TradingView Android help page: open the Analysis Hub in the lower toolbar (next to the Drawings icon), scroll down, tap Object Tree, pick the indicator and change its visibility.
Hide versus delete: what happens to your alerts
This is where the difference starts to cost money for anyone running signal alerts. TradingView alerts run on its servers, and every alert you've created is listed in the Alerts manager with a status: green Active, orange Stopped, Triggered, or grey Stopped manually, according to the TradingView help center. Hiding an indicator is purely visual, so it doesn't touch the alert.
Deleting is less clear-cut, and we won't assert an outcome we can't show you. The behaviour of an alert after its source indicator is deleted has changed between TradingView versions, and the help center doesn't spell it out. So run this 2-minute check before you delete an indicator that has alerts on it:
- Open the Alerts manager in the right panel and note which alerts name that indicator.
- Delete the indicator from the chart.
- Look at the Alerts manager again. If those alerts still show Active, they'll keep firing. If they've stopped or vanished, you'll need to recreate them.
In our experience supporting Quantzee users, the "my alerts went quiet" ticket and the "an indicator I deleted is still sending me alerts" ticket both trace back to this one moment. So check the Alerts manager rather than guessing what happened.
Remove Drawings & Indicators is a sledgehammer
The help center gives this one a single sentence: click the left panel button, then Remove Drawings & Indicators. What it leaves out is the word "Drawings": every trendline, Fibonacci level, rectangle and note on that chart goes too.
Treat it as not undoable, because Ctrl+Z may bring things back in some sessions, but if the layout autosaves before you notice, the drawings are gone. Use it to reset a chart you've given up on, and never use it just to free one indicator slot.
Why a removed indicator keeps coming back
A chart layout keeps its own copy of every indicator on it. An indicator template keeps another copy. Delete the indicator from the visible chart and both copies can still be sitting there, ready to reload it.
Three common culprits, in the order to fix them:
- Autosave is off. You removed it, closed the tab, and the layout reloaded its last saved state. Delete again, then save the layout (Ctrl+S) or switch autosave on in the layout menu.
- A different layout is loading. If you keep several saved layouts, the indicator may live in the one that opens by default. Open each layout and remove it there.
- An indicator template re-applies it. Open the Indicator Templates menu next to the Indicators button. If a template includes the script, re-save it without, or delete the template. Otherwise every time you apply it, the indicator returns.
Do it in that order (chart, then layout, then template) and the removal sticks. When we write setup notes for our own indicators in the Quantzee installation and setup FAQ, this order is the one that settles most "it came back" questions.
Deciding what to remove
If you're freeing a slot, start with duplicates. Three momentum oscillators on one chart (RSI, Stochastic and a CCI, say) mostly tell you the same thing 3 times. Two moving-average ribbons drawn over price usually do too. Keep one tool per job: one for trend, one for momentum, one for volatility or volume.
Our team has written about this in more depth in the guide to trading indicators and signals, which covers how to stack tools without doubling up. If you're replacing a script rather than just clearing space, our ranked list of affordable TradingView indicators compares one-time options, and the 2026 TradingView indicator roundup covers the wider field.
One honest caution: fewer indicators won't make a strategy profitable on its own. The SEC's investor education site notes that technical analysis studies past price and volume, and FINRA's guidance on day trading risks is worth reading before you trade any setup, cluttered or clean. Quantzee builds analytical software, not trade advice.