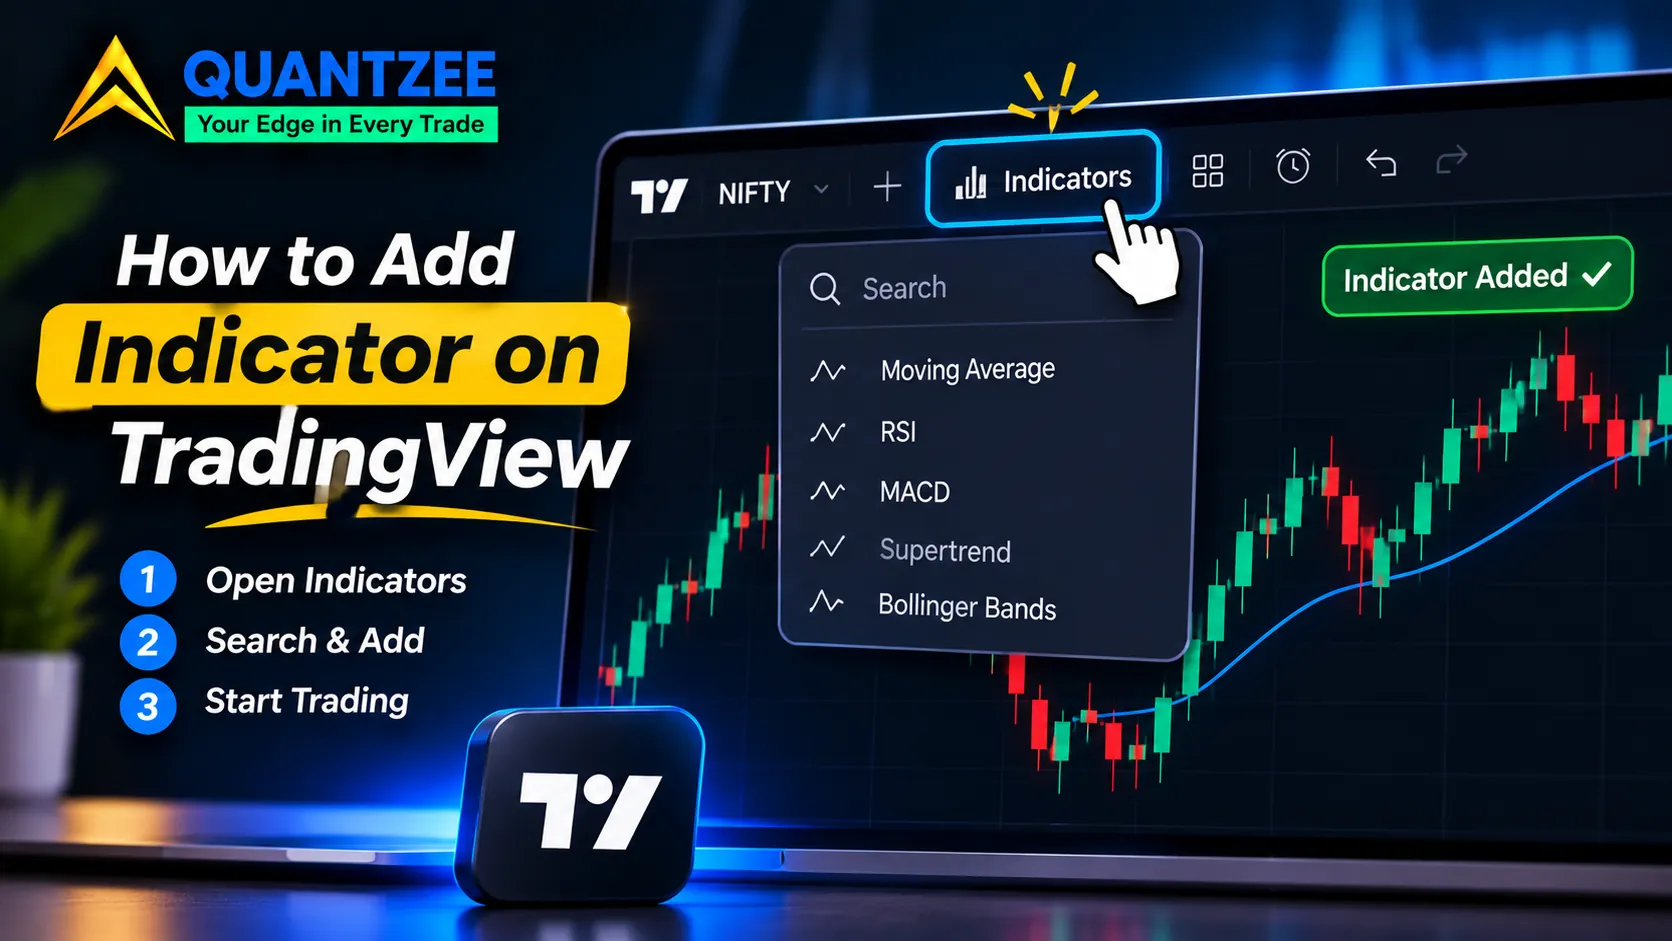
To add an indicator on TradingView, open the chart, press / (or click Indicators in the top toolbar), pick a script and click it once. That part takes about ten seconds on any symbol, even though SPX, SPY and ES feed it different bars. What actually stops people is different: the script may live in one of four separate places, and every plan caps how many indicators one chart can hold. This post maps both, with the caps read from TradingView's own pricing page on 9 November 2026.
Quantzee sells Pine Script indicators, so people write to us when "add indicator TradingView" goes wrong. In nearly every case it is not the clicks. It is a script sitting in a tab the person didn't open, or a chart that has quietly hit its ceiling, and that holds whether it's a live chart or a practice account set up for a paper trading contest like The Leap.
The clicks, once
For a built-in or community script, the whole job is three steps. Open a chart. Press the / key, which opens the indicator picker, or click Indicators in the top toolbar. Search for the name, click the result, close the window. The script draws on your chart straight away.
That's it. Every other guide on this keyword spends 1,500 words stretching those three steps. We'd rather spend the words on the part that breaks.
The four tabs a script can live in
The picker is not one list. TradingView groups scripts by where they come from and who may use them. The labels shift when the interface is redesigned, so read these as four kinds of source rather than four fixed button names. We describe the panel from how it is organised, because the exact wording has changed more than once.
1. Built-in technicals
Moving averages, RSI, MACD, Bollinger Bands, VWAP and the rest of the standard set. TradingView ships them, every account can use them, and nothing needs approval. If your search finds the name here, you are done.
2. The public community library
Thousands of open-source scripts written by other users. Anyone can add them. You can read the source, copy it and edit your own version. Search by name, then check the author and the update date before you trust one, because a script nobody has touched in years may use an old Pine version.
3. Invite-only scripts
This is the one that trips people up. An invite-only script is published with its source hidden, and the author decides who may use it. The author adds your TradingView username to an access list. Only then does the script appear in its own tab inside your picker.
Nothing you do on your side makes it appear sooner. Reinstalling, refreshing and logging out won't help, and typing the script's name into the community search will find nothing, because you aren't on the list yet. If you bought access and can't see the script, the first thing to check is that the seller has the exact username you use on TradingView, not your email address. A misspelled username is the most common reason a paid script stays invisible.
4. Your own saved scripts
Anything you've written or pasted into the Pine Editor and saved lives under your personal scripts. This is where a Quantzee indicator ends up: you paste the code into the Pine Editor, save it, and from then on it's listed under My scripts in the picker, on desktop, tablet and mobile. The step-by-step version is in our installation and setup FAQ. Note that the pasting step needs a desktop browser, since the Pine Editor isn't in the mobile app.
Favourites are a fifth shelf of sorts, but they only bookmark scripts from the four above. They don't create access.
The ceiling: indicators per chart, by plan
Every TradingView plan limits how many indicators one chart can hold. This number is the real reason a fourth or sixth script refuses to load. Published guides disagree about it, much like the setup guides for connecting Tradovate to TradingView disagree on prerequisites. We compared several how-to articles for this post and found the free-tier figure quoted as two, as three and as five. They can't all be right, so we didn't copy any of them.
Methodology: we read the Features comparison on TradingView's pricing page on 9 November 2026 and copied the "Indicators per chart" row. We didn't take any figure from a blog, including our own earlier pages. We did not open every plan's chart to count by hand. The pricing page is the source, so check it again before you rely on a number. Plans change.
| Plan | Indicators per chart | Financials per chart | Custom indicator templates |
|---|---|---|---|
| Basic (free) | 2 | 1 | 1 |
| Essential | 5 | 4 | Unlimited |
| Plus | 10 | 7 | Unlimited |
| Premium | 25 | 10 | Unlimited |
| Expert | 30 | 15 | Unlimited |
| Ultimate | 50 | 25 | Unlimited |
Checked 9 November 2026 on tradingview.com/pricing. Plan names and limits are TradingView's and can change without notice.
One detail matters more than the table. A built-in like RSI counts against the ceiling exactly as a paid script does. On a free chart, RSI plus one more script fills both slots. Count what's in the legend, not what you assume is there. If you're weighing whether a higher plan is worth it for the extra slots alone, our piece on whether indicator subscriptions pay for themselves works through the arithmetic, and the affordable TradingView indicators guide lists what the platform plans cost alongside the scripts.
What hitting the ceiling looks like
You click to add one more script and TradingView refuses. You get a prompt to upgrade rather than an explanation of which slots are used. That's a design choice on their side, and it's why people assume the script is broken. It isn't. The chart is full.
You have three ways round it.
- Remove one. Hover the name in the chart legend and use the delete icon, or right-click the script and choose remove. This frees the slot immediately.
- Consolidate. One script can draw several things at once. A single indicator that plots a trend line, a band and a signal marker uses one slot where three separate scripts would use three. On a 2-slot chart this is the only way to see more.
- Move to a plan with a higher cap. Going from 2 to 5 is the first jump. After that the next steps are 10 and 25.
A fourth route doesn't work, and people try it constantly: opening a second chart tab. The ceiling applies per chart, but each plan also limits how many charts you can have in one tab layout, so splitting the work across charts has its own cost.
Hide versus remove
The eye icon in the legend hides a script. It does not unload it. A hidden indicator keeps calculating, keeps its settings, and keeps counting against the chart. So hiding three scripts to make room for a fourth does nothing on a full chart, and you need the delete steps that actually free a slot instead.
Use hide when you want a clean view for a screenshot and plan to bring the script back in a minute. Use remove when you want the slot. If you remove something you'll need again, the script still sits in your list, and re-adding takes the same three clicks.
Saving the arrangement so it survives
People lose their setup because two different features get confused.
A layout saves the whole chart: the symbol, timeframe, every indicator on it, your drawings and the colours. Save one and the same screen comes back next session, on any device you sign in to.
An indicator template saves just the list of indicators and their settings, with no drawings and no symbol. You apply it to any new chart to drop the same stack on in one click. The free Basic plan allows 1 custom template. Every paid plan lists unlimited, per the pricing page row for custom indicator templates.
Rule of thumb: layouts for "my usual screen", templates for "this stack on a chart I just opened".
Settings to check right after you add one
A new script arrives with defaults chosen by its author. Three of them change what you're looking at.
- Source. Most scripts calculate from the close. Some use hl2 or open. The same script on a different source gives different numbers.
- Pane. Overlays draw on the price. Oscillators get their own pane below. A script in the wrong place looks broken when it's working fine.
- Timeframe. Some scripts follow the chart's timeframe. Others are locked to a fixed one, such as a daily moving average showing on a 5-minute chart. Open the script's settings, read the Inputs tab, and note which one you have.
Two checks before you trust a new script
Adding a script proves nothing about whether it's reliable. Two quick checks come first.
Does it repaint on the live bar? Some scripts show a signal while the candle is forming, then move or delete it when the candle closes. The history looks perfect and the live behaviour doesn't match it. Bar Replay is the quickest way to watch it happen, and we walk through the whole method in our guide to testing a TradingView indicator for repainting.
Does the bar type change what it reports? A script built on standard candles can behave differently on Heikin Ashi, Renko or range bars, because those bar types are computed values, not raw prices. If you chart on anything other than regular candles, test the script on that bar type.
This is a post about mechanics, not performance. Nothing here says any indicator is worth using. For background on what the whole toolkit is meant to do, Wikipedia's overview of technical analysis is a neutral starting point, and the investor education pages at FINRA cover the risks of trading generally. Our software is analytical, not advice, and you should test any setup on a paper account first.
If you want alerts on the script you've just added, the next job is wiring them to your phone. We've written that up in a mobile alert workflow for TradingView. For a wider look at which scripts are worth the slots, see our TradingView indicators for 2026 roundup.