Two Kinds of Stock Market Indicators Hiding Behind One Search
Type "stock market indicators" into a search engine and you get two piles of pages that never mention each other. One pile covers market-level tools: the advance-decline line, new highs against new lows, the put-call ratio, volatility indexes. The other pile is a list of single-chart tools like RSI, MACD and moving averages, applied to one ticker at a time. Both piles use the same label, yet they answer two different questions.
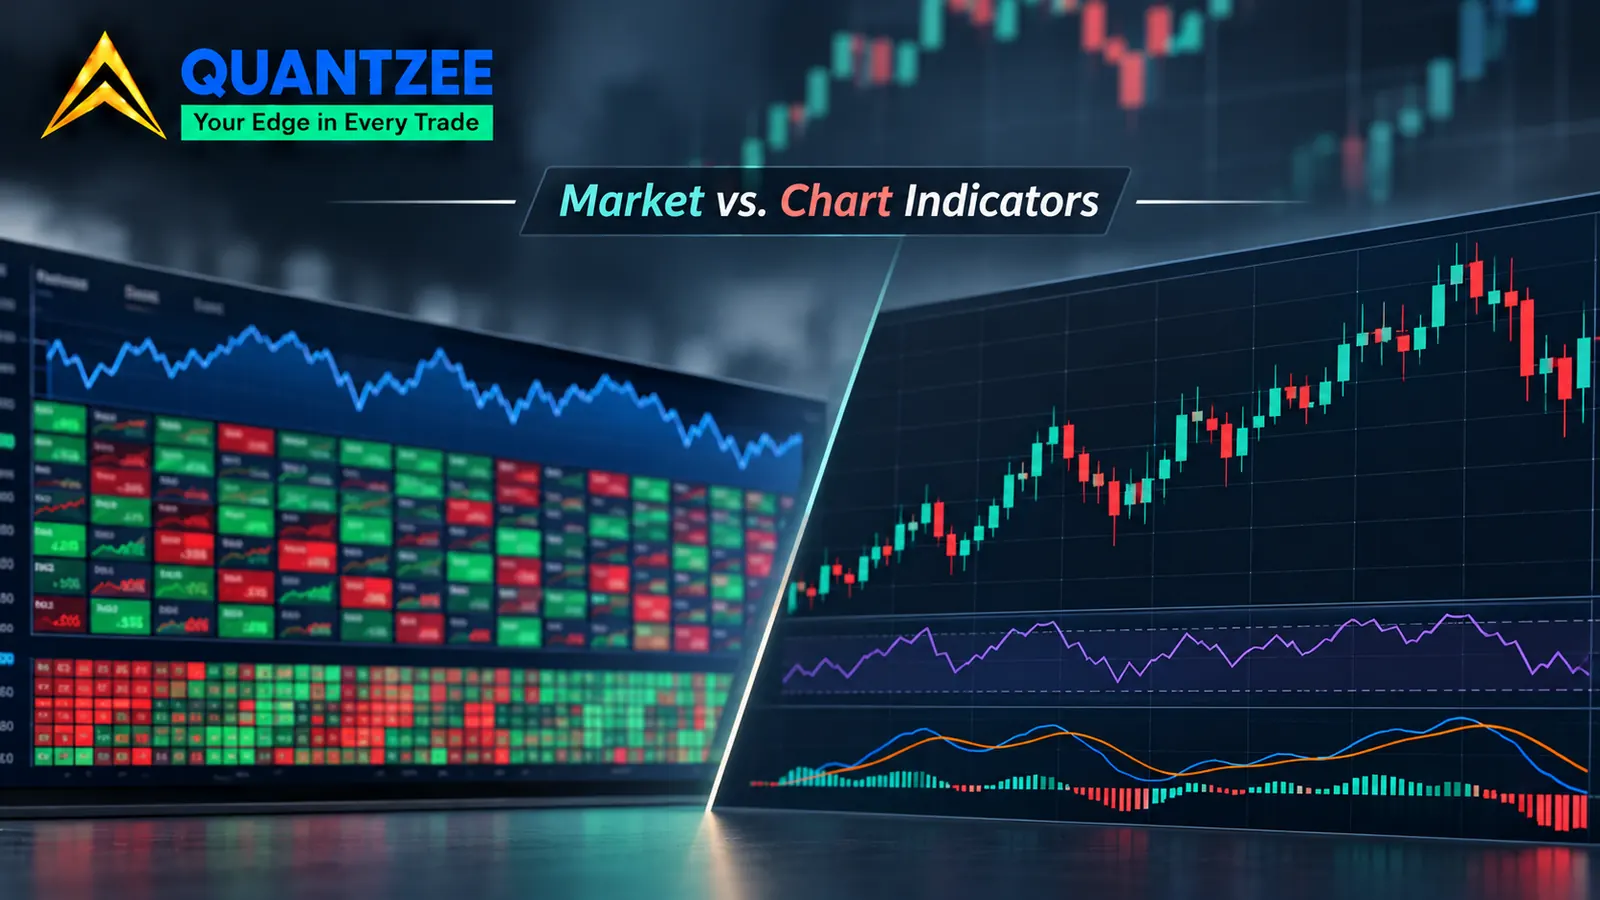
A market-level indicator asks: is the market as a whole taking part in this move? A chart indicator asks: what is this one instrument doing right now? Mix the two up and you end up using a timing tool to answer a participation question it can't see. That is the point this article is built around, so instead of one more list of tools, it sorts the field by the question each tool answers.
The finding to keep in mind from the start is simple: a breadth or sentiment reading can contradict the index itself, because an index can rise while the number of rising stocks shrinks. No indicator computed from the index price can detect that, however clever the formula.
The Clean Definitions
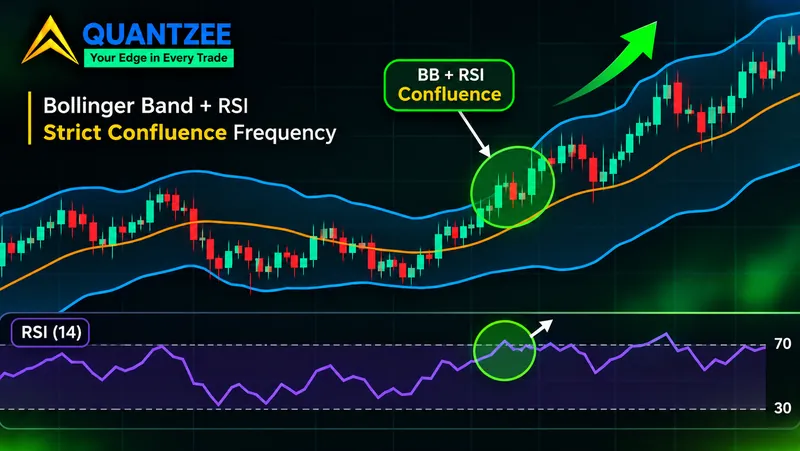
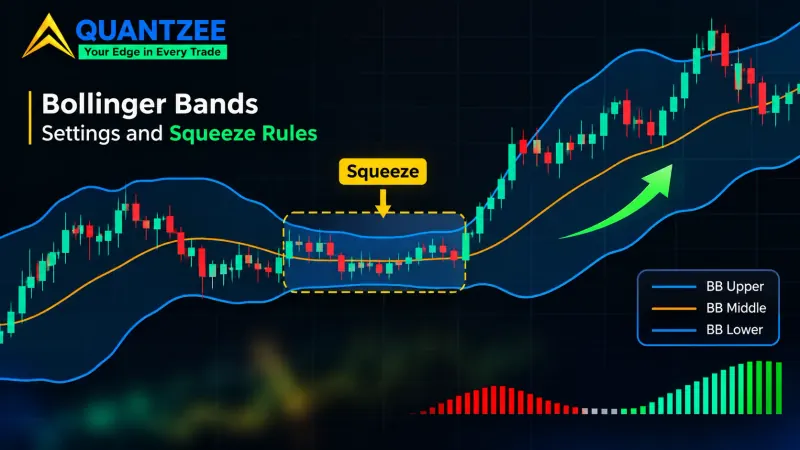
Here is the split, stated plainly, so a reader can sort any tool in a few seconds. A market-level indicator is computed from data across many securities. It counts how many stocks advanced versus declined, how many hit new 52-week highs versus new lows, how many puts traded against calls, or what options imply about future movement. A chart indicator is computed from the price and volume of one series. RSI, MACD, Bollinger Bands, the stochastic and every moving average fall in this group.
The classification itself isn't ours. According to the StockCharts ChartSchool market indicators hub, market indicators split into breadth, sentiment, momentum and volatility groups, all built from many issues rather than one chart. The Corporate Finance Institute's market indicator entry draws the same line between market indicators and technical indicators. What both sources stop short of is the practical part: when the two families disagree, and which one to trust for which job.
| Question | Family | Input data | Examples |
|---|---|---|---|
| Is the market participating? | Breadth | Counts across a universe of stocks | Advance-decline line, McClellan oscillator, high-low index |
| How are traders positioned? | Sentiment | Options volume, signal counts | Put-call ratio, bullish percent index |
| How much movement is priced in? | Volatility | Option prices on an index | VIX, VSTOXX |
| What is this ticker doing? | Chart indicators | One price and volume series | RSI, MACD, moving averages, stochastic |
Why the Index Can Rise While Most Stocks Fall
This is the part that makes the split matter. Most headline indexes, the S&P 500 and the Nasdaq 100 among them, are cap-weighted, which means a stock's weight in the index is set by its total market value. As Investor.gov's definition of a market index notes, an index tracks a basket, and how the basket is weighted decides what the index really reports.
Take a toy index of 10 stocks, where two giants make up 30% of the weight each, so 60% between them. The other 8 stocks hold 5% each, which is the remaining 40%. Now picture one session in which the two giants gain 3% and all 8 smaller names lose 1%.
The index return is 0.60 × 3% minus 0.40 × 1%, which is 1.8% minus 0.4%. The index closes up 1.4%. Count the stocks, though, and the picture flips: two advanced, 8 declined, and net advances for the day are -6. The equal-weighted average return is (2 × 3% − 8 × 1%) ÷ 10, which is -0.2%. The headline number says "strong day," while the typical stock in the basket had a losing day.
Now run your favourite chart indicator on that index. RSI, MACD, a 50-day moving average: every one of them takes the index closing price as its input. That closing price already has the 1.4% gain baked in. None of them can recover the fact that 8 of 10 stocks fell, because that information was thrown away when the weighted average was calculated. You can't rebuild it from the output, no matter how the formula is tuned.
This isn't just a classroom case. Our own breadth write-up on the McClellan oscillator covers how a handful of mega-cap names carried the S&P 500 and the Nasdaq 100 higher across 2023 and 2024, while the median stock drifted sideways or lower. The index chart looked healthy for long stretches of that period, while breadth told a much weaker story.
The Breadth Family: Market Breadth Indicators
Market breadth indicators count heads and ignore market cap entirely, so a $3 trillion company and a $3 billion company each count as one vote.
The advance-decline line
Each day, subtract declining issues from advancing issues and add the result to a running total, and that running total is the advance-decline line. If the index makes a new high and the A-D line doesn't, fewer stocks are carrying the move. The Wikipedia entry on the advance-decline line gives the same construction and the same reading.
The McClellan oscillator
The McClellan oscillator is a smoothed derivative of the same daily net advances. Sherman and Marian McClellan introduced it in 1969, and it runs a 19-day EMA and a 39-day EMA on net advances and subtracts the longer from the shorter. Per our McClellan article, readings above roughly +70 to +100 have historically marked short-term overbought breadth, and readings below roughly -70 to -100 have marked oversold breadth. Those bands drift as the number of listed issues changes, so treat them as a starting point, not a rule.
The high-low index
This one compares stocks making new 52-week highs with stocks making new 52-week lows. A common form is new highs divided by the sum of new highs and new lows, shown as a percentage and often smoothed with a 10-day average. A reading of 80% says 4 out of every 5 stocks at an extreme are at the top end.
One more practical point on breadth: the readings move most when they disagree with price, not when they agree. When the index and the A-D line rise together, breadth simply confirms what the chart already shows. The useful moments are the gaps, such as an index at a new high while fewer stocks make new highs each week, or a high-low index sliding from 80% toward 50% while the headline number keeps climbing. Those gaps are where a breadth line earns its place on your screen, and they are exactly what a price-only tool on the index will never show you.
The universe is part of the indicator
Every breadth line needs a stated universe, because NYSE breadth, Nasdaq breadth and S&P 500 constituent breadth are three different lines, even on the same day. NYSE counts have long included closed-end funds, preferred shares and REITs. Nasdaq skews toward smaller, speculative names, while S&P 500 breadth only counts the 500 members. The same "A-D line" on a different universe is a different indicator. Before you quote a reading to anyone, name the exchange or index it came from. Our team treats the universe as a required input for exactly this reason.
The Sentiment Family: Sentiment Indicators and Their Traps
Sentiment indicators try to measure how traders are leaning, and two of them are worth knowing well.
The put-call ratio divides put volume by call volume over a session. A reading of 0.9 means 90 puts traded for every 100 calls. Our put-call ratio glossary entry covers how a high reading tends to show fear and a low one tends to show confidence. The trap is reading the number without knowing the normal range of that particular ratio. An equity-only ratio and an index-options ratio live in different ranges, because index puts are bought heavily as portfolio hedges. A 1.1 that is routine on one series can be extreme on another. Compare a reading to that same series' own history, never to a number you saw quoted for a different ratio. The put/call ratio reference also notes that the ratio is commonly read as a contrarian gauge, which makes knowing the baseline even more important.
The bullish percent index is a ratio of a different kind. It is the percentage of stocks in a chosen universe that currently show a point-and-figure buy signal. StockCharts files it under sentiment alongside the put-call ratio. Traditional readings above 70% are treated as overbought and below 30% as oversold. Same trap: those levels came from specific universes, and a sector BPI with 40 stocks behaves very differently from one built on 500.
The Volatility Family: The Price of Movement, Not Its Direction
Volatility indexes form a third family, and its most widely quoted member, the VIX, is derived from S&P 500 option prices and expresses the market's expected 30-day volatility as an annualised percentage. A VIX of 20 implies roughly a 5.8% one-standard-deviation move over the next month, since 20 divided by the square root of 12 is about 5.77.
The key point is what it doesn't tell you: a volatility reading describes how much movement option buyers are paying for. It says nothing about which way. A rising VIX often comes with falling stocks, but that is a pattern in how hedging demand behaves, not a directional reading built into the formula. If you want to read volatility across regions, our piece on reading VIX, VSTOXX and crypto volatility together goes deeper.
What Chart Indicators Do Well
None of this makes chart indicators weak, since they are built for a different job and they do it well. Search "technical indicators stocks" and almost every result is about this family, for good reason. Applied to one instrument, chart indicators answer three practical questions:
- Timing. Is momentum fading or building on this ticker today?
- Entry location. Is price stretched from its average, or near a level where risk is easy to define?
- Trend state. Is this instrument trending, ranging, or turning?
Our guide to trading indicators and signals walks through how the main chart tools are built and read. What none of them can do is answer the participation question. Stack ten of them on the S&P 500 and you still have ten views of one weighted price. In our experience building indicators, this is the most common category error we've seen: someone asks "is this rally broad?" and checks RSI on the index to find out.
The Stacking Fallacy
A related mistake is treating agreement between chart indicators as independent proof. RSI, the stochastic and CCI are all computed from the same closing prices over similar lookbacks. When all three say "overbought," you have mostly read one signal three times. We covered this in detail in why three indicators often say one thing. The fix isn't more chart tools. It's a second input. A breadth reading uses different raw data, so when it agrees with your chart, that agreement actually carries information.
Data Availability Is a Hard Limit
Market-level indicators need constituent data: daily counts of advancing and declining issues, new highs and lows, options volume. That data isn't attached to every symbol. You can plot RSI on any chart in seconds, but you can't plot a high-low index on a single stock, because there is nothing to count.
A second limit catches people often. A cash index such as the S&P 500 index itself carries no traded volume, since you can't trade the index directly. Volume-based tools like OBV, volume-weighted averages or money flow are inert on it. They read zero or a stand-in series, depending on the data feed. If a volume indicator on a cash index looks strange, that's why. Use an ETF or futures contract that tracks the index if you need real volume, and say which one you used.
A Decision Rule You Can Keep
The whole article comes down to three lines:
- Ask the participation question with a breadth or sentiment reading. Is the move broad, and how are traders positioned?
- Ask the timing question with a chart indicator. Where is this instrument, and is its momentum changing?
- Never substitute one for the other. A chart tool on an index can't tell you about breadth. A breadth line can't tell you where to enter a single stock.
Here is how it plays out. Suppose the index is at a new high and your chart indicators look strong. Then you check the A-D line on S&P 500 constituents and it peaked weeks ago. That doesn't mean sell; it means the rally is narrow, and you now know something the chart alone was hiding. A narrowing rally is a fact about market structure, not a timing signal. We haven't run a measured study on how often breadth divergences come before index turns, and we won't quote a hit rate we haven't measured. Paper trade first with any rule built on either family.
A note on methodology: the classification above follows the StockCharts and CFI groupings with attribution. The divergence example uses a stated toy index so the arithmetic can be checked line by line. The breadth definitions and figures come from Quantzee's own McClellan article, reused as published there. If you trade US stocks and want to see how chart tools fit around US session hours and volatility, our US stock trading indicators guide is the natural next read.