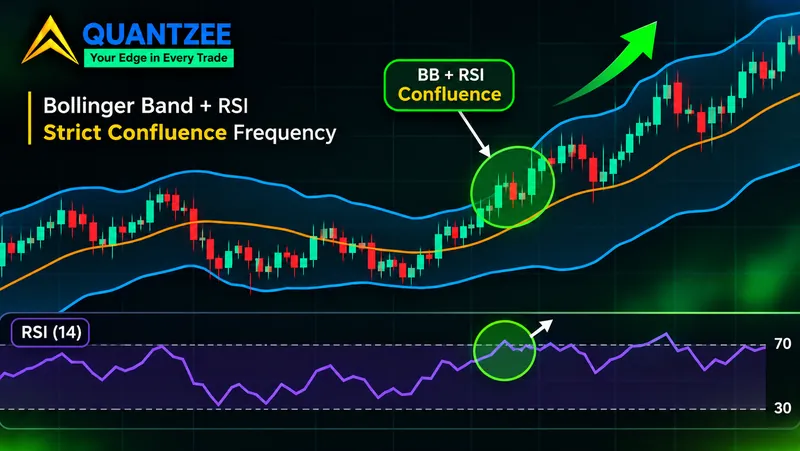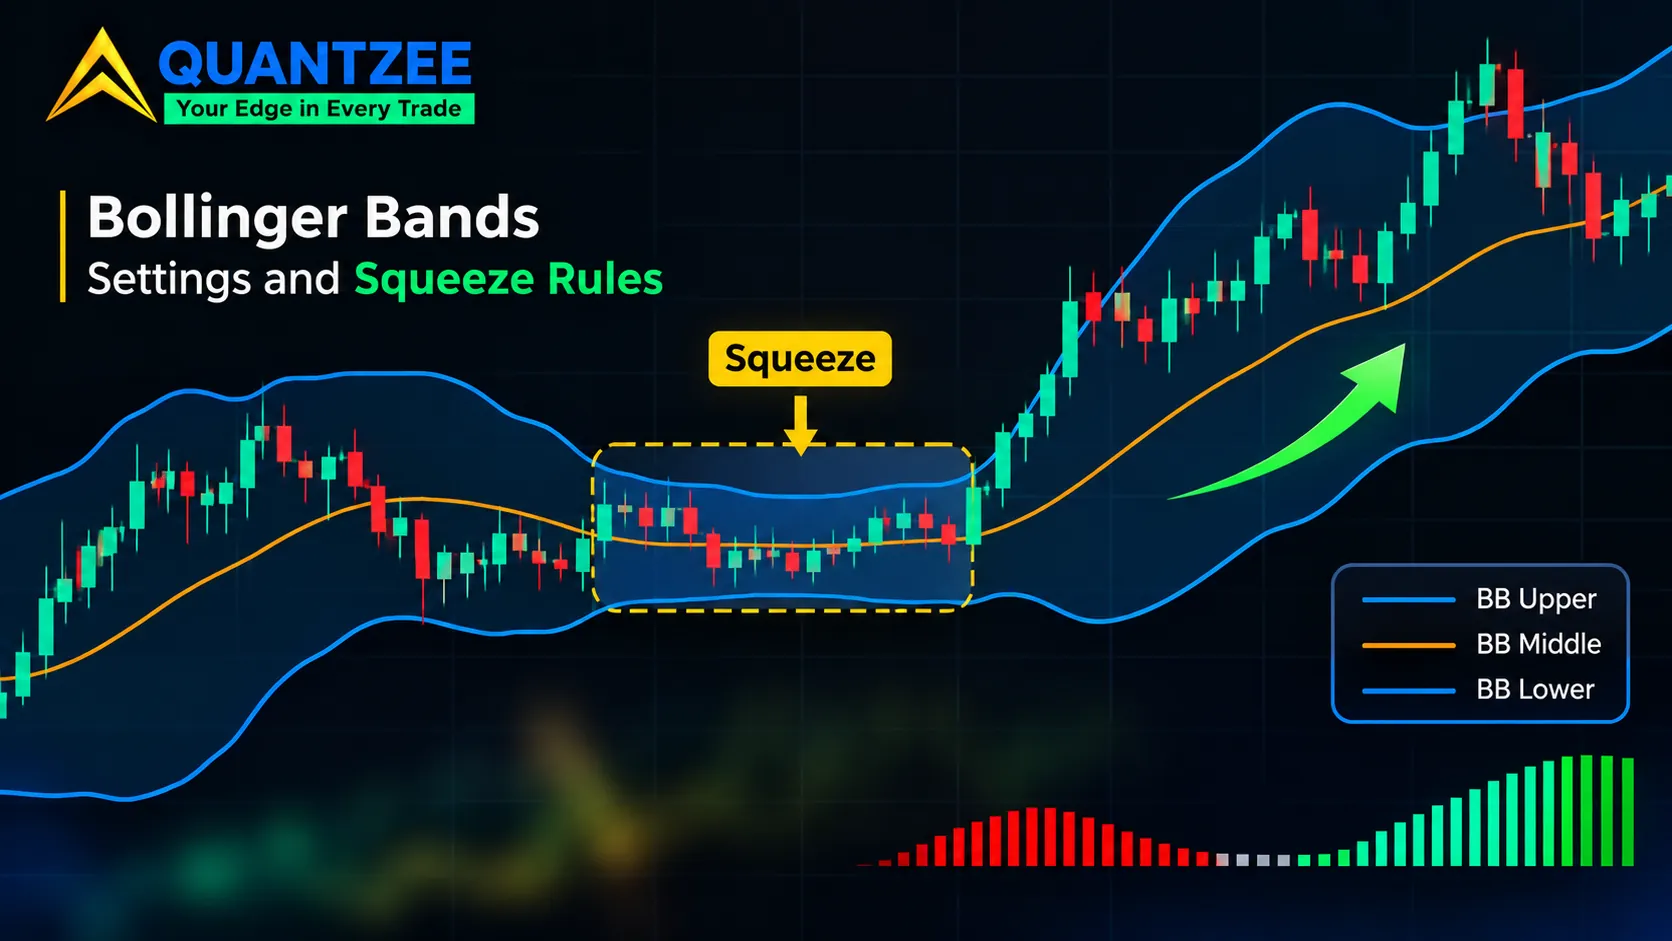
Bollinger Bands are a 20-bar moving average with a band two standard deviations above and below it. That sentence is the whole construction. Everything people trade off them, the squeeze, the bounce, the "walk the band" move, comes from two numbers derived from those lines: percent b and bandwidth. This guide is about those two numbers, and about one question the popular squeeze articles all skip, including whether a second filter such as the Bollinger and RSI pairing fires often enough to matter. When someone says "the bands are squeezed," squeezed by which rule?
The short answer: there are at least three rules in circulation, they flag very different bars, and none of the three pages that publish them shows evidence that a squeeze is followed by a bigger move. Below we lay the rules side by side, count what each one flags on the same chart, and say plainly what that does and doesn't prove. If you want the plain definition first, the Bollinger Bands glossary entry covers it. Here we start one step later.
Bollinger Bands settings: what 20 and 2 actually are
The default is a 20-period simple moving average as the middle line, with bands at plus and minus two standard deviations of the same 20 closes. John Bollinger describes 20 and 2 as defaults, not laws. His own published rules say the right numbers depend on the market and timeframe, and that if you lengthen the average you should widen the multiplier (the Bollinger Band rules page gives 2.1 at 50 periods and 1.9 at 10 as examples). So "best settings" has no single answer. What you can say is which direction each change pushes things.
A shorter average makes the bands twitchy. They hug price, touch more often and flatten out faster. A longer one smooths everything and makes a band touch rarer and slower. A larger multiplier pushes the bands outward so fewer closes land outside. A smaller one does the opposite. None of that is better or worse in the abstract. It changes what a "touch" means, so a setting you picked for one chart quietly redefines every signal you read off it.
One more point on construction. Bollinger's standard deviation is the population form, dividing by N rather than N minus 1. Some platforms use the sample form and the bands come out slightly wider. On a 20-bar window the gap is small, roughly 2.6%, but if you compare numbers across two charting packages and they don't match, check this before blaming the data.
Percent b: where price sits inside the band
Percent b is a fraction. Take the close, subtract the lower band, divide by the distance between the bands. A value of 1 means the close is exactly on the upper band. A value of 0.5 means it sits on the middle line. A value of 0 is the lower band. Readings above 1 or below 0 mean the close is outside.
That's all it says. It answers "where inside the band is price?" and nothing about whether to buy or sell. A percent b of 1.1 can show up at the start of a strong trend or at the exhaustion of a spike, and the number can't tell you which. Treating it as a signal is the common mistake, and it's the reason percent b "divergence" deserves a careful look.
Price makes a higher high while percent b makes a lower high: that's the setup people call a divergence. But percent b is a statement about price relative to the band, and the band itself moves. If volatility expanded between the two highs, the upper band moved up and away, so the second high can be higher in dollars and still sit lower inside the band. Nothing about momentum changed. The ruler stretched. A price divergence compares two highs on one fixed axis. A percent b divergence compares two positions on an axis that was redrawn in between. They are different observations, and the second one is weaker evidence of anything.
The Wikipedia entry on Bollinger Bands gives the percent b and bandwidth formulas in the same form used here, which makes it a handy cross-check for your own spreadsheet.
Bandwidth: the volatility series that squeezes are read from
Bandwidth is the upper band minus the lower band, divided by the middle line. With default settings it works out to four times the standard deviation divided by the average, so it is a volatility measure stated as a percentage of price, unlike ATR, which stays in price units. Divide by the middle line and a 20-point band on a 1,000 index and a 2-point band on a 100 stock both read as 2%. That normalisation is the reason bandwidth can be compared at all across price levels.
It is still an incomplete fix. Percentage width removes the price level, but not the instrument's own character. According to the StockCharts ChartSchool bandwidth page, a utilities fund will have consistently lower bandwidth than a technology fund because it is consistently less volatile. So a bandwidth of 4% is quiet for one and loud for the other. And the same instrument drifts between regimes. As we show below, a market can spend a whole year with a median bandwidth of 2.6% and another with a median of 9.7%.
The three squeeze rules in circulation
Search for how to identify a Bollinger squeeze and three kinds of rule come up. They are different kinds of rule, not three settings of the same rule.
Rule one: a fixed 2% bandwidth. A TradingSim guide says that, according to John Bollinger, bandwidth falling below 2% (0.02) has preceded big moves in the S&P 500, and illustrates it with three instances where the index later fell 5.6%, 3.6% and 7.6% from a short-term top. The page gives no sample size, no count of how often the level was hit without a move, and no discussion of other instruments. See the TradingSim bandwidth article.
Rule two: a relative, chart-specific level. The StockCharts page says outright that narrow bandwidth is relative. It tells you to look back over roughly eight to twelve months to define the range for each security, then marks symbol-specific lines: its Alaska Airlines example dips below 10 (that is, 10%), and its Aeropostale example draws a line at 8. Those are levels read by eye on two particular charts. The page offers no way to carry them elsewhere.
Rule three: a percentile of recent history. The long Trading Compendium guide ranks bandwidth against its own past. Its interpretation table calls a reading below the 5th percentile over six months an extreme squeeze, and its squeeze breakout setup uses the lowest percentile of the last 120 periods. It also says plainly that no published reference study backs that strategy with reliable figures.
Notice what the three have in common. Each states that low volatility is followed by high volatility as a premise. None of the three measures it. We'll come back to that.
Counting squeeze bars: three rules, one chart
Here is the exercise none of those pages runs. We applied each rule to the same instrument over the same window and counted. The instrument is SPY, the S&P 500 ETF, using daily closes from 7 November 2016 to 6 November 2026, which gives 2,495 bars with a valid 20-bar bandwidth. Bands are 20-period SMA with 2 population standard deviations, as above. This is arithmetic on public price data, run by us for this article, using unadjusted daily closes pulled from Yahoo Finance's chart feed. It is one instrument and one window, so read it as an illustration of how the rules behave, not a general result.
| Rule | Bars flagged | Share of 2,495 bars | Separate episodes |
|---|---|---|---|
| Fixed: bandwidth below 2% | 82 | 3.3% | 11 |
| Fixed: bandwidth below 5% | 1,163 | 46.6% | 53 |
| Fixed: bandwidth below 8% (StockCharts-style example level) | 1,966 | 78.8% | 39 |
| Percentile: at or below the 5th percentile of the trailing 120 bars | 161 | 6.5% of the 2,376 bars with a full 120-bar lookback | 37 |
An "episode" here is a run of consecutive flagged bars. Three things stand out.
The first is the disagreement. The 2% rule and the 120-bar percentile rule overlap on only 17 bars. The 2% rule flags 65 bars the percentile rule ignores, and the percentile rule flags 144 bars the 2% rule never sees. They are not two views of one event. They are two different events that share a name.
The second is timing. Of the 82 bars below 2%, 73 fall in 2017 and 9 in 2018. Not one bar since the start of 2019 gets there. Over those years the median bandwidth was 2.6% in 2017, 5.4% in 2018, 7.7% in 2020 and 9.7% in 2022, and 3.9% in 2026 so far. A trader using the 2% rule on this chart would have seen nothing for nearly eight years, while the percentile rule fired in every single year, between 8 and 26 bars per year.
The third is the other direction. A 5% line flags nearly half of all bars, and an 8% line flags almost four in five. The levels in the StockCharts examples were right for those stocks in those periods. Dropped on a broad index ETF, they stop meaning "narrow" and start meaning "ordinary."
Why an absolute threshold travels badly
Two reasons, and we measured both of them above rather than assuming. One: instruments differ. A utilities fund and a semiconductor fund do not share a normal bandwidth, so one fixed percentage can't mean "quiet" for both. Two: the same instrument changes. In this window SPY's yearly median bandwidth ranged from 2.6% to 9.7%, nearly a fourfold swing. A fixed line set in a calm year goes silent in a turbulent one, and a line set in a turbulent year fires constantly in a calm one.
There's also a plain-dollar version of the problem. A 2% bandwidth on a fund trading around $213, as SPY did at the start of this window, is a band about $4.30 wide. The same 2% when it trades around $735 is about $14.70 wide. The percentage is identical. The distance price has to travel to leave the band is not. Whatever "squeeze" is measuring, it isn't stable in the units a trade is actually sized in.
The percentile construction, and the lookback nobody tests
The percentile rule fixes the travel problem by making the threshold relative to the instrument's own history. The calculation is short. Take the last N bandwidth values, including today's. Rank today's value among them. If today's value is at or below the 5th percentile of that set, flag a squeeze. We used N of 120, matching the Trading Compendium setup.
What a 5th-percentile reading says is narrow: today's bands are as tight as they've been on about 1 day in 20 over the lookback. It asserts nothing about what comes next. It is a description of the present relative to the past, and that's all it is.
The part that rarely gets tested is the lookback itself. Same data, same 5th percentile, only the window changed:
| Lookback | Bars flagged | Separate episodes |
|---|---|---|
| 60 bars | 235 | 56 |
| 120 bars | 161 | 37 |
| 250 bars | 136 | 27 |
Moving from 120 to 60 bars adds about 46% more flagged bars and 19 more episodes, with the percentile figure unchanged. Nothing in the three source pages says which window is right, and the choice isn't cosmetic. A "squeeze" under the 60-bar rule includes bars that the 250-bar rule would call unremarkable. Anyone backtesting a squeeze should treat lookback length as a parameter that changes the sample, not a footnote.
The claim none of the pages supports
Every one of the three sources, and most of the articles built on them, says a squeeze is followed by expansion. That might be true. Volatility does tend to cluster and mean-revert, and that's a reasonable prior. But "volatility is mean-reverting in general" is a weaker claim than "this specific squeeze rule, on this instrument, is followed by a bigger move more often than a random bar is." Only the second one would justify trading it.
The Trading Compendium page is honest about the gap. TradingSim shows three cases and no misses. StockCharts shows hand-picked charts. We're not asserting the claim either. In this article we counted squeeze bars; we did not measure what followed them.
What would settle it is a fair comparison: for each rule, the distribution of forward realised volatility or forward range after a flagged bar, against the same distribution after every other bar, with the same lookback, over enough independent episodes to mean something, and with overlapping flagged bars not counted as separate samples. Note how few independent episodes there are. The 2% rule produced 11 on this chart, and most of them sit in a single calm year. That is not a sample you can build a conclusion on. A rule that fires 11 times in ten years, clustered in one stretch, can look brilliant or useless purely by luck.
There's a second caution. Even a confirmed expansion wouldn't give you direction. The squeeze flags that volatility is low. It says nothing about which way price leaves. Bollinger himself warns about the false first break, which he calls a headfake, and the TTM squeeze breakdown makes the same point about the Keltner-based version: coiled, not pointed.
How often is price actually inside the bands?
You'll often read that 95% of price action stays inside the bands. That figure comes from the normal distribution, where two standard deviations enclose about 95% of values (the NIST engineering statistics handbook shows the normal curve this comes from). Price returns are not normal, and the bands use only 20 observations, so the rule of thumb doesn't carry over.
On our SPY sample, 89.1% of closes landed inside the bands, 6.1% closed above the upper band and 4.9% below the lower. That lines up with the Bollinger rules page, which says that in practice the figure is typically around 90% and not 95%. So a close outside the band happens on roughly one bar in nine, not one in twenty. If you treat a band touch as rare, you'll over-read it.
Using the bands in practice without overclaiming
None of this means the bands are useless. It means each tool answers a narrower question than the usual article implies.
- Percent b tells you where price sits inside the band. Use it as a position read, and check whether the bands themselves widened before calling a divergence.
- Bandwidth tells you how wide the bands are relative to price. Rank it against the instrument's own history instead of comparing it with a number from someone else's chart.
- A squeeze rule tells you the present is quiet relative to the past. Pick one rule, write down the lookback, and keep it fixed while you evaluate it.
A reasonable workflow for a squeeze study: compute bandwidth, rank it over a stated lookback, mark the flagged bars, collapse consecutive flags into episodes, and only then ask what forward range followed each episode versus a matched set of ordinary bars. That's a research design, not a signal. If it sits next to a second filter, ask whether the two actually measure different things. The confluence-or-correlation post goes through why stacked indicators often repeat one reading.
Two neighbouring questions deserve their own pages. Whether the band should be built from standard deviation or from average true range is covered in Keltner Channels vs Bollinger Bands, and the ATR glossary page explains the range-based alternative. The other question is what happens after a band touch, which depends on whether the market is ranging or trending, and the mean reversion glossary entry frames that. We keep both separate here so this page stays about the squeeze rules.
Quantzee builds analytical software for charting platforms, and this article is education about how an indicator behaves, not a recommendation to trade anything. If you want to work through the squeeze rules on your own instruments, do it on paper first. Paper trade before you commit capital to any rule you read in an article, including this one.