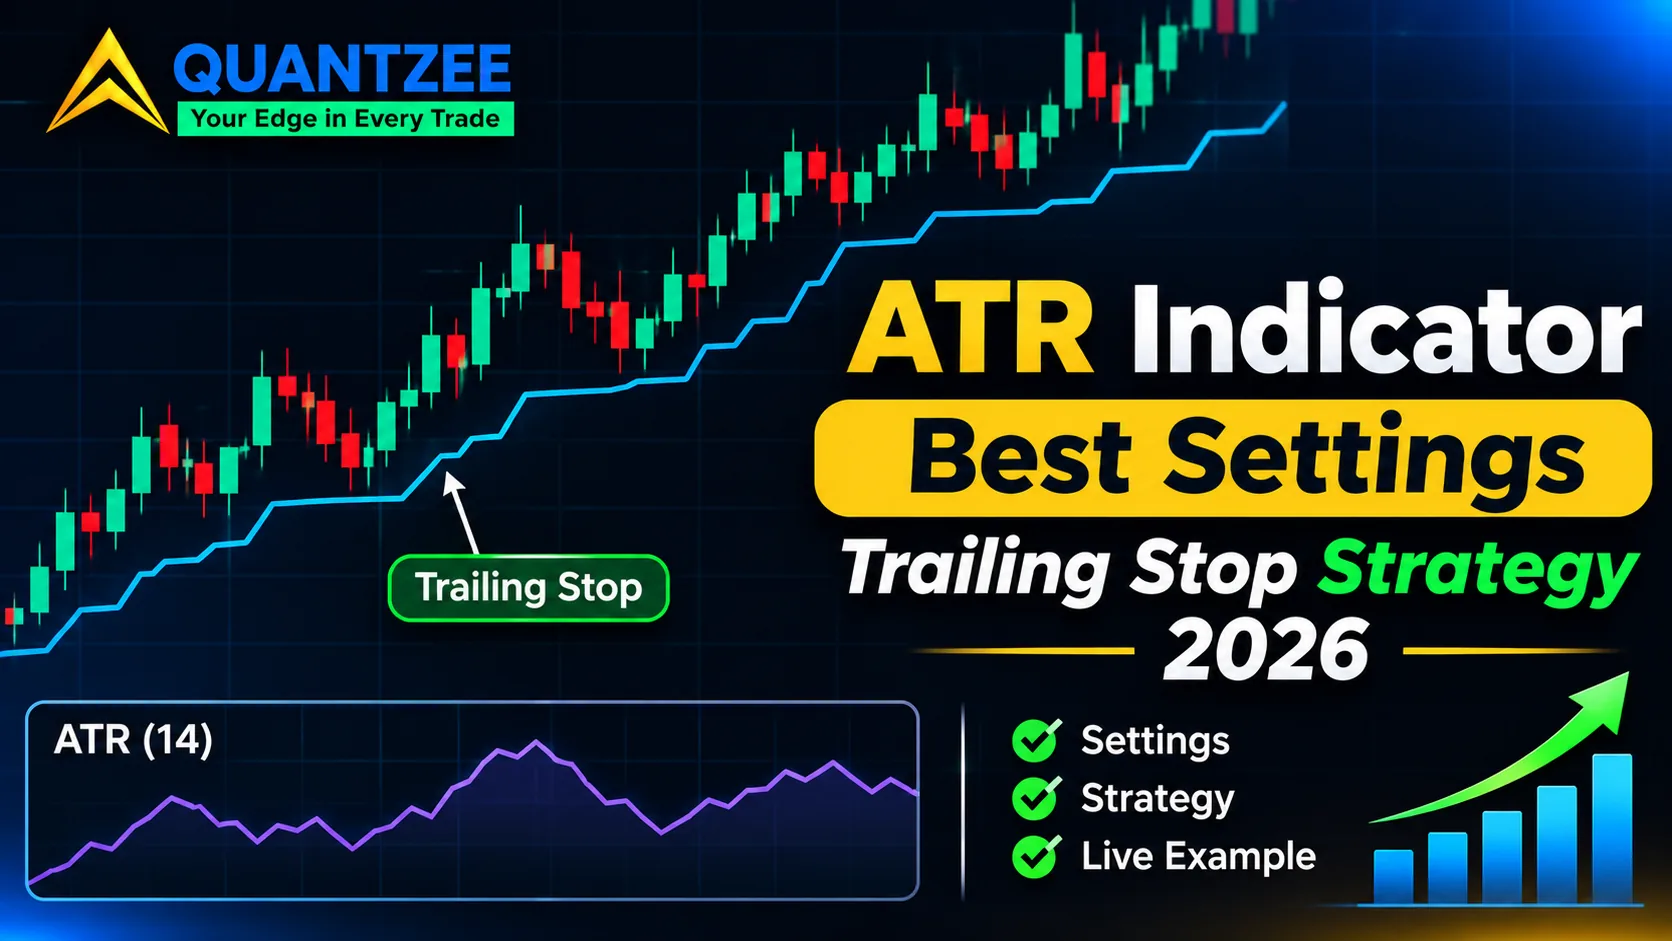
The ATR indicator measures how far an instrument typically travels in one bar, and nothing else. It has no direction and no opinion. That's exactly why it's useful for stops: a stop sized in ATR units adapts to the market's current range instead of a fixed number you picked months ago. This guide covers the two things people actually search for. First, how to set up the ATR indicator on TradingView and what each setting changes. Second, how an ATR trailing stop works, why the usual 3x21 default is a starting point and not an answer, and a procedure for choosing your own multiplier from your own chart.
One thing up front. This post gives you no hit rate and no promised result for any multiplier. The ranking pages for this topic state settings with confidence and no evidence, and we'd rather hand you a method you can run on your own instrument. Quantzee builds analytical software, and nothing here is advice to buy or sell anything.
What the ATR Indicator Actually Measures
ATR stands for Average True Range. J. Welles Wilder introduced it in 1978, and the idea is simple. Each bar has a true range, which is the largest of three distances: the current high minus the current low, the absolute distance from the previous close to the current high, or the absolute distance from the previous close to the current low. The third and second terms exist to capture gaps. A stock that opens 3 points above yesterday's close and trades in a 1-point range still moved 4 points, and plain high-minus-low would miss that.
ATR is then a smoothed average of true range over N bars. The classic N is 14. According to the StockCharts ChartSchool entry on ATR trailing stops, the indicator is built on that same 14-period reading and then multiplied to place a stop. If you want the full definition and the smoothing arithmetic, our ATR glossary entry walks through it step by step.
Two consequences matter for everything below. ATR is expressed in price units, so a reading of 2.0 on a $100 stock and a reading of 2.0 on a $20 stock mean very different things. And because it's an average, it lags. A sudden range expansion takes several bars to show up fully in the number.
How to Set Up the ATR Indicator on TradingView
Open the Indicators menu, search for "Average True Range", and add the built-in one. Two settings in the panel decide almost everything. TradingView documents both in its support pages on how ATR is calculated, so check the current panel against them if the interface changes.
Length (the period)
The default is 14. This is the number of bars in the average. A shorter length such as 7 reacts quickly: after one wide bar the reading jumps and any stop built on it widens fast. A longer length such as 21 or 50 moves slowly. It's steady in a quiet stretch, but after a calm month it takes a long time to widen when volatility returns, so a stop built on it can be too tight exactly when the market wakes up.
Here's a way to feel the difference. Suppose ATR(14) reads 2.00 on a daily chart and a single 8-point bar prints. With a simple 14-bar average the reading moves by (8 − 2) / 14, roughly 0.43, to about 2.43 in one bar. With a 7-bar average the same bar moves it by about 0.86, to roughly 2.86. Same bar, double the response. Which one you want depends on whether you'd rather your stop chase recent volatility or ignore it.
Smoothing (the method)
TradingView's ATR panel lets you choose the smoothing: RMA (the default, Wilder's own method), SMA, EMA or WMA. RMA is slow and smooth. EMA and WMA weight recent bars more, and SMA gives every bar in the window equal weight, which makes the reading drop sharply when a big bar falls out of the window. The differences are small on a quiet chart and noticeable around spikes. If you copy a stop level from a tutorial, check which smoothing it used, because a 3x multiple on an RMA-based ATR and on an EMA-based one won't land on the same price.
Settings people overlook
Check the timeframe too. An ATR on a daily chart is a daily range. If you trade on a 1-hour chart, add the indicator on that chart, not the daily one, so the stop distance matches the bars you're actually reading. And remember that ATR sits in its own pane. It doesn't draw a stop on the price chart. To see the stop itself you need a script that computes it, which is the next section.
The ATR Trailing Stop Strategy, Step by Step
This is where the search demand lives, so it gets a full section. An ATR trailing stop is a stop-loss that follows price at a distance measured in ATR. The mechanics are short enough to state once and exactly.
The calculation
Take the average true range over N bars. Multiply it by a factor, call it M. For a long position, subtract that product from the highest close since entry. For a short, add it to the lowest close since entry. That's the stop level.
The incrediblecharts.com write-up on ATR trailing stops uses the common version: 3 times a 21-day ATR on the closing price basis. That's where the "3x21" default comes from, and StockCharts' ChartSchool entry uses the same family of settings.
The ratchet rule
The stop only ever moves in the trade's favor. For a long it can rise or stay put, and it never drops. Per the incrediblecharts.com explanation, the stop adjusts in the direction of the trend only. Say it unambiguously: if the computed level on a new bar is lower than yesterday's stop, you keep yesterday's stop. If ATR expands and the formula would pull the stop down, the stop holds.
That has a practical consequence for how you update it. If you update on closes only, the stop is fixed all day and changes after the bar completes. If you update intrabar, a new high lifts the stop immediately, but the "highest close" anchor no longer works because the bar hasn't closed. Pick one and keep it. Mixing them quietly changes the exit price more than most people expect.
Why the extreme since entry, not the current bar
Anchor the stop to the highest close since entry, not to the latest close. Compare the two. You buy at 100 and price runs to a high close of 112 with ATR at 2.00 and M at 3. The stop sits at 112 − 6.00 = 106.00. Now price pulls back to a close of 108. A stop anchored to the current bar would be 108 − 6.00 = 102.00, a full 4 points lower, and it would hand back far more of the move before it fired. Anchored to the peak, the stop stays at 106.00 and the trade exits after a pullback of just over 6 points from the high, not 10. The extreme-since-entry anchor is the whole point of a trailing stop. Without it you have a floating stop that keeps retreating.
A worked example (illustrative numbers)
The figures below are made up to show the arithmetic. They aren't results from any market. A long entry at 100.00. ATR(14) is 2.00. M is 3.
- Entry at 100.00: initial stop = 100.00 − 6.00 = 94.00.
- Close at 104.00: stop = 104.00 − 6.00 = 98.00. It moved up.
- Close at 112.00: stop = 106.00.
- Close at 109.00, then ATR widens to 2.50: the formula gives 112.00 − 7.50 = 104.50, lower than 106.00. The ratchet holds the stop at 106.00.
- Close at 105.50: below 106.00, so you're out at the next opportunity, with the high close of 112.00 giving 6.00 points back from the peak.
Round numbers, yes. But notice what happened: the exit cost 6.00 points of give-back, exactly M times ATR, and that's the nature of the tool. The distance from peak to exit is built into the multiplier before the trade starts.
Why 3x21 Is a Default, Not an Answer
LuxAlgo's guide to ATR-based stops says plainly that there's no universal multiplier and that the figure has to be tested. We agree, and that guide stops short of saying how to test it. A multiplier trades between two costs.
The first cost is premature exits. A small M puts the stop inside the ordinary range of a healthy trend, so a normal pullback knocks you out and the trend continues without you. The second is give-back, the distance from the peak to your exit. A large M survives pullbacks but returns a big slice of the profit before it fires. You don't get to remove either cost. You choose where to sit between them.
A flat 3x21 treats a calm index and a hyperactive small cap as the same animal. They aren't. Two instruments can share an ATR of 2.0 and have completely different pullback behavior inside their trends.
A procedure for choosing the multiplier from data
Instead of folklore, measure the pullbacks inside trends on your own instrument and timeframe. It takes an afternoon.
- Pick the instrument and the timeframe you actually trade, and a stretch of history that includes several clear trends. Mark each trend you'd have wanted to hold.
- Inside each trend, record every pullback: the distance from a swing high close down to the lowest close before the trend resumed. Convert each into multiples of the ATR at that time. A 5-point pullback with ATR at 2.0 is 2.5 ATR.
- List the numbers and sort them. You now have a distribution of how deep ordinary pullbacks go, in your instrument's own units.
- Set the multiplier above the depth you're willing to treat as normal. If 80% of the pullbacks are under 3.2 ATR, a multiplier of 3.0 will stop you out on about one pullback in five. A multiplier of 3.5 would let nearly all of them pass.
- Then check the cost side: for each trend, note how far the peak sat above your exit under that multiplier. That's your give-back for the setting.
A hypothetical set of ten pullbacks, in ATR multiples: 1.2, 1.8, 2.1, 2.4, 2.6, 3.0, 3.1, 3.4, 4.2 and 5.0. These numbers are invented to show the step, not measured from anything. The median is 2.8. The 70th percentile is about 3.1. A multiplier of 3.0 lets six of the ten pass and stops you on four. Move to 3.5 and eight of ten pass, but each exit then gives back 0.5 ATR more from the peak. That one table is the entire trade-off in numbers, and it's yours to rebuild with real data.
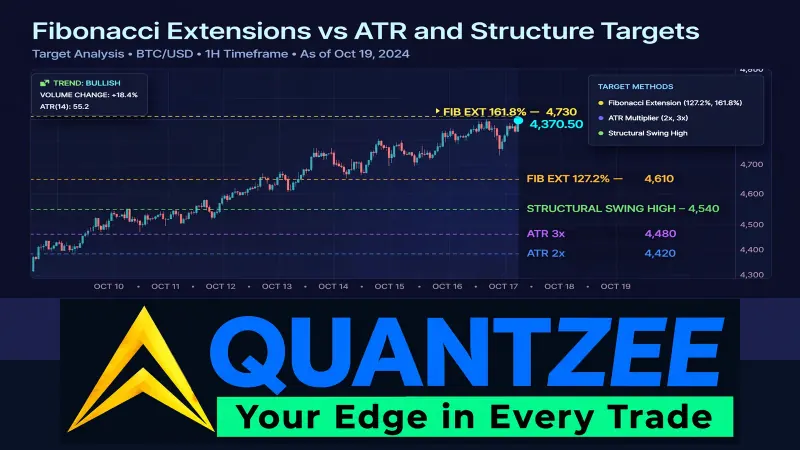
Our methodology for comparing exit rules is the same idea at a bigger scale. In our own exit-method comparison, Fibonacci extensions against ATR multiples and structure targets, we compared hit rate, captured move and give-back on identical entries, and the lesson carried over here: no rule wins everywhere, and give-back has to be measured as its own number. That page covers profit targets rather than trailing stops, so use it for the framing and run the pullback procedure above for the stop itself.
Period Choice: Short ATR Versus Long ATR
The period feeds the stop as much as the multiplier does. With a short ATR such as 7 or 10 the stop chases recent volatility. It tightens quickly in a quiet patch, which sounds good until a compressed range makes the stop so close that ordinary noise hits it. It widens quickly after a spike too, which gives the market more room right after a surprise.
A long ATR such as 21 or 50 is slow to widen. After a quiet stretch of 30 bars, a long ATR may still read low when a volatile phase begins, and the stop sits closer than the market's new behavior justifies. The usual middle path is 14 to 21. If your pullback table shows a lot of variation from trend to trend, a longer period at least keeps the stop from lurching.
ATR also sizes things other than stops. Renko charts can use it as the brick size itself, with a different set of trade-offs; our Renko brick size guide walks through the ATR-multiple version.
Close-Only Versus Wick-Triggered Stops
This choice changes your exit price more than the multiplier does on volatile instruments. A close-only stop fires when a bar closes beyond the level. A wick-triggered stop fires the instant price touches it. On a volatile instrument a bar can wick through the stop by 2 or 3 points and close back above it. A close-only rule keeps you in that trade. A wick rule kicks you out, and if the stop is a resting order you also pay slippage on the fill.
The close-only rule has its own problem: when a bar does close below the stop, it often closes well below it, so you exit at a worse price than the level you drew. Picture the stop at 106.00 and the bar closing at 103.50. You gave up 2.50 more than planned. Neither version is right. Choose one deliberately, run your pullback table the same way (close-to-close or high-to-low), and don't compare someone's close-only multiplier to your wick-triggered one.
Where the ATR Trailing Stop Is the Wrong Tool
It's a trend-following exit. Used outside a trend it does damage.
- Ranges. Price oscillates, the high-water mark keeps resetting, and the stop gets hit on the way back down, repeatedly. You pay for each entry.
- Gap-prone instruments. A stock that gaps 5% on earnings jumps right over the stop. The stop level was 106.00 and the next open is 99.00, so ATR sizing didn't protect you from the gap; it only defined where you'd have wanted out.
- Plans with range-based targets. If your profit target is 2x ATR from entry, a trailing stop at 3x ATR below the peak is asking for two different definitions of "enough" in the same trade. Decide whether the trade is a capped target or a ride.
Whichever rule you use, it sits inside a larger plan. Our stop-loss glossary entry covers the general idea, and the stop distance directly sets how many units you can carry, so read position sizing next. A wider ATR stop means a smaller position for the same dollar risk.
ATR Trailing Stop vs SuperTrend vs Chandelier Exit
You may be tempted to shop for a different indicator when the stop disappoints. Most of the candidates are the same machine with a different anchor.
The chandelier exit is the one the ATR trailing stop is closest to. It hangs a multiple of ATR below the highest high since entry (the ATR trailing stop above uses the highest close). SuperTrend also uses ATR times a multiplier, but anchors it to the midpoint of the bar's high and low and flips between a support line and a resistance line, so it works as an entry and exit signal in one. Our SuperTrend settings guide covers its default of period 10 and multiplier 3.0, and the SuperTrend Pro indicator page shows how we package it.
The practical rule: all three have a period, a multiplier and an anchor. The pullback-depth method above works for every one of them. Swapping indicators changes the anchor and leaves the trade-off exactly where it was.
Test Before You Trust Any Setting
Paper trade a stop rule before it touches live capital, and keep the pullback table so you can see when the instrument's behavior changes. The U.S. Securities and Exchange Commission's investor education site makes the same point about technical analysis tools in general: they describe past price behavior and don't promise future results. The CMT Association, the body that certifies technical analysts, also treats exits and risk rules as their own discipline, separate from entry signals. Treat any multiplier, including the ones in this guide, as a hypothesis until you've measured it on your own chart.
If you'd rather run this on a watchlist than by hand, the ATR glossary page is the place to start, and the Quantzee toolkit is built for exactly this kind of systematic testing.
References: StockCharts ChartSchool, ATR Trailing Stops; IncredibleCharts, ATR trailing stops; LuxAlgo, ATR for volatility-based stop losses; TradingView support, ATR; SEC Investor.gov glossary; CMT Association.