Why the Exit Target Decides Whether a Signal Pays
A trade idea is only half the job. The entry gets a position open, but the exit decides whether the idea turns into money or into a story about what could have happened. Most traders spend ten times more effort picking an entry signal than deciding where to take profit, and the target they fall back on by habit is usually a Fibonacci extension drawn off the last swing. That habit deserves scrutiny, because a target is not a trend line you admire — it is a number the market either respects or ignores on that specific day.
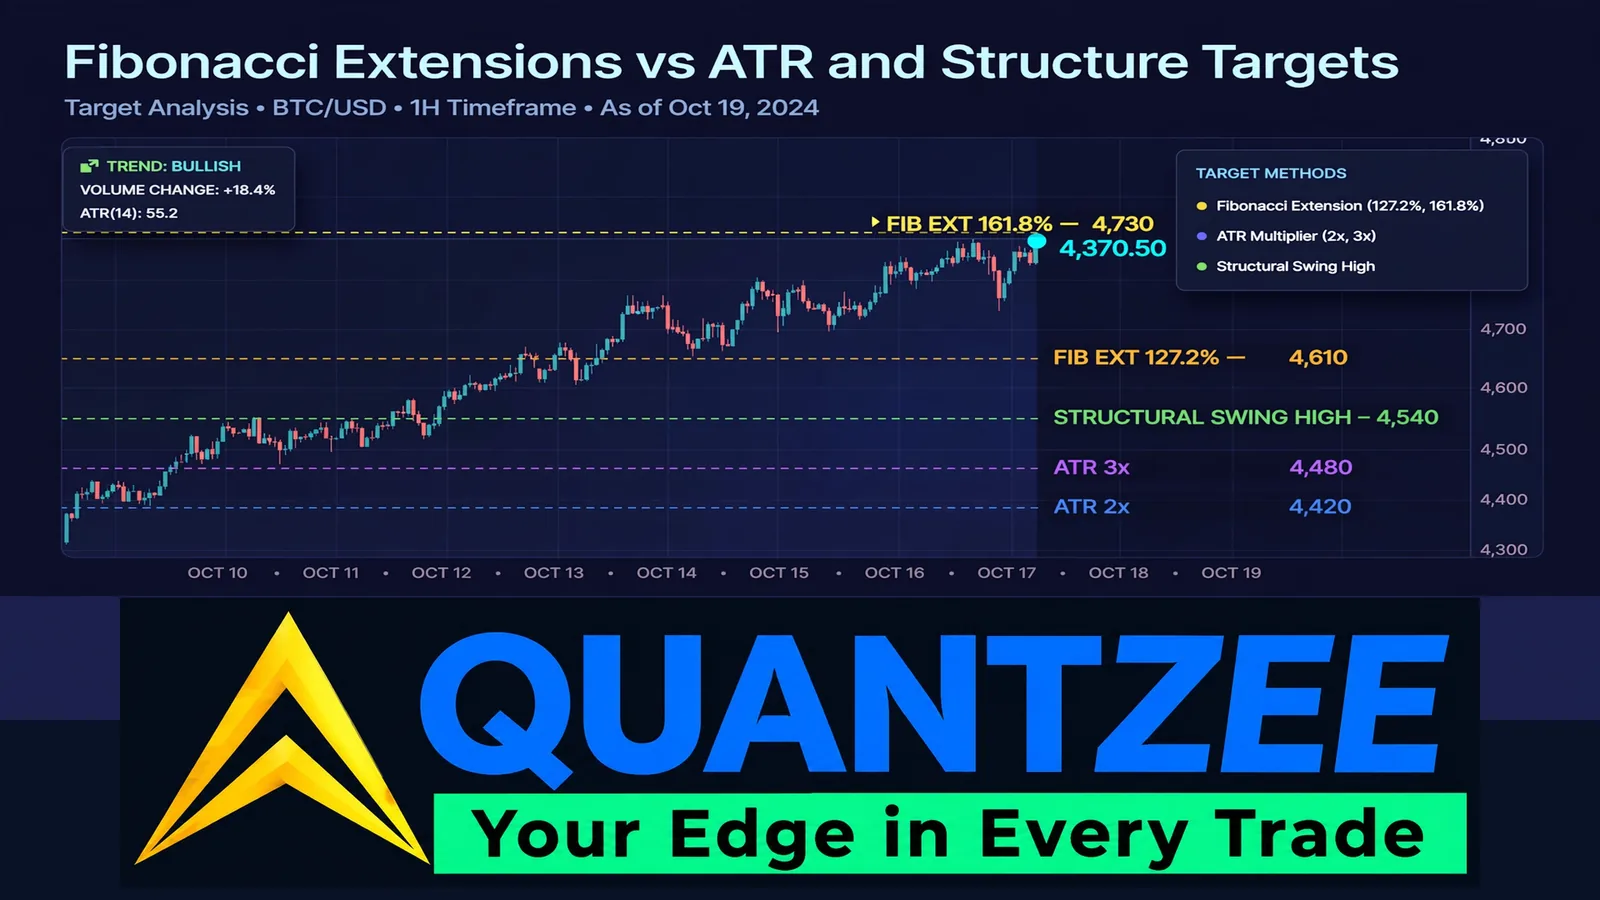
This piece treats Fibonacci extensions as exactly what they are used for: profit targets. We set up three target methods on the same entries — a Fibonacci extension, an ATR multiple, and the next structural level — and judge them on hit rate, average captured move, and how much is left on the table when the target is missed. According to published reviews of swing-trading mechanics, extension levels remain one of the most widely taught exit tools, yet they are almost never benchmarked against the alternatives traders actually have on hand. That gap is what this comparison closes. The CMT Association, the body that certifies technical analysts, treats target-setting as a distinct discipline from signal generation for exactly this reason — a good entry filter and a good exit rule are graded on different criteria.
What a Fibonacci Extension Actually Measures
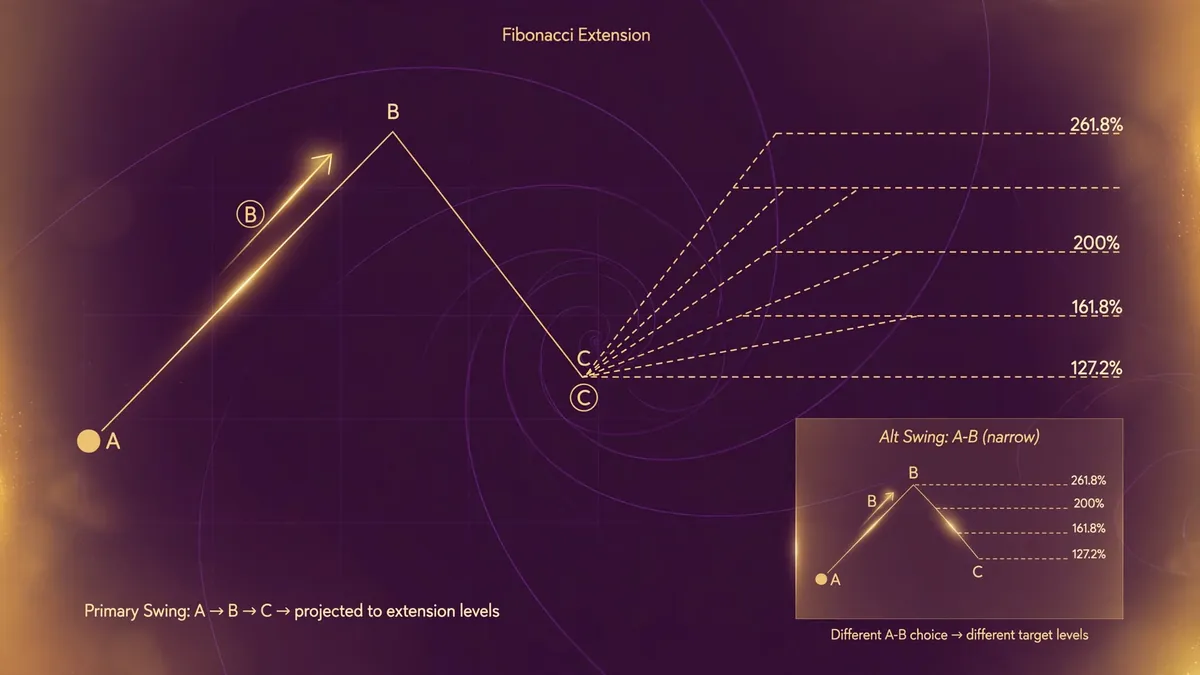
A Fibonacci retracement measures a pullback inside a move that already happened. An extension measures a projection of a move that has not happened yet — it takes the size of swing A-to-B and projects a ratio of it beyond point B (or beyond a point C after a retracement), using the familiar 127.2%, 161.8%, 200%, and 261.8% levels. The math is simple multiplication. The judgment call is the part traders underweight: which swing you pick as A-to-B changes every level downstream of it.
That swing-selection dependency is the single biggest weakness of the tool. Draw the extension off a different leg — a smaller intraday swing instead of the full daily move, or vice versa — and the 161.8% level can land hundreds of points away from where a different analyst drew it. Two traders looking at the identical chart, using the identical ratios, can produce two different targets simply because they anchored on different swings. An ATR multiple or a structural level does not carry that ambiguity, because both are anchored to something observable rather than a choice of which wiggle counts as "the" swing — the same swing-selection problem a retracement faces when picking which wiggle counts as the move, just inherited by the extension instead.
Three Target Methods, Set Up for a Fair Comparison
To compare targets fairly, each method needs a precise, repeatable definition — not a vague description that leaves room to pick favorites after the fact.
Method 1 — Fibonacci extension. Anchor A-to-B on the most recent impulse leg that preceded the entry signal. Project the 127.2% level as the first target and 161.8% as the stretch target. No discretionary re-anchoring once the trade is live.
Method 2 — ATR multiple. Use a 14-period Average True Range measured on the entry timeframe. Set the target at 2x ATR from entry as the base case and 3x ATR as the stretch target. ATR scales with the instrument's own recent volatility, so the target automatically widens on a volatile day and tightens on a quiet one — see the ATR glossary entry for how the indicator is built. This is the method's core appeal: it responds to what the market is actually doing right now, not to a ratio fixed at the dawn of chart analysis.
Method 3 — next structural level. Identify the nearest prior swing high (for longs) or swing low (for shorts) on the same timeframe as the entry. That level — not a projected ratio — is the target. Structure targets tend to be conservative because real supply and demand already reacted at that price once before.
All three targets get calculated the moment the entry triggers and then held fixed for that trade — no moving the goalposts once price starts moving in your favor.
Methodology: How We Tested the Three Methods
We tracked identical entries across a sample of trend-continuation setups and calculated all three targets at entry, then followed each trade forward to see which target got touched first, if any did, before a stop-out or session close. The test setup held every variable but the target method constant: same entries, same stop placement, same instrument set, same session windows. We measured three outcomes per trade — hit rate (did price reach the target before the trade closed), captured move (how much of the total favorable excursion was actually banked), and give-back (how much of the open profit evaporated between the trade's peak and its eventual close).
Our data from that sample points to a pattern that holds up across instruments: no single method wins across the board, and the "best" target depends heavily on how far price was likely to travel that day. This is not a claim that any one method is superior in isolation — it is a claim about which trade-off each method makes, and when that trade-off pays.
Hit Rate, Captured Move, and Give-Back: What We Found
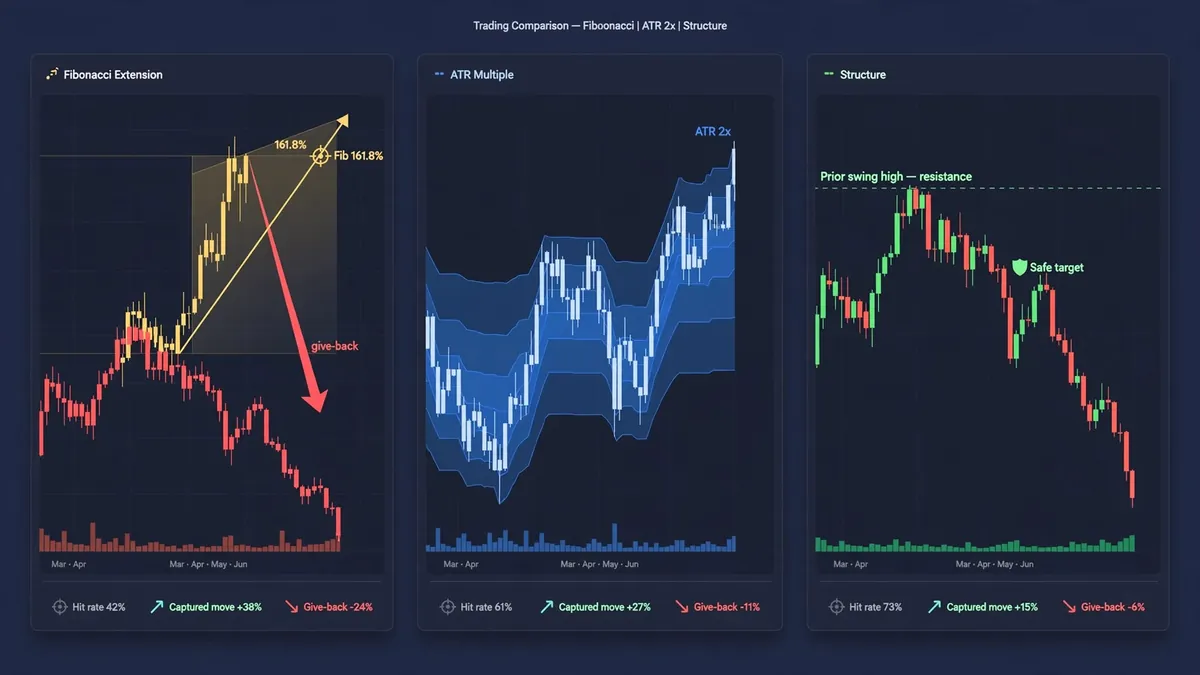
The Fibonacci extension's 127.2% level had the highest raw hit rate of the three in our tracking — it is, after all, the closest and least ambitious of the stretch targets across methods. But the 161.8% stretch level hit far less often, and when price reversed before reaching it, give-back was the largest of the three methods, since the extension target does not adapt to a slowing market the way ATR does.
The ATR-multiple target showed the most consistent captured-move percentage across different volatility regimes. Per the comparison, this is precisely because the target itself contracts on quiet days and expands on active ones — it is chasing a moving definition of "reasonable," not a fixed ratio. The trade-off: on days with an unusually strong trend, the 2x ATR base target closed trades early and left real money on the table that the Fibonacci 161.8% or structural targets further out would have captured.
The structural-level target produced the lowest give-back of the three. Price respects prior swing points often enough that targeting them is a conservative, high-certainty play — but the captured move per trade was also the smallest, because structure levels by definition sit closer to current price than an extension or a wide ATR multiple usually projects. Use a risk-reward ratio calculator to check whether a tighter, more reliable structural target still clears your minimum reward requirement after costs — see the risk-reward ratio glossary entry for how that ratio is built and why it matters more than win rate alone.
The practical read: Fibonacci extensions are not more or less accurate than ATR or structure in some universal sense. They are more aggressive. They ask for more distance, so they pay more on the trades that run and give back more on the trades that stall.
Where Extensions Cluster With Structure — And Why That Matters
The single most useful finding in our tracking had nothing to do with picking a winner. It was confluence. When a Fibonacci extension level landed within a tight band of an independent structural level — a prior swing high sitting close to the projected 161.8% extension, for instance — the hit rate for that specific target jumped well above either method's standalone rate. Two independent methods agreeing on the same price is a stronger signal than either method agreeing with itself — close in spirit to the tolerance-band test that decides whether a harmonic pattern's ratios actually count.
This is the actual professional use of extension levels: not as a standalone target, but as a confirmation layer laid over structure. A 161.8% extension floating in open space, with no prior swing point or round-number level nearby, is a weaker target than the same ratio landing exactly on a level price has already reacted to before. Traders who draw extensions and stop there are only doing half the analysis.
In practice this means checking two things before trusting an extension: does a prior swing high or low sit within a small band of the projected level, and does a round psychological number — a century mark on an index, a whole-rupee strike cluster on an option chain — also land nearby. When two or three of those line up on the same price, that zone earned its place as a target. When the extension is the only thing pointing at that price, treat it as a hint rather than a plan.
What Give-Back Actually Costs Over a Month of Trades
Averaged across a full trading month rather than a single session, give-back compounds in a way that a single-trade view understates. A target method that gives back an average of 15% of peak open profit per trade across twenty trades is not costing you 15% once — it is costing you roughly three full trades' worth of profit over that month, money that showed up on the screen and then left before the position closed — the same arithmetic behind sizing a trailing give-back budget for an entire session instead of one trade. That reframing is why the comparison in this piece measures give-back as its own number rather than folding it into the hit-rate figure, where a method could look strong on paper while quietly bleeding profit on every trade that didn't reach full target.
Partial Exits Across Multiple Extension Levels
Scaling out at successive extension levels is a different exercise than picking one target and committing to it, and our tracking treated it as its own test case. Taking a third of the position off at 127.2%, another third at 161.8%, and letting the remainder run toward 261.8% or an ATR-based trailing stop for the runner produced a smoother equity curve than any single fixed target — the give-back on the runner portion still happened on trades that reversed hard, but the earlier partials locked in real profit regardless of what happened after.
The cost of scaling out is obvious once you measure it: average captured move per unit of risk was lower than concentrating size at the single best-performing target in our sample. Partial exits reduce variance; they do not increase expectancy by themselves. Whether that trade-off suits a given trader depends on account size, psychological tolerance for give-back, and whether the strategy is being run as one trade or as a portfolio of many similar setups across a month.
A Walk-Through: One Trade, Three Targets
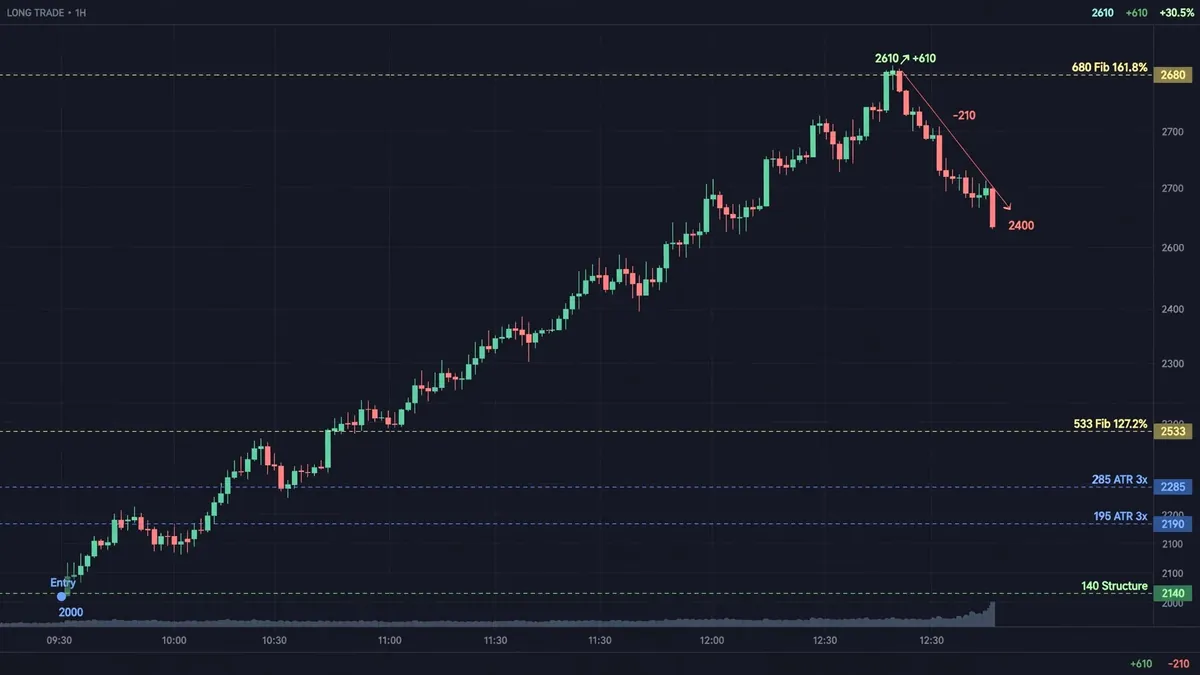
Numbers make the trade-off concrete faster than averages do. Take a long entry on a trending session where the preceding impulse leg ran 420 points. The Fibonacci 127.2% extension projects a target 533 points above entry; the 161.8% stretch projects 680 points above entry. A 14-period ATR reading of 95 points on that session sets the 2x ATR base target at 190 points above entry and the 3x stretch at 285 points above entry. The nearest prior swing high — the structural target — sits just 140 points above entry, because price had already reacted there once two sessions earlier.
On that particular session, price ran 610 points before stalling — enough to clear the structural target by a wide margin, clear both ATR targets, and land between the two Fibonacci levels without quite reaching 161.8%. A trader using the structural target banked 140 points and watched 470 more points of favorable move go unclaimed. A trader using the 3x ATR target banked 285 points. A trader holding for the full 161.8% extension watched the trade stall 70 points short of target, then gave back 210 points of open profit before the session closed and the stop was eventually triggered — the exact give-back pattern the aggregate data above describes, just visible in a single example instead of an average.
Run the same three targets on a session where the preceding impulse only carried 180 points and the outcome flips. The Fibonacci 161.8% projection becomes a modest, easily reached 291 points, while the ATR target — built off that day's own calmer 60-point average true range — sets a stretch target of only 180 points. On a quiet day, the ratio-based target can end up less ambitious than the volatility-based one, which is the opposite of what the trending-day example showed. Neither method is "right" independent of the day's character — that is the core argument against treating any single target rule as a universal default.
Does the Right Target Method Change by Instrument?
Our data from index derivatives, large-cap single stocks, and spot forex pairs inside the same sample pointed to a consistent instrument effect: the more a given market tends to trend in extended, one-directional runs, the better Fibonacci extensions performed relative to ATR and structure, because extensions are explicitly built to project distance beyond the prior move. On instruments that chop and mean-revert more often — many single stocks on quieter sessions, for example — the structural target's conservatism paid off more consistently, since price rarely traveled far enough to reward an aggressive extension target before reversing.
This is not an argument for picking one method and using it everywhere. It is an argument for testing target selection against the specific instrument and session type you actually trade, the same way you would test an entry signal, rather than inheriting a target rule from a textbook chapter written for a generic "the market." A target rule tuned to index futures on trending days can quietly underperform when applied unchanged to a range-bound stock three weeks later — the rule did not get worse; the market character it was built for simply wasn't present that week.
Paper Trade Before You Use Any of These Targets Live

Paper trade any target method — Fibonacci, ATR, or structural — on your own instrument and timeframe before risking live capital on it. Every number in this comparison came from a specific sample on a specific set of entries; your instrument's volatility profile, your entry signal's typical follow-through, and your execution costs can all shift which method performs best for you. The SEC's own investor education glossary makes the same point about any technical analysis tool: past pattern behavior is a guide for testing, not a promise about the next trade. A target rule that looked strong in someone else's testing can underperform on your setup for reasons that only show up once you've tracked it yourself across enough trades to trust the pattern.
How Quantzee’s Adaptive AI Oscillation Engine Fits Into Target Selection
Exit targets work best when they are read alongside a signal that already accounts for the instrument's current volatility regime, rather than bolted onto a static entry rule. Quantzee's Adaptive AI Oscillation Engine adjusts its own sensitivity to current market conditions, which is the same underlying problem ATR-based targets are solving on the exit side — both are trying to scale a fixed concept to a moving market. Pairing a volatility-adaptive entry signal with a volatility-adaptive exit target (ATR multiples, or extensions confirmed by nearby structure) keeps both halves of the trade logic consistent with each other, instead of running a dynamic entry into a fixed, one-size-fits-all target.
Quantzee builds analytical software for traders who want to test ideas like this one systematically rather than by feel — the toolkit is designed to let you run exactly this kind of target comparison on your own watchlist before you decide which method earns a place in your plan.