Search for the bollinger band rsi pairing and nearly every page makes the same pitch: a band touch plus an oversold reading is "double confirmation", so the signal must be better. Nobody asks the dull question first. How often are both conditions true at the same time? On the one published test that discloses its numbers, the strict version of the rule fired 14 times in three years on a single currency pair. That is fewer than five trades a year. Before you judge how accurate the pairing is, you need to know how rarely it speaks.
This post covers the exact rule, the frequency finding and where it comes from, why a handful of trades a year proves nothing, what happens when you loosen the rule to get more trades, and a ten-minute way to count the signals on your own chart. It is analytical software education, not advice, and the third-party numbers below are quoted as that publisher's results. We have not reproduced them.
What each indicator measures, and why they are not independent
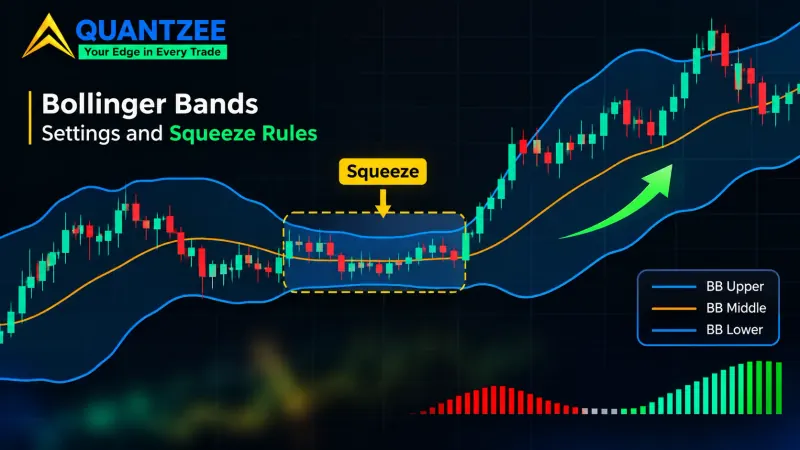
Bollinger Bands put a 20-period simple moving average of the close in the middle and draw one rail above and one below, each sitting a set number of standard deviations away. The default is 2. Wide bands mean recent closes have been scattered. Narrow bands mean they have been tight. So the bands are a volatility reading wrapped around a trend line. If you want the full construction, our Bollinger Bands glossary entry walks through it, and the Wikipedia article on Bollinger Bands gives the standard formulas.
The RSI is a momentum reading. It compares the average size of recent up-closes with the average size of recent down-closes over a lookback, 14 bars by default, and squeezes the ratio into a 0 to 100 scale. Readings under 30 are conventionally called oversold and readings over 70 overbought. The RSI reference page covers the maths, and the investor-education glossary at Investor.gov is a fair neutral definition of technical analysis itself.
Here is the catch most guides skip. Both indicators are computed from the same series of closing prices. When price drops hard for several bars, the close slides toward the lower band and the RSI slides toward 30 because they are reading the same drop through different arithmetic. Agreement between them is partly mechanical. It is not two independent witnesses. We made the same argument for oscillators in Confluence or Correlation? Why Three Indicators Often Say One Thing, and the logic carries over here. What the pairing does add is a little: the band is relative to recent volatility, while the RSI is relative to recent direction, so the two can disagree. That disagreement is the whole reason to pair them, and it is also why the joint condition is rare.
The canonical rule, stated exactly
A vague rule cannot be counted. So write it down with every parameter named. The version most guides describe, long side first:
- Bollinger Bands on the close, 20 periods, 2 standard deviations.
- RSI on the close, 14 periods, oversold level at 30.
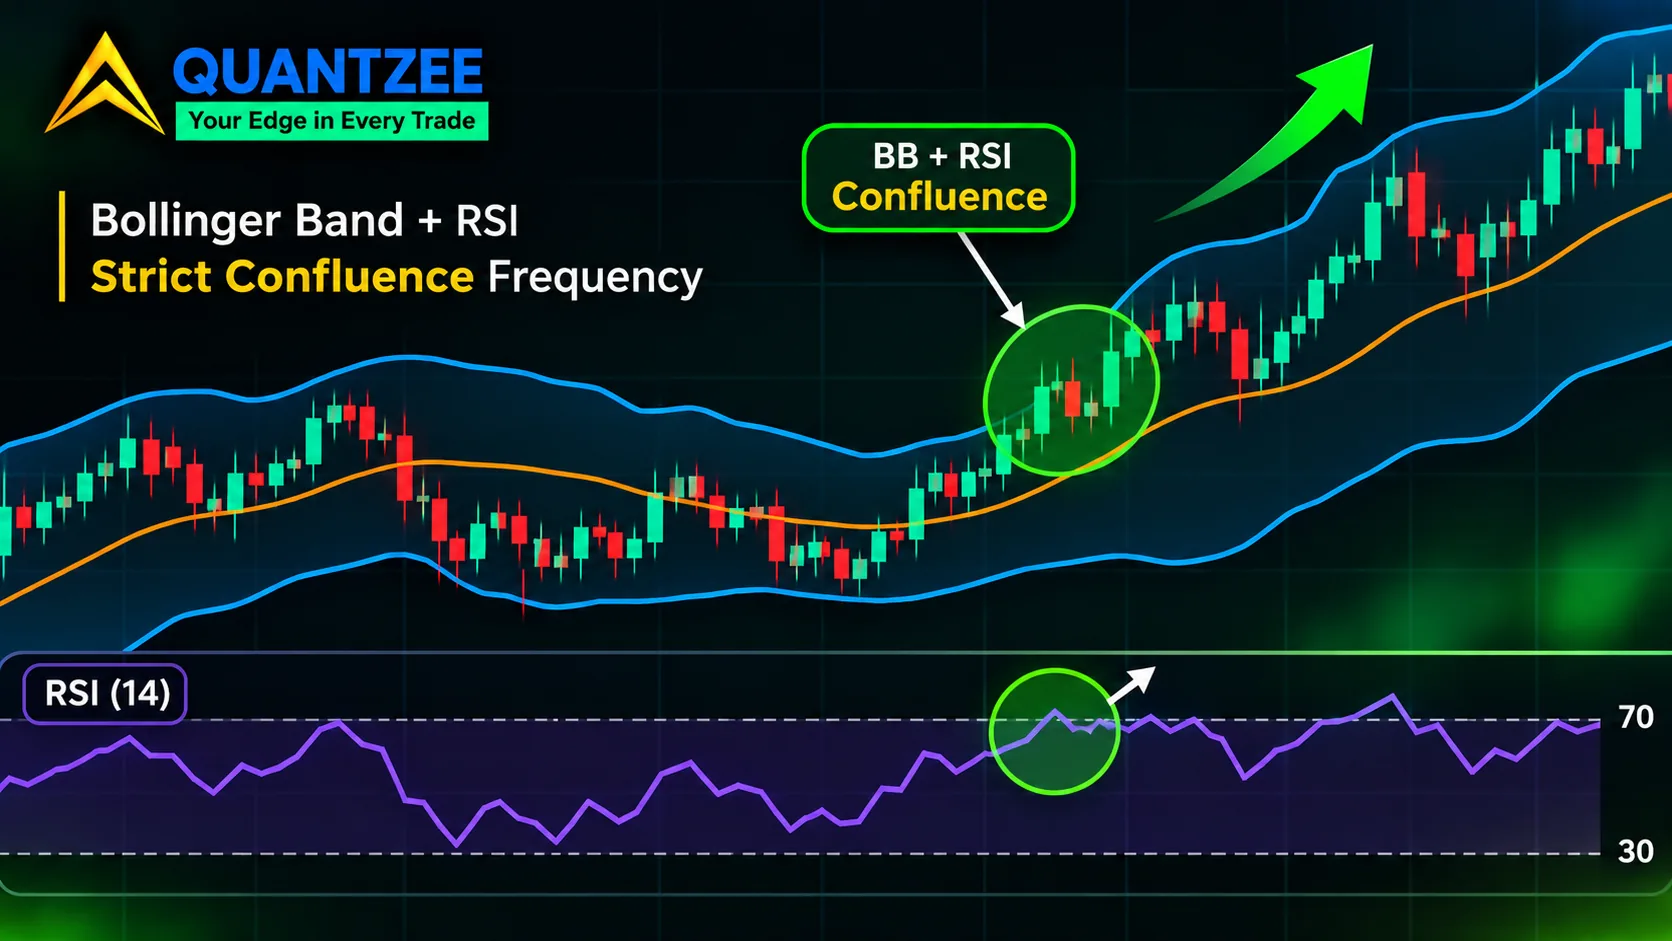
- Trigger: a bar closes back above the lower band after trading below it, and the RSI is under 30 at the same moment.
The short side mirrors it: a close back below the upper band with the RSI over 70. Notice what we chose in that wording. The trigger is a close back inside the band, not a touch. The RSI condition is checked on the same bar, not "recently". Each of those choices changes how often the rule fires, and we come back to them in the loosening section.
The published test we rely on used slightly different numbers, and that matters for honest comparison. Per the MQL5 article "Bollinger Bands and RSI Ensemble Strategy Discovery", its code defines a 30-period band with 2 standard deviations, a 15-period RSI with levels at 70 and 30, an ATR of 14 with a 2x multiple for stops, and reads the indicators on the daily timeframe while trading on the 4-hour timeframe. The symbol is EURUSD and the window runs from January 2023 to January 2026. So the "strict" rule there is not the textbook 20/14 version. If you copy its frequency onto a 20/14 setup, you are comparing different rules.
The frequency finding: 14 trades in three years
Here is the result, with everything attached so you can judge how far it travels. In that MQL5 write-up, on EURUSD, with indicators on the daily chart and trading on the 4-hour chart, over January 2023 to January 2026, the baseline both-conditions rule placed 14 trades. The author reports 64% of them were profitable. The author's own comment on the count is blunt: fewer than five trades a year, which they call "dismal and unacceptable on any level".
The same article then relaxes the rules over several iterations to find more signals. The second version raised the count from 14 to 29 trades, but net profit fell from $61 to $35 on the publisher's small test account. A later iteration reached 78 trades with a 55% win rate and $95 net profit, and the fifth reached 83 trades with 48% profitable. So in this one test the count rose from 14 to 83 as the rules were loosened, and the win rate fell from 64% to 48% along the way.
Three limits on that evidence, because it is easy to over-read. It is one currency pair. It is one three-year window with no separate out-of-sample period. And later iterations were tuned on the same data, which the write-up itself shows. We publish no win rate of our own for this pairing, and nothing here tells you what the rule does on stocks, crypto or indices. What it does tell you is that a team who built the strict version and wanted trades found it starved them. That is a finding about frequency, and frequency is the part every other page on this topic leaves out.
Why a handful of trades a year is a problem, not a virtue
It is tempting to read "rarely fires" as "highly selective", and selective sounds good. It stops sounding good once you try to learn anything from the trades.
Take the baseline numbers at face value. A 64% win rate on 14 trades is 9 wins and 5 losses. Run the standard confidence interval on that (our own arithmetic, a Wilson 95% interval) and the true win rate could plausibly sit anywhere from about 39% to 84%. A rule that wins 39% of the time and one that wins 84% of the time would both be consistent with what was observed. Add a payoff ratio into the mix and you cannot even say whether the edge is positive.
Now stretch the same logic. At five signals a year you need roughly 6 years to collect 30 trades, which is the usual bare minimum people quote before looking at averages. By then the market regime has changed twice. And any single bad stretch dominates: two losers in a row is 14% of a 14-trade sample.
So low frequency fails in two ways. You cannot establish whether the rule works, and you cannot get the experience of trading it, because you will sit in cash through most of the year and be tempted to override it the first time a near-miss looks good. Sample size is the first thing that breaks in a confluence rule, long before accuracy does.
The loosening dilemma
If the strict rule fires too rarely, the obvious move is to relax it. Every relaxation adds trades. Every relaxation also weakens the confirmation the pairing was supposed to provide. The usual levers, and what each costs you:
- Touch instead of close-back-inside. Triggering when price merely pokes through the band fires far more often, but you now enter into falling knives, because a poke through the lower band is exactly what a trend does.
- Wider RSI threshold. Moving oversold from 30 to 35 or 40 admits many more bars. At 40 the RSI is barely below neutral in a mild pullback, so the "confirmation" is close to a coin flip.
- Narrower band multiplier. Dropping from 2 deviations to 1.5 puts the rails closer to price, so more closes poke out of them. Roughly speaking you trade a rarely-hit rail for a routinely-hit one.
- A tolerance window between the two conditions. Instead of both on one bar, allow the RSI condition within N bars of the band event. This is the least discussed lever and the most powerful, so it gets its own section next.
The honest summary: you cannot add frequency for free. The 14-to-83 climb in the MQL5 test came with a falling win rate and, per the author, a need for more iterations to recover profitability. That is the shape of the trade-off even if your instrument produces different numbers.
The most under-specified parameter: the tolerance window
Read five guides on this pairing and ask each one a single question: must the two conditions be true on the same bar, or within some number of bars? Most do not say. Yet this one setting can move the signal count by a large multiple.
Think about the timing. The RSI usually reaches its lowest reading a bar or two before price closes back inside the lower band, because momentum turns before price does. On a strict same-bar rule, the RSI has often already climbed back above 30 by the time the band trigger fires, so the rule never sees both at once. Allow a window of 3 bars and many of those near-misses count. Allow 10 and you are accepting an RSI dip from two weeks earlier as "confirming" a band event today.
There is no correct window. What matters is that you pick one on purpose, write it down, and test it as part of the rule, not as an afterthought. A reasonable way to read any published result for this pairing is to ask which window it used, and to treat a result that does not say as unreplicable.
What happens in a strong trend
This is a mean-reversion rule. It bets that a close beyond the band with a stretched RSI will snap back toward the middle line. That bet holds up in a ranging market and breaks in a trending one.
In a strong downtrend, price can "walk" the lower band for many bars, closing at or just outside it again and again. The RSI sits in the 20s and stays there. Each re-entry on a close back inside the band looks like a valid signal, and each one loses as the trend resumes. You get a cluster of losses in one direction, from a rule that was built to be selective. The pinning behaviour of oscillators at extremes is covered in more depth in our post on Stochastic RSI pinning at extremes, and the same mechanism applies to the plain RSI.
The cluster is the reason a 64% win rate can coexist with a poor equity curve. A rule that wins nine small ones and loses five big ones in a trend leg can still be net negative. This is also why the MQL5 author added an ATR-based stop. Without a way to exit when the walk begins, the rule's losses are open-ended.
What the pairing is genuinely good for
None of this means the combination is useless. It means it is the wrong tool for the job most guides give it, which is a stand-alone entry.
Used as a context filter inside a plan whose entry trigger is something else, it earns its place. Say your entry comes from a price-structure signal or a divergence setup, and you only want to take it when price is also stretched against its recent range. A close outside the band with a low RSI is a cheap, objective way to say "this is stretched". The filter then does not need to fire five times a year, because it is not the thing deciding when you trade. It is vetoing the trades you would have taken in the middle of the range.
Treated that way the frequency problem mostly disappears, since your trigger supplies the volume. What you give up is the clean story of a single rule you can backtest end to end. You are now testing the filter's marginal contribution, and that is its own piece of work. The related idea of using an RSI divergence as a confirmation layer is in our RSI settings and divergence guide, and the oscillator side of the Quantzee toolkit is described on the Adaptive AI Oscillation Engine page.
How to count the signals on your own instrument
This is the part that turns a marketing claim into a check you can finish in about ten minutes. You are measuring frequency, not quality. Do not look at profit yet.
- Pick one instrument and one timeframe. The one you actually trade. Frequency on a 5-minute chart and on a daily chart are different questions.
- Add both indicators with your exact parameters. Bollinger Bands on the close with your period and multiplier, plus the RSI with your length and levels. Write the six numbers down before you look at the chart.
- Set the history window. Scroll back to a fixed span, for example 3 years on a daily chart or 12 months on an hourly chart. Fix the span before you count so you do not stop when the number looks nice.
- Mark every qualifying bar. A qualifying bar is one where the band event happened and the RSI condition held on the same bar. Count them with a note or a drawn marker. Do this for the strict same-bar rule first.
- Repeat with a window. Now allow the RSI condition within 3 bars of the band event, count again, then try 5. You now have three numbers for the same chart: strict, 3-bar, 5-bar.
- Divide by years. Signals per year is the number to compare with the published 14 in three years.
If you want the tester route instead of marking by eye, our guide to backtesting a TradingView indicator shows how to run a rule through the Strategy Tester and read the trade count straight off the results. One caution before you trust any script that claims to automate this pairing: check it does not repaint. A script that redraws past signals will show you a frequency that never existed in real time, and the repainting test takes a few minutes. Across a sample of 3 or more instruments you will probably see the same thing: the strict rule is sparse, the window is what moves the count, and the answer differs a lot by timeframe.
Only after you have the frequency should you ask the quality questions. If the strict rule gives you four signals a year on your chart, you already know it cannot be your main strategy. If a 5-bar window gives you 40 and the strict one gives you 4, you know the window is carrying the result and needs its own scrutiny.
What to take from this
The pairing is not wrong. It is under-measured. The pitch is about accuracy and the problem is frequency, and the single published test we found says the strict version produced 14 trades in three years on one pair. That is a third-party result on one instrument, so treat it as a prompt to measure your own chart, not as a law.
The practical order is: state the rule with every parameter, count how often it fires, decide the tolerance window on purpose, then judge quality on a sample big enough to mean something. If the count comes out tiny, use the pair as a filter around a different trigger. The Quantzee Bollinger Bands glossary entry is the place to start on the band side, and paper trade any version before you risk capital on it. This is analytical software, not advice.