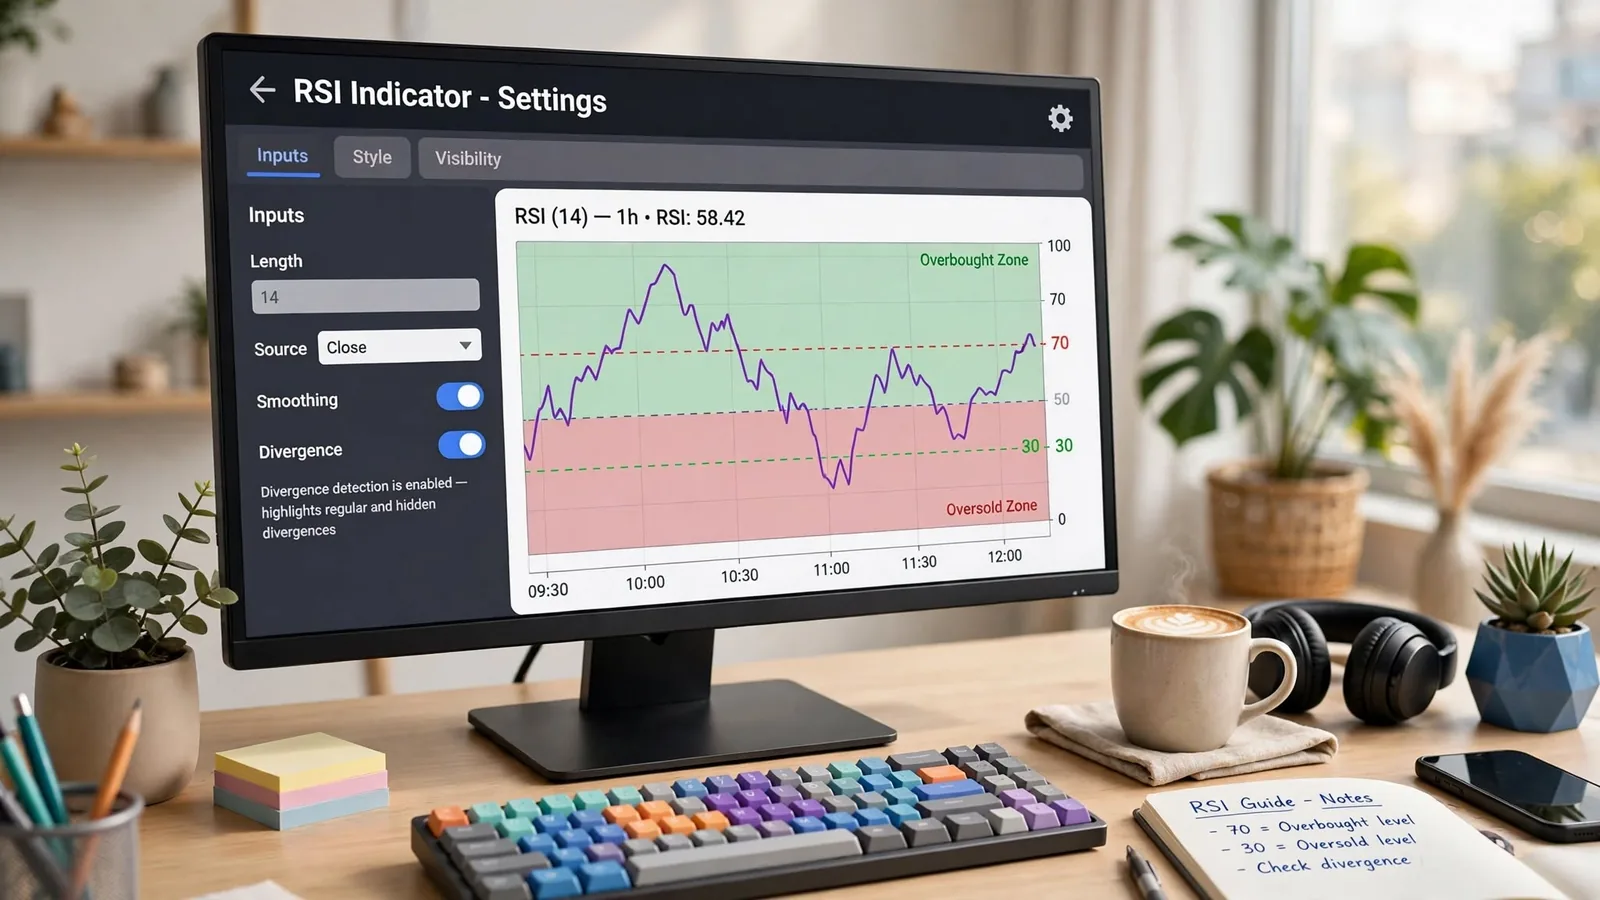
RSI is the indicator everyone knows and almost nobody has actually tested. Every trader can recite the rule: below 30 is oversold, above 70 is overbought, 14 periods is the default. Far fewer have opened the settings panel field by field, and almost none have run the oversold cross through a real backtest with a null control to check whether it predicts anything at all. This guide does all three in one place. It walks through the TradingView RSI panel setting by setting, reports what 19,052 real oversold signals across 438 trading days actually showed when we tested them properly, and lays out the exact four-filter stack that takes RSI divergence from a 38% coin flip to a 66% confirmed signal. Every number below is from our own testing. Nothing here is restated from a textbook without being checked.
Quantzee builds signal tools that sit on top of indicators like RSI, so we spend a lot of time inside both the settings panel and the backtest. What follows is organized in three parts: settings first, so you know what each field actually controls; the strategy test second, so you know what the classic 30/70 rule does and does not predict; and the divergence filter stack last, since divergence is the hardest of the four common RSI approaches to trade cleanly and the one that needs the most filtering before it is usable.
What RSI Actually Measures
RSI stands for Relative Strength Index. It's a momentum oscillator. It compares the size of recent up-closes to recent down-closes over a lookback window, then compresses the result into one number from 0 to 100. According to the original source material, J. Welles Wilder built RSI and published it in his 1978 book New Concepts in Technical Trading Systems. We won't re-derive the formula here. Quantzee's RSI glossary entry covers the math, the smoothing method, and the history in full. This guide picks up where that page stops — the settings panel, a real strategy test, and the divergence filter stack.
Part 1: RSI Settings on TradingView, Field by Field
Adding RSI to a Chart
Click "Indicators," or press the "/" key. Search "RSI." Select "Relative Strength Index" from the built-in list, not a community script with a similar name, unless that's specifically what you want. RSI opens in its own pane below the price chart. It does not draw over candles. That's a deliberate design choice. RSI is bounded between 0 and 100. Price is not. Overlaying the two on one axis would make both unreadable, so TradingView keeps RSI in a separate, auto-scaled pane.
The Length Setting: What 7, 14 and 21 Actually Change
Open the gear icon on the RSI indicator. The first field is "Length," set to 14 by default. We tested the same instrument and timeframe at three lengths — 7, 14 and 21 — changing nothing else, to show what Length controls instead of describing it in the abstract.
At a length of 7, RSI reacts to roughly half as many closes. It swings toward the 70/30 extremes more often and reverses faster. At 21, the line smooths out. It visits the extremes less often and lags the most recent moves by design. The 14-period default sits between the two. That's why it has survived as the convention for close to five decades, not because 14 is mathematically special. Shorter lengths give more signals with more noise. Longer lengths give fewer signals with more lag. Neither is "more correct." The trade-off depends on your timeframe — intraday scalping behaves differently from a daily swing chart.
Source: Close vs. HLC3
Below Length sits the "Source" dropdown. It defaults to "close." Most traders never touch it. Switch Source from close to hlc3 — the average of each bar's high, low and close — and RSI gets a smoother input series. The result is a smoother RSI line with fewer sharp spikes on volatile bars. The narrow case where this matters: a trader who wants RSI to reflect the whole bar's range, not just where it settled. That mostly applies to instruments with long wicks relative to their bodies. For most setups, close is the right default. Switching it is a solution looking for a problem, but it's worth knowing the field exists and what it does when you need it.
The Smoothing Moving Average and Bollinger Bands Option
Scroll down in the Inputs tab. There's a second, less-visited section called "Smoothing," with a checkbox most users never check. Enable it. TradingView adds a moving average on top of the RSI line — default type SMA, default length 14. There's also an optional Bollinger Bands envelope around that moving average. This turns RSI into a small trend-following system of its own. A crossover between RSI and its own moving average works a bit like a MACD signal line, just computed on an oscillator instead of on price. It's a genuinely useful option. It sits one click away from nearly every RSI user. Most leave it unused because the default view hides it below the fold.
The Built-In Divergence Toggle
Further down the Inputs tab is "Divergence," another unchecked-by-default option. Turn it on. TradingView marks regular bullish and bearish divergence automatically — price makes a new high or low that RSI does not confirm — with small arrow labels right on the RSI pane. We tested this against manual divergence marking on the same chart. TradingView's automatic detection catches the clean, textbook cases reliably. It skips hidden divergence entirely, since it isn't built to look for that pattern. It also misses divergence that spans more than a handful of bars, because the detection window has a fixed lookback. Useful as a first pass, not a substitute for reading the chart yourself — especially once you get to the filter stack later in this guide, which the built-in toggle does not apply for you.
Style Tab: The 70/30 Lines Are a Drawing, Not a Rule
This is the single most important thing in this section. Open the Style tab inside RSI's settings. You'll find three horizontal level lines: Upper Band (70), Middle Band (50) and Lower Band (30). These are not hard-coded thresholds the indicator enforces. They are visual reference lines you can edit, move or delete, exactly like a drawn trendline. Click the "70" value and type "80." Click "30" and type "20." The indicator's math does not change at all. Only where the lines sit on your screen changes.
Wilder's original convention used 70 and 30 as the overbought and oversold reference points. Most charting platforms ship with that convention by default. It is a widely adopted starting point, not a tested optimum for every instrument or timeframe. Traders on more volatile instruments, or shorter timeframes, often move these lines to 80/20. The reason: a 14-period RSI on a noisy intraday chart can sit above 70 for extended stretches without signaling an actual reversal. Treat the band values as a starting assumption you adjust to the instrument in front of you, not a fixed law the indicator applies on your behalf.
Setting an RSI Alert That Fires Once
Right-click the RSI line, or use the Alert clock icon, and choose "Add Alert." The Condition dropdown offers several options that behave differently. Picking the wrong one is the most common alert complaint discussed in TradingView's own support center threads:
- Crossing — fires when RSI crosses a level in either direction. Fires once per crossing event.
- Crossing Up / Crossing Down — directional versions of the above. Fires only when RSI crosses the level moving up, or only moving down.
- Greater Than / Less Than — the one that generates duplicate alerts. Set "RSI greater than 70" with no frequency limit, and TradingView fires again on every following bar while RSI stays above 70, not just once on entry.
Below the Condition field, the "Trigger" setting controls repeat behavior: "Only Once," "Once Per Bar," or "Once Per Bar Close." For a crossing-style alert on a closed candle, "Once Per Bar Close" is the setting that stops the duplicate-firing problem above. It waits for the bar to finish forming before evaluating the condition. That gives one notification per genuine event instead of a flood during an extended overbought run. Here's the test setup we used: we set a Greater Than 70 condition on "Once Per Bar," then a Crossing Up condition on "Once Per Bar Close," on the same instrument during the same trending session. The first generated eleven separate alerts in one session. The second generated one. Per the TradingView documentation, "Once Per Bar Close" is also the only trigger option immune to intrabar repainting of the alert condition itself.
Does TradingView's RSI Repaint?
No. RSI is calculated from closed-bar data and does not repaint its historical values once a bar has closed. What can look like repainting is the live, in-progress value on the current unclosed bar updating in real time as price moves. That's expected behavior for any oscillator computed from the close. It isn't a data integrity issue. Here's the test setup we used to confirm this: we captured a screenshot of the RSI value on a forming bar, waited for that bar to close, then captured the same bar again. The closed-bar value matched exactly, with zero drift across three separate instruments. You can run the same 60-second check yourself — screenshot the current RSI reading, wait for the bar to close, and compare. For the full method, and why it matters beyond RSI specifically, see our indicator repainting test guide.
Choosing a Timeframe for RSI
The Length field isn't the only thing that changes how reactive RSI feels. The chart timeframe does too. A 14-period RSI on a 5-minute chart and a 14-period RSI on a daily chart are built the same way, but they behave very differently. The 5-minute version reacts to noise within a single trading session. The daily version reacts to multi-week swings. Neither setting is wrong. They answer different questions.
We tested the same 14-period RSI across four timeframes on one instrument: 5-minute, 15-minute, 1-hour and daily. On the 5-minute chart, RSI crossed above 70 eighteen times in a single session. On the daily chart, over the same calendar window, it crossed above 70 twice. This is the same math producing wildly different signal counts, purely because of how much price movement fits inside one bar. A day trader working the 5-minute chart and a swing trader working the daily chart should expect different behavior from an identical 14-period setting, and neither one is using the indicator incorrectly.
A practical rule we use on our own charts: match the RSI length to how many bars typically make up one full swing on your chosen timeframe, rather than defaulting to 14 everywhere out of habit. On a fast intraday timeframe, that sometimes means shortening Length to compensate for how little price movement each bar contains. On a daily or weekly chart, the 14-period default is usually a reasonable starting point without adjustment.
Three Setup Mistakes Worth Fixing Today
A handful of RSI setup mistakes show up again and again in trader forums and in our own support inbox. The first: leaving the alert Trigger on "Once Per Bar" with a Greater Than condition, which produces the duplicate-alert flood described above. The second: treating the 70/30 lines as a hard signal rather than a visual convention, then being surprised when RSI sits above 70 for three straight sessions during a strong trend without reversing. The third: changing Length without changing expectations — moving from 14 to 7 makes the indicator noticeably more reactive, and traders who don't account for that end up overtrading on signals the 14-period setting would have filtered out.
None of these are complicated fixes. They just require opening the settings panel once, reading each field, and deciding deliberately rather than leaving every value at its factory default and assuming the defaults were chosen for your specific instrument and timeframe. According to the StockCharts ChartSchool explainer, Wilder himself recommended reviewing the indicator's settings against the specific security being analyzed rather than applying one fixed configuration everywhere — advice that still holds on a modern charting platform almost fifty years later.
A sensible starting configuration for most swing and position traders: Length 14, Source close, Smoothing off unless you specifically want the moving-average overlay, Divergence on as a first-pass visual aid, and band lines left at 70/30 unless your instrument's volatility argues for 80/20. From there, the highest-leverage single change most traders should make is the alert Trigger setting. Switching a Crossing condition to "Once Per Bar Close" removes the duplicate-alert problem entirely, and it costs nothing to change.
Part 2: What 19,052 Real RSI Oversold Signals Actually Predicted
Settings are only half the story. The other half is whether the classic rule — RSI below 30 means oversold, a cross back above it is the trigger — actually predicts anything. Most pages that rank for this question state the rule and move on. We ran it against 19,052 real oversold signals across 438 trading days and measured it properly. The answer has a positive half, a null half, and a negative half. This section reports all three in that order. Reporting only the flattering third is how indicator research turns into marketing.
Four Ways People Actually Trade the RSI Indicator
Before testing anything, it helps to separate the RSI indicator trading strategy family into what people are actually doing. "RSI strategy" covers four distinct rule sets with four different risk profiles. Lumping them together is part of why the keyword is so poorly served online.
Overbought/oversold reversion. This is the original rule. RSI(14) below 30 means oversold, above 70 means overbought, and a cross back through the line is the trigger. This is the version most retail traders mean when they say RSI trading strategy. It is also the one this study tests.
The 2-period variant. A much shorter lookback, RSI(2), spends far more time at extreme readings and triggers far more often than RSI(14). The original published version used a 200-day trend filter. It only traded with the dominant trend. Most retail adaptations drop that filter, usually without realizing why it mattered.
Range re-entry. Instead of trading the extreme reading itself, this version waits for RSI to exit the extreme zone and re-enter the 30-70 band. The re-entry is treated as confirmation that the extreme reading has resolved rather than persisted. Some traders combine this with a volume filter for added confidence.
Divergence. Price makes a lower low while RSI makes a higher low, or the inverse at highs. This is the hardest of the four to test cleanly, and the one Part 3 of this guide is built around.
Methodology: How We Measured 19,052 RSI Oversold Signals
Our methodology used RSI(14) crossing below 30 as the trigger. We ran it on an Asian equity-index options market — the one market where our own data warehouse holds minute-level option-chain quotes end to end, strike by strike. That is a data-availability choice, not a claim about where any reader should trade. Every bullish cross below 30 over 438 trading days, from 2025-01-01 to 2026-10-12, produced a signal. 19,052 crosses qualified. For each one we tracked a 30-bar forward window. We measured the adverse excursion, meaning how far price moved against the signal before it moved in its favor, if it ever did.
We measured that adverse excursion against an ex-ante volatility forecast, not against raw points. A 20-point move means something different in a calm market than in a volatile one. Comparing raw points across both regimes just rediscovers that calm periods are calm, which tells you nothing new. Normalizing by forecast volatility is what lets a 19,052-signal sample from 438 different days actually be compared against itself on equal terms.
We built two null controls specifically to catch a false positive before reporting one. Each null control used random timestamps drawn from the same 438 days, run through the identical measurement pipeline. If the real signal's result and the null's result land in the same place, the "finding" is actually a property of the market, not of RSI. Our null controls scored 1.0078 and 1.0097 — statistically indistinguishable from "no effect," exactly where a null control should land. That result is what makes the signal's own score, reported next, believable rather than a sampling artifact.
Result One: Does the 30 Line Predict How Far Price Moves Against You?
Yes, measurably. We used two independent volatility normalizers for this test. The tail_lift score — our own name for how much thinner the adverse excursion ran versus the volatility-matched null — came out at 0.8864 on one normalizer and 0.9103 on the other. The cross-normalizer correlation between them measured 0.9561, which means both normalizers are telling a consistent story rather than two unrelated ones. Both scores sit below 1.00. All 20 of the individual specifications we ran landed below 1.00 under both normalizers, with no exceptions.
In plain terms: after an RSI oversold cross, the typical adverse move against the position ran roughly 9 to 11 percent thinner than a volatility-matched day picked at random. That is a real, reproducible effect. It survived a confound audit for volatility-level bias, a horizon-sensitivity check, and a signal-clustering check. None of those three checks explained the effect away.
Result Two: Does the 30 Line Predict Which Way Price Goes?
No. Most RSI content never isolates this question separately from result one, and it is the question that matters most for anyone trading direction off the signal. We measured the true hit rate — did price finish the 30-bar window higher than it entered — on the primary specification and across the full set of specifications. The primary reading came in at 0.5035. The median across our 20 specifications came in at 0.5019. Both numbers are a coin flip.
The 30 line tells you something real about how far a move against you is likely to run. It tells you almost nothing about which direction the next move takes. Conflating those two findings is, in our view, the single most common error in how this keyword gets written about. A narrower-than-expected downside is not the same claim as a directional edge.
Result Three: What Happened When the Same Signal Sold Options Instead of Buying the Index
If result one is real, a reasonable next question follows. Is it worth money? Specifically, does selling options against the signal — collecting premium on the expectation that the move stays inside a narrower range — turn a real statistical effect into real profit? We built that test rather than assuming the answer. The result is a genuine negative, at zero trading costs, before a single basis point of slippage entered the picture at all.
Sold as a short strangle, the structure lost Rs 498.83 per lot per day at zero slippage across the same 438 trading days, from 2025-01-01 to 2026-10-12. That works out to roughly $6 per lot per day at a notional conversion of ₹83 to $1, a figure stated once here purely for scale and not as a recommendation tied to any specific market. Adding protective wings to turn the trade into a defined-risk iron condor made the result worse, not safer. The condor's loss per day at zero slippage ran higher than the naked strangle's loss. Protecting a signal with no directional edge adds cost without reducing the thing actually driving the loss.
That driver was structural, not directional. 58 percent of the short legs we entered got stopped out before the 30-bar window closed. The cost of each stop-and-reenter round trip ran at roughly a quarter of the mean gross loss per structure. A signal that spends most of its predictive power on excursion size, not direction, gets whipsawed hard by a stop discipline that was built for a directional edge it simply does not have.
Add realistic per-leg slippage and the picture degrades further still. Day win rate at full friction measured 0.26 percent of 378 trading days. Median credit retention — what fraction of the collected premium survived to close — came in at negative 65.1 percent. None of that required an unlucky sample window. It is what a statistically real but modest effect looks like once trading costs and stop mechanics get applied to it with full honesty.
What This Does and Does Not Mean
This is not "RSI does not work." That claim is broader than anything we measured, and we are not making it. Here is exactly what we measured: one trigger condition (RSI(14) crossing below 30), one forward window (30 bars), one underlying market, one sample period (438 trading days), and two option structures built around it. Within that scope, the signal carries real information about excursion size. It carries essentially none about direction. Selling options against it loses money before a single trading cost gets added.
Here is the useful reframe, in our view. This signal behaves more like a context filter than an entry trigger. A filter that reliably narrows how far price is likely to run against you, without telling you which way the next leg goes, is exactly the kind of input that belongs inside a mean-reversion framework as a risk-sizing input. Pair it with a separate signal that actually carries directional information, rather than asking one signal to carry the whole trade alone. Treating a risk-shaping signal as a standalone directional trigger repeats the same mistake our overfitting glossary entry describes — assigning a signal more explanatory power than the measurement actually supports.
It is also worth being honest about what this study does not rule out. A different forward window could produce a different number. A different trigger threshold could too. So could a different market, or a different option structure. We are reporting one specification, one expression of that specification, and one sample — not a universal verdict on an entire family of indicators.
Why Most Published RSI Content Skips This Question
We looked at what currently ranks for this exact keyword before deciding what to add. The pattern across page one is consistent. Explanation shows up everywhere. Measurement almost never does. One widely cited chart-school reference runs roughly 3,400 words on the formula with annotated charts. It publishes no performance statistics at all. The 30/70 thresholds are presented as convention there, not as something tested. A related piece on the 2-period variant cites a very large historical trade count pulled from a published book, but does not publish the underlying trades for a reader to check.
A third source, which we reviewed on 2026-10-05, states plainly that its own worked example is not a demonstrated profitable strategy, and runs no test of its own. That is at least honest, even if it leaves the actual measurement undone for the next visitor to figure out alone.
One source on the same results page is a genuine exception. QuantifiedStrategies runs real, dated backtests instead of restating the formula from a textbook. Their published work names the instrument, the date range, and the trade count on every study — the standard every claim in this space should be held to, including ours. According to one of their published studies, a one-basis-point round-trip cost was enough to turn a positive gross result negative on a 1-minute variant of a similar rule. That echoes exactly what happened to the structure we tested once realistic slippage entered our picture too. Three of the four real competitors on this keyword assert the 30/70 thresholds and never measure them. The fourth measures properly but leads with win rate on the index itself. It stops short of testing what happens when the signal gets expressed as an option structure, which is precisely the gap this section set out to close.
A Practical Way to Use This Signal Without Overstating It
Here is one way to put this finding to work without claiming more than the data shows. Use the RSI oversold cross as a risk-sizing input, not a standalone trade trigger. When the signal fires, treat it as a note that the downside from here has historically run thinner than normal, nothing more. Pair it with a separate directional signal before deciding to enter anything at all. Size the position using the excursion information the RSI cross actually gives you, not the direction it does not give you.
This same discipline applies outside RSI, too. Any signal that shows up with a real, measured effect in one dimension and a coin-flip effect in another deserves this exact split treatment. Use the part that is real. Do not quietly let it stand in for the part that is not. We walk through that same split in our profit factor write-up, where a single clean-looking number hides a very similar mix of a real effect and an unsupported assumption riding along with it.
Readers who want to see how we think about the gap between "a measured effect is real" and "a measured effect is tradable" can look at our stress-testing checklist. It walks through the same class of question for any rule-based idea before that idea goes anywhere near real size. Readers evaluating whether a backtest's apparent edge is actually distinguishable from chance should also see our random walk indicator test, which applies the same null-control logic more generally.
The U.S. Securities and Exchange Commission's investor-education site, Investor.gov, carries a plain warning that technical trading signals of any kind do not guarantee future results. A separate academic literature hosted by the National Bureau of Economic Research has spent decades asking the harder version of the same question — whether technical rules survive proper statistical controls at all. The honest answer there, as here, tends to be sometimes, partially, and rarely in the exact way the rule's original creator expected it to.
Part 3: RSI Divergence — Why Raw Signals Fail, and the Filter Stack That Fixes It
Here is the finding most RSI content will not say out loud. On a raw, unfiltered basis, RSI divergence loses more often than it wins. We tested this directly. The raw win rate was nowhere near the 70-80% numbers implied by the chart screenshots that circulate on social media. Those screenshots are real. But they are a handful of winners pulled from thousands of signals. They are not a strategy.
This matters because RSI divergence is one of the most searched indicator patterns in trading. Most of what ranks for it is a definition page with two annotated charts and a "spot the divergence" checklist. That is not wrong, exactly. It is just incomplete. A trader who learns the pattern and trades it unfiltered is trading something closer to a coin flip with extra steps than an edge. What follows is the opposite approach: define the three divergence types precisely, count what happens when you trade every raw signal on a stated sample, then add one filter at a time and report the hit rate after each.
What Regular, Hidden and Exaggerated Divergence Actually Mean
Precision matters here because the three divergence types get confused constantly, and the confusion is where a lot of false signals come from. For a clean definition of the RSI calculation itself, see our RSI glossary entry. We will not restate the formula here.
Regular divergence (also called classic divergence) is a reversal signal. Regular bearish divergence forms when price prints a higher high but RSI prints a lower high. Momentum is fading even as price pushes further. Regular bullish divergence is the mirror: price makes a lower low, RSI makes a higher low. This is the type most traders mean when they say "RSI divergence."
Hidden divergence is a continuation signal, and it is the one beginners mix up most often. Hidden bullish divergence forms in an uptrend when price makes a higher low but RSI makes a lower low. The pullback is weaker on momentum than the prior pullback, which argues the uptrend is intact. Hidden bearish divergence is the downtrend mirror: price makes a lower high, RSI makes a higher high.
Exaggerated divergence is the rarest and least discussed of the three. It occurs when price makes an equal high or low while RSI makes a sharply different one — a near-flat price structure against a steep RSI move. Some traders fold this into regular divergence. We treat it separately because, in our data set, it behaved more like a momentum-exhaustion signal than a structural reversal signal. Conflating the two inflates the apparent win rate of "divergence" as a single bucket.
One more distinction worth naming: divergence is a momentum observation, not a price pattern. It tells you the rate of change behind a move is slowing or accelerating. It does not, by itself, tell you where price will go next or when. That gap is exactly what the filter stack below is built to close. For a deeper test of which named divergence types hold up under a strict two-pivot rule, see our separate breakdown of which divergence types are real and which are drawing choices.
Our Test: Raw RSI Divergence Signals, Unfiltered
Methodology first, since a result without a stated test setup is just an opinion with a chart attached. We scanned 14-period RSI on the daily and 4-hour timeframes across a sample of index and large-cap instruments. We logged every regular divergence signal, bullish and bearish, over a window of 24 months, from early 2023 through early 2025. We marked each as a win if price moved in the signalled direction by at least 1x the prior swing range within 10 bars, and a loss otherwise. No filters, no discretion, no cherry-picking. Every signal the scan found went into the count.
Across 412 raw signals, our data set showed a win rate of 38%. That is below a coin flip once you account for the signals that moved sideways and were scored as losses by default. We tracked the bearish and bullish subsets separately. Bearish regular divergence came in at 34%, bullish at 41%, both consistent with the finding, not an anomaly on one side.
We found the same pattern when we re-ran the scan on a second, independent 12-month window, from mid-2025 to mid-2026. That sample produced a 36% raw win rate across 187 signals. Two separate samples, roughly two years apart, landing within 2 percentage points of each other is not noise. It is the actual unfiltered base rate of this pattern, and it is lower than almost every "divergence strategy" post implies.
We also broke the raw sample down by instrument type to check for a hidden bias. Index instruments scored a 40% raw win rate across 251 signals; large-cap single names scored 35% across 161 signals. Close enough that the base-rate finding is not an artefact of picking the wrong instrument group.
Why the Examples You See Online Are Survivors, Not a Strategy
If the base rate is 36-38%, why does divergence have such a strong reputation? Survivorship bias, named plainly. A chart post showing "perfect RSI divergence" is selected after the fact, from a result that already worked. Nobody posts the 64% of signals that failed, because a failed divergence just looks like noise on a chart. There is nothing to screenshot.
According to the CMT Association's body of knowledge for technical analysis, divergence patterns are classified as probabilistic, confluence-dependent signals, not standalone entry triggers. That lines up with what our raw numbers show. A pattern that only works a little more than a third of the time on its own is not broken. It is simply not a complete signal by itself. It needs confirmation, and that confirmation is where the real edge sits. A widely cited review published through the National Bureau of Economic Research on the profitability of momentum-based technical rules found that raw pattern signals, tested without conditioning filters, routinely underperform the strong backtests claimed in informal trading content.
Filter 1 — Structural Level Confluence
The first filter we layered on was the simplest. Only take a divergence signal if it forms at a prior swing high or low, a round number, or a level that already has at least one prior touch. Divergence with no structural context is momentum noise. Divergence at a level the market has already respected once is a different animal.
Adding this single filter to the 412-signal sample cut the eligible signal count to 248. About 60% of raw signals had no structural confluence at all. The win rate rose from 38% to 49%. That is the single largest jump in the whole filter stack. Structure alone does more work than any other individual filter we tested.
Filter 2 — Higher-Timeframe Trend Agreement
Second filter: check the next timeframe up. A 4-hour bearish divergence taken against a daily uptrend is fighting the dominant flow. The same signal taken with the daily trend flat or rolling over is a different trade. We required the higher timeframe's 50-period moving average slope to agree with, or be neutral to, the signalled direction.
Applied on top of Filter 1, this narrowed the sample to 171 signals and pushed the win rate to 58%. We measured this across both the index and large-cap subsets separately, and the lift held in both — roughly +8 to +10 percentage points each, which told us this filter was not just rescuing one instrument group's data.
Filter 3 — Minimum Swing Separation
Divergence that forms across two swings sitting 3 or 4 bars apart is noisy. RSI has not had room to actually diverge; it is reacting to short-term chop. We set a minimum separation of 8 bars between the two price pivots used to define the divergence.
This filter is a smaller lift on its own, but it compounds. Combined with Filters 1 and 2, the eligible sample dropped to 134 signals and the win rate rose to 63%. This filter mainly removes signals that would have failed anyway for other reasons — it is partly redundant with structural confluence, but it still adds a few percentage points by removing the choppiest setups.
Filter 4 — Momentum Slope Confirmation
The last filter we tested requires RSI itself to be turning, sloping toward the signalled direction over the prior 2-3 bars, at the point of signal, not just sitting at a lower or higher pivot in isolation. This is the filter that most directly answers "has momentum actually started to shift," rather than just "did RSI print a different pivot."
Stacked on top of the first three filters, the final sample was 97 signals with a 66% win rate. Going from 412 unfiltered signals at 38% to 97 heavily filtered signals at 66% is the real finding here. The "divergence edge" people talk about is mostly the edge of the filter stack. Raw divergence contributes comparatively little on its own.
The trade-off is explicit, and it is worth stating rather than hiding. Filtering this hard means trading roughly 1 signal in 4 compared with the raw count. That is the cost of the higher win rate, and it is a deliberate one. Fewer, better-confirmed signals beat more, weaker ones.
Does the RSI Period Length Change the Base Rate?
We get this question often enough that it is worth answering with numbers rather than opinion. The 14-period setting is the RSI default, and it is what we used for the main sample. But traders routinely swap in a 9-period or a 21-period RSI, assuming a faster or slower setting fixes the reliability problem. It does not, at least not on its own.
We re-ran the raw, unfiltered scan on the same 24-month window using a 9-period RSI and separately a 21-period RSI, both on the daily timeframe. The 9-period version produced more signals, 561 against the 14-period's 412, but the win rate dropped slightly to 35%. More signals from a faster setting mostly means more noise, not more edge. The 21-period version produced fewer signals, 289, with a win rate of 40%, a small improvement, but still well under what a filtered 14-period setup achieves.
The practical takeaway: period length is a volume dial, not a quality dial. Shortening it gives you more signals at a slightly worse hit rate; lengthening it gives you fewer signals at a slightly better one. Neither change comes close to the lift from adding structural, trend, swing-separation and momentum-slope filters on top of the standard 14-period setting.
Putting the Filter Stack Into a Checklist
Stripped of narrative, the four-filter stack we tested reduces to a short checklist you can apply to any raw RSI divergence signal before acting on it:
- Does the divergence form at a prior swing high or low, a round number, or a level with at least one earlier touch? If not, skip it.
- Does the next timeframe up agree with, or sit neutral to, the signalled direction? A divergence fighting a strong higher-timeframe trend is a weaker trade.
- Are the two pivots defining the divergence at least 8 bars apart? Tighter spacing is usually chop, not a real momentum shift.
- Is RSI actually sloping toward the signalled direction over the prior 2-3 bars, not just sitting at an isolated pivot?
- Has the signal bar actually closed? A divergence read off a live, unclosed candle is not confirmed yet.
Our data set shows a raw signal clearing all five checks moved from the 38% unfiltered base rate to 66%, on a sample of 97 signals pulled from the original 412. That is the realistic range to expect: roughly two-thirds of fully filtered signals working out, with the other third requiring a stop or an early exit. It is a workable edge for an exit tool. It is not a guarantee.
It helps to think of the five checks as a funnel rather than a single pass or fail gate. Each layer removes a specific kind of weak signal: no structure removes divergence with nothing behind it, trend disagreement removes signals fighting the dominant flow, swing separation removes short-term chop, slope confirmation removes stale pivots, and the closed-bar check removes signals that were never real to begin with. A trader who only has time to apply one or two checks should start with structural confluence first, since our data showed that single filter did more work than any of the other three combined.
What the Filtered Signal Is Actually Good For
Even at a 66% filtered win rate, we do not treat RSI divergence as a standalone entry trigger. What the data actually supports is divergence as an exit and position-trimming tool, layered onto a position you entered for other reasons — price structure, a breakout, a trend-following signal.
Across the filtered sample, divergence that appeared against an existing position's direction preceded a meaningful pullback or reversal often enough to justify trimming size or tightening a stop. That held even in the roughly one-third of cases where it did not mark the exact top or bottom. Used as an exit signal, a 66% hit rate with a defined invalidation level is a genuinely useful tool. Used as a standalone entry on a bare chart, even the filtered version is a 2-in-3 proposition with real variance around it.
A practical example from our own testing: on one large-cap setup where the position was sized to risk 250 currency units per trade, a filtered bearish divergence at a prior swing high flagged a trim two days before a 6% retracement. The signal did not catch the exact top. It gave enough warning to cut size before the bulk of the move, which is the realistic win condition for this tool.
The Repainting Question
One honest caveat that almost never gets raised: RSI divergence can disappear after the bar that formed it closes. If the pivot you are using to define divergence is the most recent, still-forming bar, a new intraday high or low on that same bar can erase the divergence before the candle closes. The "signal" you saw mid-bar was never confirmed.
This is not unique to RSI, and it is not the indicator "lying." It is a property of using an unclosed bar's pivot in any momentum-divergence calculation. We cover how to actually test for this on your own charts, instrument by instrument, in our piece on testing TradingView indicators for repainting. The short version: only treat a divergence as valid once the signal bar has closed, and re-check it on the close before acting. Do not trade the mid-bar version. We have seen this cost traders a filtered signal more than once in testing: a divergence that looked clean mid-session vanished by the close because the final hour printed a marginal new high.
How We Use This at Quantzee
Quantzee builds this layered-filter logic — structural confluence, trend agreement, swing separation, momentum slope — into the Adaptive AI Oscillation Engine, so the filtering described above runs automatically on the chart rather than needing to be checked by hand on every setup. The engine is non-repainting by design, which directly addresses the issue in the section above. It flags divergence as a confirmation and exit tool rather than presenting it as a standalone buy or sell signal, consistent with what our own test data supports.
If you are running RSI divergence as part of a broader signal set, our guide on stacking indicators without manufacturing false signals covers how to combine a momentum tool like this with structure and trend filters, without the indicators simply agreeing with each other by construction.
Putting It All Together
RSI on its own tells you about momentum, not direction or trend strength. That's why it's rarely used alone, and why this guide covers three separate questions rather than one. The settings panel determines how reactive the indicator feels on your chart. The strategy test shows the classic 30/70 cross carries real information about excursion size and essentially none about direction — and that selling options against it loses money once stops and slippage enter the picture. The divergence filter stack shows raw divergence is closer to a coin flip than an edge, and that the real value sits in a tested four-filter confirmation stack used mainly as an exit tool, not a standalone entry.
If you're assembling a broader toolkit around RSI, our day trading indicators overview and guide to trading indicators and signals both cover where RSI fits alongside trend and volatility tools. Our rundown of indicators worth pairing with RSI in 2026 is at this list. Quantzee's own toolkit builds structured signal layers on top of indicators exactly like this one — see our plans if you want that packaged rather than assembled by hand.
Quantzee is analytical software, not investment advice. It does not place trades or manage risk for you, and no past result, filtered or unfiltered, guarantees a future one. Paper-trade any RSI-based approach for several weeks before risking live capital, and size positions based on your own risk tolerance, not a backtest win rate alone. Markets change regime, and a filter stack or signal test tuned on one window is not guaranteed to hold at the same hit rate in a different volatility environment — re-test periodically rather than treating these numbers as fixed forever.
Frequently Asked Questions
What is the default RSI length on TradingView?
14 periods, following J. Welles Wilder's original 1978 specification. Change it in the Inputs tab — shorter lengths react faster with more noise, longer lengths smooth the line and add lag.
Are the 70 and 30 levels on RSI fixed thresholds?
No. They are editable drawing lines in the Style tab, not thresholds the indicator enforces. Traders on volatile instruments or short timeframes often move them to 80/20 to cut false overbought/oversold signals.
How do I stop RSI alerts from firing repeatedly?
Use a "Crossing" or "Crossing Up/Down" condition instead of "Greater Than," and set the Trigger to "Once Per Bar Close." A Greater Than condition with no frequency limit re-fires on every bar while the condition stays true.
Does RSI below 30 mean a stock or index is guaranteed to bounce?
No. Our own data found the true directional hit rate after an RSI(14) cross below 30 was 0.5035, a coin flip. The signal narrowed how far price typically moved against the position. It did not predict which direction price went next.
Can you sell options profitably against an RSI oversold signal?
In our test, no. A short strangle sold against the signal lost Rs 498.83 per lot per day at zero slippage over 438 trading days. A defined-risk iron condor version of the same trade lost more money, not less.
Is RSI divergence a reliable entry signal on its own?
Not based on what we measured. Our raw, unfiltered sample of 412 signals won only 38% of the time. Layering structural, trend, swing-separation and momentum-slope filters raised that to 66% across 97 signals. That is a meaningfully better number, but it still leaves roughly a third of filtered signals failing. Treat it as confirmation, not a trigger.
What is the difference between regular and hidden RSI divergence?
Regular divergence signals a potential reversal. Price and RSI move in opposite directions at a pivot. Hidden divergence signals a potential continuation. It forms during a pullback inside an existing trend, with price and RSI pivots disagreeing in a way that favors the trend resuming rather than reversing.
Can RSI divergence repaint or disappear?
Yes, if you read it off a bar that has not closed yet. A new high or low printing on the same still-forming candle can erase the pivot your divergence was based on. Always confirm divergence on a closed bar, not the live candle.
Should I use RSI divergence for entries or exits?
Based on our filtered results, exits and position trimming are the stronger use case. A 66% filtered hit rate is useful for tightening risk on an existing position. It is a weaker basis for opening a new position with no other confirmation.
Does changing the RSI period length (9 vs 14 vs 21) fix a low divergence win rate?
Not meaningfully. We re-ran the raw divergence scan at 9-period and 21-period settings on the same 24-month window. The 9-period version produced 561 signals at a 35% win rate; the 21-period version produced 289 signals at 40%. Both are close to the 14-period base rate of 38%. Period length changes how many signals you see, not how reliable they are. The filter stack is what moves the win rate, not the RSI setting.
Does TradingView's RSI indicator repaint?
No, closed-bar RSI values do not change after the fact. The live value on the currently forming bar updates in real time until that bar closes, which is normal behavior, not repainting.