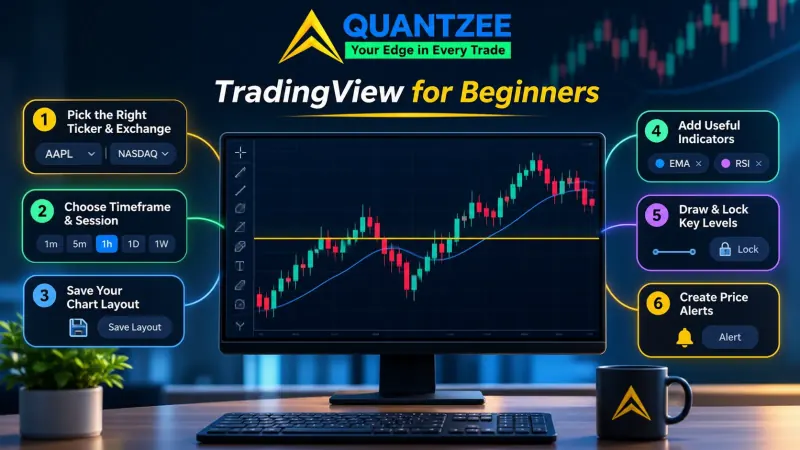
Is TradingView good for day trading? For charting, yes, and it isn't close. For the three things that decide whether a day trader can actually work on it, the answer depends on your plan and your market. Those three things are how many alerts you get and how late they arrive (measuring the whole alert-to-fill chain is a separate exercise), how many indicators fit on one chart, and what your data costs. Call them ceilings. Every review we read treats them as footnotes. We think they're the whole decision.
This isn't a platform review and there's no star rating at the end. It's a way to work out which single ceiling blocks you today, so you don't pay for features you'll never reach. Plan limits below were read off TradingView's own pricing page on 9 November 2026. Check the page again before you buy, because limits change.
Why the reviews don't agree with each other
When we opened three of the pages that rank for this question, we found they disagree on basic facts. One guide, last updated in January 2026, lays out a five-plan table with indicators per chart, alerts and chart layouts. Another, updated in November 2025, gives its own per-plan figures and a separate data add-on number. A third, dated March 2024, quotes plan limits that don't match either. The free tier is where they split most. Two sources give different indicator caps for it, and a third gives another.
Some of that is age. TradingView changes plans, and a 2024 article describes a 2024 product. Some of it is that reviewers copy each other. Whatever the cause, the lesson is the same: never take a plan limit from a blog, including this one. Take it from the pricing page, write down the date, and treat anything older than a few months as a question rather than a fact.
The same three pages are also quiet about the things a day trader feels first. None of them itemises what real-time data costs by exchange. Only one reports how late alerts arrive. None says where the platform stops and your broker starts. Those gaps are the reason this post exists.
Ceiling one: alerts, and how late they arrive
A day trader doesn't need an alert in the abstract. They need it fast enough that the setup still exists when the phone buzzes. There are two separate questions here: how many alerts your plan allows, and how long each one takes to reach you.
How many
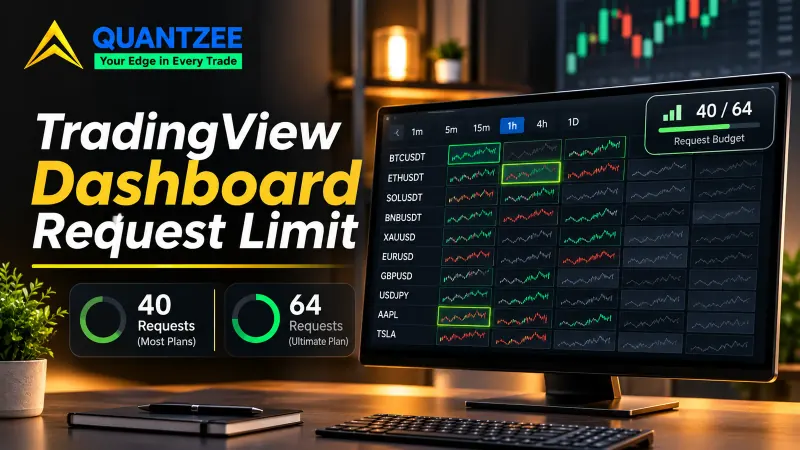
According to the pricing page as of 9 November 2026, the free Basic plan lists 3 price alerts. Essential lists 20, Plus lists 100, Premium lists 400, and Ultimate lists 1,000. If you watch two or three instruments and re-arm the same few levels each morning, 3 is tight but workable. If you run a watchlist of 15 symbols with a level above and below each, you need 30 alerts before you've added a single indicator condition. That puts you past Essential on day one.
The plan names matter less than that arithmetic. Count the alerts you'd really set on a normal session, add the ones tied to indicator signals, and compare the total with the cap.
How late
One of the three review pages reports that screener alerts arrived roughly 20 to 30 seconds after the event and says that can make fast trades unusable. It gives no method. No timing log, no sample size, no description of the connection or device. So treat it as a warning, not a measurement. Our team isn't going to publish a figure of our own either, because latency depends on your device, your network, the delivery channel, the alert type and even the data plan, since bundled Tradovate data on TradingView can be sampled, so a number from someone else's setup tells you little about yours.
What a day trader needs is a way to read their own latency. Here's a simple test setup you can run in one session.
- Pick one liquid symbol you trade. Set a price alert a known distance above the current price, close enough that it will trigger within the hour.
- Turn on one delivery channel only: the in-app popup, the mobile push, email, or a webhook to a logging endpoint.
- When the price crosses the level, note the chart time of the crossing from the one-minute bar. Then note the time the alert reached you.
- Repeat at least 10 times across the session. Do it again on a second channel.
- Compare the gaps. Look at the slowest one, not the average. The slowest one is the trade you'd have missed.
An hour of this gets you more usable information than any blog can. If your slowest push notification is 4 seconds late and your strategy holds for 20 minutes, ignore the whole debate. If you scalp for 30 to 90 seconds, a gap of that size changes everything. The point is that you decide with your own data.
One more thing on alert type. A price alert and an alert built from an indicator condition behave differently, and an alert on a still-forming bar can fire on a signal that disappears before the bar closes. We cover that trap in our guide to non-repainting indicators. Latency and repainting are separate problems, and mixing them up is how people blame the platform for something the indicator did.
Ceiling two: indicators per chart
The pricing page lists 2 indicators per chart on Basic, 5 on Essential, 10 on Plus, 25 on Premium and 50 on Ultimate. That's the caps as read on 9 November 2026. Published guides disagree about the free tier, which is exactly why the checked-on date matters.
The cap only means something against a realistic stack. A working intraday chart usually wants four jobs covered:
- A trend filter, so you know which side of the market you're allowed to trade.
- A session reference, such as a prior-day high and low or a volume-weighted average price, so you know where the day's participants have been.
- A momentum reading, to separate a pullback from a reversal.
- A volatility measure, so your stop and target scale with the day instead of with hope.
That's four indicators. On the free plan with a cap of 2, you can't run that stack on one chart. On a cap of 5 you can, with one slot spare. People searching for the best tradingview indicator for day trading often skip this step and ask which indicator to add before asking how many slots they have. Searches for best tradingview indicators for day trading return long lists, but a list of 12 is useless against a cap of 5. Pick the four jobs first, then fill each with one tool.
There's a workaround worth knowing, and a catch. Some script authors combine several readings into a single indicator, which uses one slot instead of four. That helps a capped chart. The catch is that you now depend on one script's logic, so read what it actually calculates before you trust it. Our AI Adaptive Quant Toolkit page documents exactly which readings it combines, which is the level of detail you should ask of any all-in-one script.
Our guide to day trading indicators walks through how those four jobs fit together on an intraday chart, if you want the stack before you count slots.
Ceiling three: data, and what it really costs
This is the ceiling that quietly decides most day-trading outcomes, and it's the one reviews skip. The platform's chart looks the same whether the prices on it are live or delayed. They aren't the same to trade on.
Here's what the pricing page says about it as read on 9 November 2026. Extra real-time and intraday data for exchanges such as NASDAQ, NYSE, NYSE Arca, OTC and CME is added separately, on top of your plan. You need a paid plan or a trial to add it. The page states no amounts for those exchange fees, and we won't guess them. Look at the data page for the exchange you trade and add the monthly fee to the plan price before you compare plans.
A few consequences follow from that structure.
First, a plan that looks cheap isn't the real cost. If you trade US equities live, your monthly cost is the plan plus the exchange data you add. Someone comparing a $0 plan to a paid plan is comparing the wrong things, because the free plan may leave you on delayed prices for the very market you want.
Second, futures and crypto behave differently from equities here. Crypto exchanges generally publish prices without a per-exchange fee, so a crypto day trader may find that data is not their binding ceiling at all. Futures data is billed through the exchange groups, such as CME. Equities sit in between, with separate feeds for each venue. Your market decides whether this ceiling matters, so check it for yours rather than assuming.
Third, the extra data works on the website and not on embedded widgets, according to the pricing page. If you were hoping to put live prices into a dashboard of your own, that's a different arrangement.
The test here is cheap. Open your main symbol and look at the chart's data label. If it says delayed, you aren't looking at a live market, and no alert limit or indicator count fixes that.
Where TradingView stops and your broker starts
New day traders trip on this boundary more than on any feature. TradingView is a charting and alerting platform. It isn't an execution venue for every market. Orders go through a broker, and the broker decides your routing, your fills and your commissions. The one review that raises the point says the platform isn't a standalone place to trade across all markets.
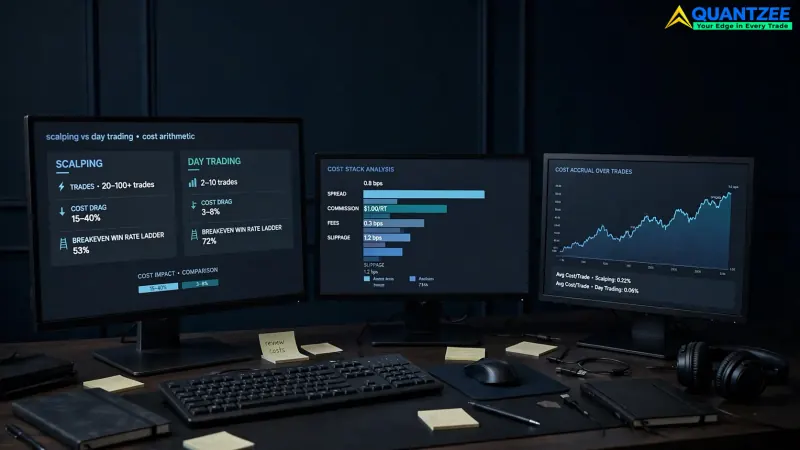
That matters because your slippage is a broker fact, not a charting fact. A beautiful chart with a perfect signal on a poor fill is still a loss. We aren't going to say anything about execution quality at any named broker, because we have no basis for it. What we can say is that when you compare setups, compare the full path: signal, alert, order, fill. The chart is the first link, and the weakest link sets your result.
FINRA, the US securities industry regulator, publishes a plain-language overview of day trading that is worth reading before you spend on any tool. Among other things it covers margin and the pattern day trader rules, and it makes clear that day trading carries a real risk of loss. The US Securities and Exchange Commission's investor site, Investor.gov, defines the pattern day trader designation in the same plain way. Account rules like these sit with your broker, not with your charting platform, and they can limit you well before any TradingView ceiling does.
Which day-trading styles the free tier supports
This isn't a recommendation. It's what follows from the three ceilings.
On the free plan, with 3 alerts and 2 indicators per chart, you can run a slow, level-based approach. Think one or two instruments, a handful of horizontal levels, a single trend or momentum line, and manual order entry at your broker. If you take 1 to 3 trades a day and decide by looking at the chart, the free tier covers the charting side. Whether your data is live is a separate check, as above.
What it can't support is anything that depends on volume of alerts or a full stack. A multi-symbol watchlist strategy needs more alerts than 3. A rules-based intraday system using four indicator jobs needs more slots than 2. An approach that depends on speed, such as scalping, depends on the latency you measured and on live data, and neither is something a plan tier improves on its own.
If that reads as a limitation, it should. The free tier works as a way to learn the platform and form a view, and it was built to nudge you toward paying. That isn't a complaint, it's just how it works.
The features that matter for intraday work and get skipped
Reviews spend their space on chart types and drawing tools. Three less glamorous features do more for a day trader.
Bar replay. The pricing page lists it on Essential through Ultimate. Replay lets you step through a past session bar by bar and practise a rule set without waiting for the live market. If you're building a routine, 20 replayed sessions are worth more than a week of half-attentive live ones. It isn't a backtest, though. Replay trains your eye and your discipline, and it says nothing statistical about whether a rule works. For that, see our walkthrough on how to backtest any TradingView indicator.
Multi-chart layouts tied to one symbol. Plans differ here as well. The pricing page lists 1 chart per tab on Basic, 2 on Essential, 4 on Plus, 8 on Premium and 16 on Ultimate. A common intraday arrangement is the same symbol on two or three timeframes side by side: a higher timeframe for the trend, a middle one for structure and a lower one for entry. That needs at least 2, usually 3. Essential covers two panes. Plus covers four.
Alert-to-webhook. Webhook alerts send the alert payload to an address you control, so a bot, a journal or a broker integration can act on it. It's the route to automation, and our webhook setup guide explains the plan and two-factor requirements and the payload format. The pricing page doesn't give per-plan webhook values in a way we could confirm, so check which plan unlocks it before you plan around it.
If you want to see how alerts, mobile delivery and your own rules fit together, the mobile alert workflow post covers the phone side of the problem.
When no plan upgrade fixes it
Here's the uncomfortable part. If your binding ceiling is data or latency, a higher tier doesn't solve it.
Suppose your own latency test shows alerts arriving 15 seconds after the event, and your style needs a response inside 5. Moving from Essential to Premium raises your alert count from 20 to 400. It doesn't change how fast the alert is delivered. In that case the honest options are a different delivery channel, a different alert design (for example, doing the logic closer to your broker), or a different platform altogether. Similarly, if the market you want has no affordable live feed on the platform, paying for more indicator slots doesn't make the prices real-time.
Plans are priced by features, and you may never reach most of them. Someone who needs live data for one exchange and four indicators on a chart may be fully served by a low tier plus a data add-on, while a heavier tier would add alerts they'd never set. Prices vary by region and billing period, so read the current figure on the pricing page for your country rather than quoting one from anywhere else.
The one thing to settle before you pay
Work through this list in order. Stop at the first line that's true for you, because that's your binding ceiling.
- My chart's price label says delayed for the market I trade. Fix data first.
- My slowest measured alert is longer than my shortest hold. Fix delivery first, or change platform.
- I need more than 3 alerts per session. Alerts are your ceiling, so size the plan to your count.
- I need more than 2 indicators to cover trend, session, momentum and volatility. Indicator slots are your ceiling.
- None of the above. The free plan probably covers you for now, and the better spend of money is time in bar replay.
Nothing in this post says any plan improves trading results. A bigger plan gives you more room, not more edge. If you do decide to add tools on top, our look at whether indicator subscriptions pay for themselves and the roundup of affordable TradingView indicators are the places to compare cost against use. Quantzee is analytical software, not advice, and paper trade any new setup before you put real money behind it.