If you're searching for how to use TradingView for beginners, you've probably already seen the feature tours: menus, toolbars, a hundred buttons, a promise that you'll "master the platform." This guide does something narrower. It gives you six skills, puts them in an order, explains why each one has to come before the next, and then tells you where to stop.
The order is our own editorial judgement, not research into what beginners struggle with. We'll show our reasoning for every step so you can disagree with it. And every plan limit below was read off TradingView's own pricing page on 18 November 2026, because those numbers change and most tutorials quote them without a date.
The short version
Pick the right listing of a symbol. Set the timeframe and session. Save a layout. Add one or two indicators and configure them. Draw a level and lock it. Build one alert from condition to notification. That's the whole list. Bar replay, paper trading, the strategy tester and Pine Script all come after, and the reason they come after is the most useful thing in this article.
Methodology: how the numbers and the order were produced
Here's the methodology, so you know what you're trusting. For the limits, our team opened the plan-comparison table on the TradingView pricing page on 18 November 2026 and read the Basic and paid columns line by line. We compared each limit against the six skills below and kept only the ones that change what a beginner can do. For the order, we asked one question per step: what breaks if the reader skips the step before it? Where the answer was "nothing," we merged or dropped the step. We haven't run a user study, and we aren't going to pretend one exists.
Skill one: choose the right symbol and the right exchange
Type a ticker into the search box and TradingView shows several results for the same name, each tagged with an exchange. They are not copies. The same company or the same crypto pair can trade on more than one venue, with different opening hours, different volume and different data rules attached.
Pick the wrong listing and the chart quietly disagrees with every screenshot you see in a tutorial. The candles are the same shape of idea but not the same candles. A volume spike on one venue is a flat bar on another. Nothing warns you.
This goes first because every later skill sits on top of it. An indicator calculated on the wrong listing is a correct calculation of the wrong thing. A level drawn there is a level on a chart nobody else is looking at. Spend the thirty seconds: read the exchange tag under the symbol name, and if you're following a guide, match its listing.
Skill two: set the timeframe and the session
Next, the interval. The buttons across the top, 1 minute, 5 minutes, 1 hour, 1 day, change what one candle means. A 15-minute chart and a daily chart of the same symbol can look like opposite stories because they are answering different questions. If you're new, start on a daily chart. It has the fewest candles per month, 21 or so trading days, and the least noise.
Then find the extended-hours toggle. Switching it on adds pre-market and after-hours trading to the chart, and every indicator recalculates using those extra bars. The numbers shift. Plenty of beginners switch it on, build a setup, close the tab, and come back the next morning to a chart that looks different because the session setting didn't travel with them the way they assumed. Check it deliberately, once, and leave it alone.
Why is this step two and not one? Because the interval and session only mean something once you know which listing you're looking at. It comes before indicators because indicators inherit both settings. Change the timeframe after you've configured an indicator and its output changes with it.
Skill three: save the layout
This is the dullest skill on the list and the one that saves the most time. A layout stores your symbol, interval, indicators, drawings and the arrangement of the chart. Without one, you rebuild from scratch every session, and a beginner who rebuilds daily never builds anything cumulative.
Look at the limit before you rely on it. According to the TradingView pricing page, read 18 November 2026, the Basic plan allows 1 chart per tab and a single saved layout, and the paid plans raise those in steps up to 8 charts per tab on Premium and 16 on Ultimate. For one symbol on one screen, Basic is genuinely enough. The constraint starts to bite when you want a daily chart and an hourly chart of the same symbol side by side, because that needs a second chart on the screen.
Save it early, before there's much on the chart, so the habit forms while the stakes are low.
Skill four: add one or two indicators, and configure them
Here beginners over-collect. The library has more than 150,000 community-built scripts, and the temptation is to stack ten of them. Don't. Add one or two, open each one's settings, and understand what every input does to the line on the screen.
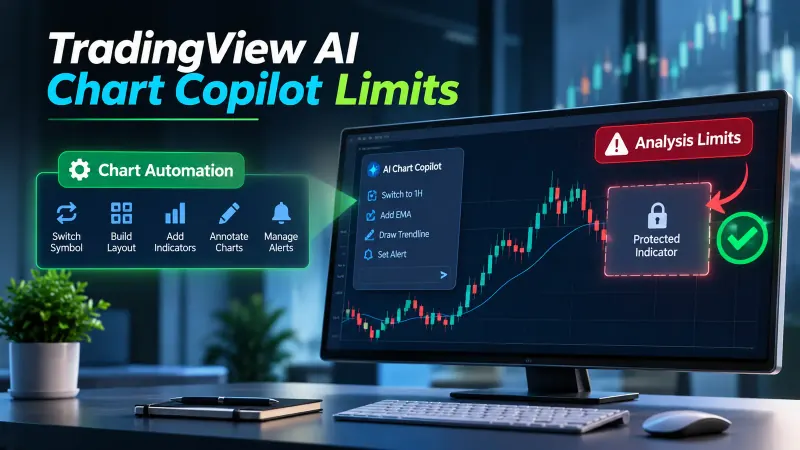
The plan cap is a gentle push in the right direction. Per the pricing page, as of 18 November 2026, Basic allows 2 indicators per chart, Essential 5, Plus 10, Premium 25 and Ultimate 50. A cap of 2 sounds restrictive until you read the reasoning in our guide on how to stack indicators without false signals: two indicators that you've configured deliberately will usually tell you more than six left on default settings, because the six mostly repeat each other.
Why does this come after the saved layout? Because a configured indicator is work you don't want to lose, and the layout is what keeps it. It comes after symbol and timeframe because an indicator's settings only make sense against the interval you chose in step two. For a wider map of what indicators do and how signals differ from noise, our guide to trading indicators and signals is the place to read next.
Skill five: draw a level once, then lock it
Drawing tools are where charting starts to feel like analysis. Pick the horizontal line, place it at a price that matters to you, such as a prior high or a round number, and lock it. The lock icon in the tool's floating bar stops a stray click from dragging the line a few ticks without you noticing.
That last part is the problem most beginners don't yet know they have. A hand-drawn level that moves by accident is a level you can't reproduce. If you can't redraw it the same way twice, you can't tell later whether the price respected it or whether you quietly nudged it to fit. The same discipline applies to angled lines, and we've written it out in full in how to draw trend lines the same way twice.
This step follows indicators because levels are only useful when you can compare them with something. A line on a bare chart is a doodle. A line next to a configured moving average or oscillator is a question you can start to answer.
Skill six: build one alert, end to end
This is the skill that turns a chart into a workflow. You stop sitting in front of the screen and let the platform tell you when something happens.
Walk through it once, completely. Pick the condition, for example price crossing your locked level. Choose the trigger: "once" fires a single time and stops, "once per bar" fires on the first touch in a candle, and "once per bar close" waits until the candle finishes. That last option is the calmest for a beginner, because a price that pokes through a level mid-candle and snaps back never fires it. Then choose where the notification lands, a pop-up, the app, email, and name the alert so you'll recognise it in three weeks.
Check the cap first. As of 18 November 2026, the pricing page lists 3 active price alerts on Basic, then 20 on Essential, 100 on Plus, 400 on Premium and 1,000 on Ultimate. Basic alerts also expire after 1 month, against 2 months on the higher tiers, so an alert you set and forget will simply vanish. Put a reminder in your calendar, or you'll wonder why your level didn't ping.
If you want your phone to do the work, the setup is covered in our mobile alert workflow for TradingView. Alerts come last in the six because they depend on all the others: a symbol, a session, a layout to live on, an indicator or level to reference.
The stop sign: what comes after these six, and why you wait
Almost every beginner guide keeps going. After alerts come bar replay, paper trading, the strategy tester and Pine Script, usually in the same article, as if they're the next menu item. They aren't. They're a different kind of tool.
The first six skills produce things you can check with your own eyes. You can see whether the exchange tag is right. You can see the extended-hours toggle. You can see a locked line. When you get one wrong, the error is visible.
Replay, paper trading and the strategy tester produce numbers: a win rate, a profit curve, a list of trades. Those look authoritative and are very easy to get wrong. A strategy tester result depends on assumptions about fills, fees and which bars were included, and a beginner doesn't yet have the instinct to question them. The output looks confident either way. That's the danger. Scripting sits one level above that, because a script can automate a mistake faster than you can make it by hand.
So the rule we'd suggest: don't open replay until you've set a saved layout and an alert without looking anything up. When you get there, our walkthrough on backtesting a TradingView indicator covers what the numbers can and can't tell you. Treat all of it as analysis software for studying charts, not a promise of any outcome.
Free or paid: which of the six skills is actually constrained?
You don't need a price table. You need to know which constraint hits which skill.
Skills one, two and five, symbol, session and drawing, aren't meaningfully limited on the free Basic plan. Skill three, the saved layout, is limited to 1 layout and 1 chart per tab, which only matters once you want multiple charts. Skill four is capped at 2 indicators, which is plenty while you learn. Skill six is where Basic feels tight first: 3 active price alerts and a 1-month lifespan.
So the honest answer is that a beginner can complete all six skills on Basic. The first plan upgrade that earns its price is usually driven by alerts or a second chart, not by anything on the first four steps. In our experience, people upgrade for the wrong reason, thinking more features will make them better at charting, when the skill they need is already available.
The data question: why a symbol says "delayed"
One more thing belongs in a first session, because it looks like a bug. You open a chart, the price seems a few minutes behind, and there's a small badge on the symbol marking it as delayed. Beginners assume something is broken.
It isn't. Exchanges charge for real-time data, and a delayed badge means your account isn't entitled to the live feed for that exchange. Data from the SEC's market data infrastructure rules explains why exchange data is licensed that way, and the investor education site at investor.gov describes what a real-time quote is and why it costs more than a delayed one. Your plan and your data subscription are two separate things. We unpack that in why your TradingView feed is delayed, and the billing split in your TradingView plan is not your data subscription. Read those instead of troubleshooting for an hour.
For background on the rules themselves, see the SEC's overview of market data infrastructure and the investor.gov glossary entry on real-time quotes.
Where to go from here
Do the six in order, once, on a single symbol. By the end you'll have a saved layout with a configured indicator, a locked level and a live alert. That's a working chart, and it's a better start than any tour of the toolbar. If you want to see how the pieces fit into the wider picture of indicators and signals, begin with our guide to trading indicators and signals, and bring a Quantzee indicator onto the chart when you're ready for a fourth or fifth layer.