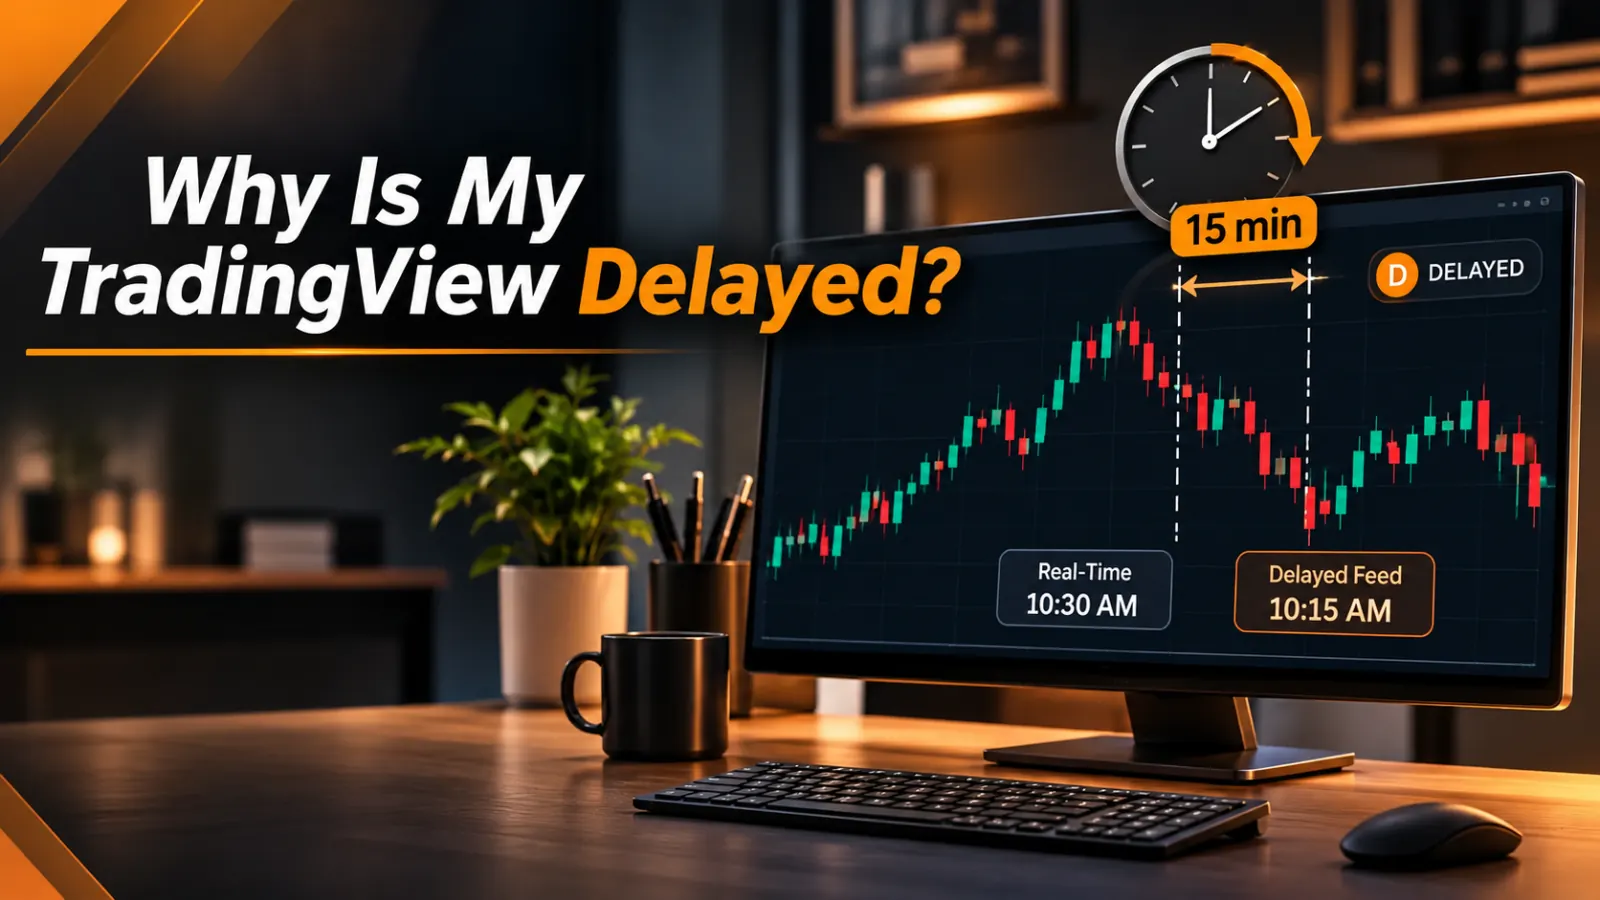
If you're asking "why is my TradingView delayed," the short answer is almost always licensing, not a bug. Exchanges charge for real-time distribution of their prices, and that entitlement is sold separately from your TradingView plan. Upgrading to a higher plan doesn't, by itself, make a delayed symbol real-time. You need the data package for that specific exchange. Until you have it, the chart shows prices that are 10 or 15 minutes old, depending on the market.
That's the half every billing page already covers. The half that matters more if you run indicators or alerts is what a delayed feed does to their output. A delay isn't a display problem. It's a signal-timing problem. The last bar on a delayed chart is a bar that already finished in the real market, and everything stacked on top of it inherits that lateness. This guide explains how to confirm the delay in ten seconds, walks through a worked timeline you can reproduce, and separates the things a data package fixes from the things it doesn't.
Why is TradingView delayed in the first place?
Exchanges own their price data and license it. Per the SEC's description of market data infrastructure, real-time equity quotes are collected, consolidated and sold under a fee structure set by the exchanges and the plans that govern them. A platform like TradingView can show you those prices free of charge only after a waiting period, or in real time if somebody pays the exchange fee. The SEC's investor site defines real-time quotes as the counterpart to delayed ones, and that split is what you're seeing on the chart.
The window isn't the same everywhere. According to TradingView's own data-coverage page, read on 16 November 2026, the free delayed window was:
- 10 minutes for CME Group futures (CME, CBOT, COMEX, NYMEX) and for the S&P and Dow Jones index feeds
- 15 minutes for US listed options (OPRA), the London Stock Exchange, Deutsche Börse Xetra and the Euronext bundle
- "limited real-time via Cboe One" for NYSE and NASDAQ stocks, meaning you get a real-time price from a subset of venues rather than the full consolidated tape
- real-time and free for most crypto venues (Binance, Coinbase and many others) and for many forex feeds such as FXCM
These windows and the package prices next to them change. Treat every figure above as dated to 16 November 2026 and check the coverage page before you buy anything. Prices there are also shown in your local currency, so we haven't quoted them here.
How to confirm your chart is delayed in ten seconds
Look at the symbol status line in the top-left corner of the chart, next to the ticker and timeframe. A delayed symbol carries a small badge, usually an orange "D" or a clock icon. Hover over it. The tooltip names the exchange, says the data is delayed and gives the window in minutes. If there's no badge, the symbol is real-time on your account, and the problem is somewhere else.
"Somewhere else" is usually one of two things. A laggy browser tab feels similar but behaves differently: the price freezes for a few seconds, then jumps forward in a burst, and the clock on the chart's time axis keeps pace with your wall clock. A delayed feed moves smoothly. It's just consistently 10 or 15 minutes behind, so the last candle's timestamp sits behind your clock by exactly the delay window. Compare the time on the most recent candle with the actual time. A gap that matches the badge is a feed delay. A gap of a few seconds that comes and goes is your connection, your device or too many open tabs.
The third possibility is a thinly traded symbol. A stock that trades once every few minutes prints a new candle only when a trade happens, so the chart can look "behind" even on a real-time feed. That's an update-cadence effect, not a delay, and no subscription changes it.
A worked timeline: what a 15-minute delay does to a 5-minute chart
Abstract explanations don't help much here, so our team built one concrete timeline to show the mechanism. The methodology is simple: take a stated chart, a stated delay and a stated bar, then track when each event happens in the real market versus when it appears on your screen. These are illustrative clock times, not a measured trade.
The setup: a Xetra-listed stock on a 5-minute chart, free account, 15-minute delay (the window listed for Xetra on 16 November 2026). An indicator on the chart plots a buy signal only when a bar closes above a moving average.
| Real market time | What happens in the market | What your delayed chart shows |
|---|---|---|
| 10:00 | The 10:00–10:05 bar opens | The 09:45 bar is forming |
| 10:05 | The 10:00 bar closes above the average. The signal now exists | The 09:50 bar is forming |
| 10:10 | The 10:10 bar opens. Price is already one full bar past the signal | The 09:55 bar is forming |
| 10:15 | A third bar has opened since the signal | The 10:00 bar starts forming |
| 10:20 | The 10:20 bar opens | The 10:00 bar closes. Your signal and its alert appear now |
The confirmed signal reaches you at 10:20 for a bar that closed at 10:05. By then the real market has finished three more 5-minute bars. On a CME futures contract with a 10-minute window, the same signal would surface two bars late. Nothing about the indicator is wrong. It calculated the right value for the right bar. That bar was simply in the past by the time you saw it.
Effect one: close-confirmed signals arrive late by the full window
Most non-repainting indicators, including the ones we built for Quantzee, wait for a bar to close before they confirm. That rule is what stops a signal from appearing and then vanishing. On a delayed feed it also means you never get to act early. The confirmation is late by the full delay window, every time, with no warning on the chart that it's late.
The shorter your timeframe, the worse this gets. A 15-minute delay on a daily chart is a small fraction of one bar. On a 1-minute chart it's 15 bars. If your entries come from 1- or 5-minute signals on a delayed symbol, the signal describes a market you can no longer trade.
Effect two: intrabar and crossing alerts fire on stale prices
This one is different from "the alert is late," and it's worth keeping the two apart. Say you set an alert for price crossing below 50.00, evaluated on every tick. In the real market, price dips under 50.00 at 10:02 and climbs back above it at 10:06. On a 15-minute delayed feed, TradingView sees that dip at 10:17 and fires the alert then.
At 10:17 the real price has been back above 50.00 for 11 minutes. The alert didn't just arrive late. It fired on a level the market had already reclaimed. If that alert feeds a webhook into a broker or automation tool, the order goes out against a condition that's no longer true. In our experience, this is the delayed-data failure that surprises people most, because the alert message itself looks perfectly normal.
If you get alerts on your phone while away from the desk, check every symbol in that setup for the delay badge before you rely on it. Our mobile alert workflow for TradingView assumes real-time symbols, and it's only as good as the feed under each alert.
Effect three: the strategy tester and backtests
Two claims get mixed up here, so let's split them.
First claim: the delay doesn't corrupt historical data. Once a bar is in the past, the delayed copy and the real-time copy are the same bar, with the same open, high, low and close. A backtest run in the strategy tester on a delayed symbol produces the same results as one run on a real-time symbol, because both are reading finished history.
Second claim: a backtest result assumes you acted at the signal bar. If your own live feed carries a 15-minute delay, you can't. In the timeline above, the backtest records a fill near the 10:05 close. Live, you'd see that signal at 10:20 and get whatever price existed then. The backtest isn't wrong, but its fills are unreachable for you specifically. That's one of several reasons we cover in why a backtest doesn't match live trading, and it's the easiest one to fix.
We haven't measured how often a delayed signal changes a trade's outcome, and we won't put a figure on it. It depends on the symbol, the timeframe and how fast price moves after the signal. What's certain is the timing gap itself, which is exactly the delay window.
What a data package actually fixes
A real-time entitlement removes the delay for the exchanges it covers, and only those. Equities, futures and options are licensed separately. Buying real-time CME data doesn't make OPRA options real-time, and a US stock package doesn't touch Xetra or the London Stock Exchange. Check the exchange named in the delay tooltip and buy that one, not a bundle you don't need.
A few points that save money:
- Most crypto and many forex symbols are already real-time on a free account, per the coverage page on 16 November 2026. If that's all you trade, you don't need a data package at all.
- Exchanges price professional and non-professional users differently. Answer the subscriber questionnaire accurately, since professional rates are much higher.
- The same contract often trades on several venues. A CFD or broker feed for an index can be real-time when the exchange feed isn't, though its prices won't match the exchange tick for tick.
Our deep dive on TradingView real-time data goes further into forward tests and indicator readings once you've decided to pay.
What a delayed feed does NOT break
Plenty of work is fine on delayed data. If your decision is made on a completed daily or weekly bar, a 15-minute delay is irrelevant by the time you look. The same goes for:
Marking support and resistance levels, drawing trendlines, reading chart patterns on 4-hour and higher timeframes, studying market structure, and reviewing past trades. Swing traders who plan the night before and place orders through their broker, which has its own real-time quote, often never need a data package. The delay only bites when the decision and the action happen inside the delay window.
Delay vs repainting: two problems that look alike
A delayed feed and a repainting indicator produce complaints that sound the same: "the signal showed up late" or "it looked different live than in the history." They have nothing to do with each other.
A delay shifts everything by a fixed amount, and the signal never changes once it appears. Repainting means the indicator rewrites past values when new data arrives, so a signal can appear, move or vanish. A delayed chart with a non-repainting indicator shows the same signals as the real-time chart, just later. A real-time chart with a repainting indicator shows signals that may not survive. When we review support tickets, the first question is always which of the two it is. You can check the indicator side yourself with our five-minute repainting test, then check the badge for the feed side.
A quick checklist before you trust a signal
- Is there a delay badge on the symbol? If yes, note the window in minutes.
- Is your timeframe short enough that the window spans one or more bars?
- Does the alert fire on bar close or on every tick? Tick alerts on delayed data can fire on reclaimed levels.
- Does an automated action follow the alert? If so, real-time data for that exchange isn't optional.
- Is the "late signal" a fixed lag, or does the signal move? A moving signal is repainting, not delay.
Frequently Asked Questions
Quantzee builds non-repainting, bar-close-confirmed indicators for TradingView, and they work best on a real-time feed for the exchanges you trade. Check your delay badge first, then pick the data package that matches the symbols you actually act on. If something still looks off, our troubleshooting FAQ covers the other common causes. Quantzee is analytical software, not trading advice.