Scalping vs Day Trading: The One Table That Actually Answers This
Most "scalping vs day trading" comparisons describe personality — scalping is fast and nervy, day trading is patient and structural — and stop there. That's not the part that decides whether you can actually run the style. The part that decides it is cost arithmetic: how many trades you take, what each one costs you before you've made a cent, and what win rate you need just to break even. Here's the comparison in one screen before any argument starts.
| Dimension | Scalping | Day Trading |
|---|---|---|
| Typical hold time | Seconds to a few minutes | Minutes to hours, closed same session |
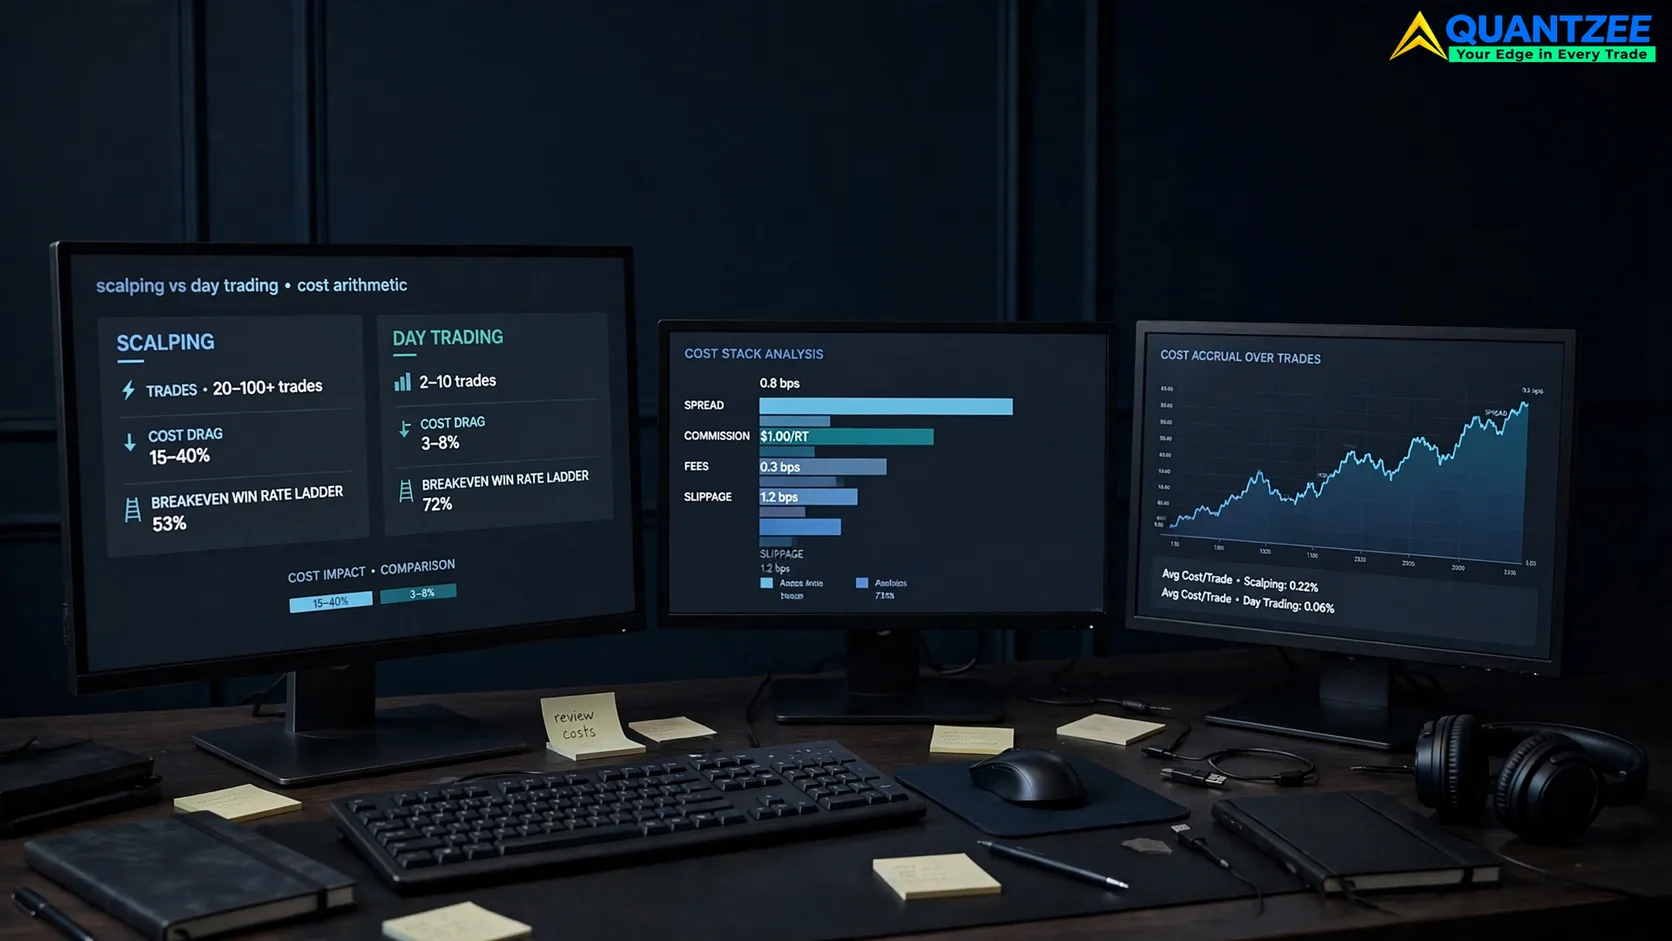
| Trades per session | 20–100+ | 2–10 |
| Target per trade | Small — fractions of a percent, a few pips, or a few cents | Larger — a full intraday swing or structural move |
| Screen time required | Continuous, full attention on execution | Periodic monitoring between setups |
| Cost exposure per dollar of gross target | High — costs are a bigger share of a small target | Lower — costs are a smaller share of a larger target |
That last row is the one nobody puts a number on. Our team compared published spread, commission, and exchange-fee schedules across four instrument classes to build the tables below, so the rest of this piece turns that row into real figures.
Why Trade Count Is the Only Variable That Matters
Both styles can be gross-profitable. The arithmetic problem isn't whether a scalping setup or a day-trading setup "works". It's that trading costs scale roughly linearly with the number of trades you place, while your per-trade target does not scale the same way. A trader taking 50 trades a day pays the spread, the commission, and the slippage fifty separate times. A trader taking 4 trades a day pays it four times. If the per-trade target doesn't grow to match that extra cost load, the faster style needs a structurally higher win rate just to stand still.
This is the entire reason the scalping vs day trading decision is a cost decision, not a personality decision. A trader with a disciplined process and a thin cost base can scalp profitably. A trader with the exact same skill, but a retail-sized cost base on each ticket, will bleed out from trade count alone. That happens long before a strategy edge gets a chance to show up in the equity curve.
The Cost Stack, Itemised
"Costs" isn't one number. It's five, and they don't all scale the same way:
- Spread — the gap between bid and ask, paid on every entry and exit. Scales per trade, not per day, so it is the single biggest multiplier against a high trade count.
- Commission — a flat or per-contract/per-share fee charged by the broker. Scales per trade (sometimes per round trip).
- Exchange and regulatory fees — passed through on listed products such as futures and options, and on US equity sales via the regulatory transaction fee. These are small per trade but, like spread and commission, scale with trade count rather than with how long you hold.
- Slippage — the gap between the price you wanted and the price you got, driven by order size relative to liquidity and by how fast the market is moving when you need to get out. Covered in its own section below.
- Financing — overnight funding or swap charges. This one scales with hold time, not trade count, which is why it barely matters for scalping (positions rarely survive long enough to be charged) but matters more for day trades held into session-end funding windows.
Four of these five costs are charged per transaction, independent of how big the move was. That's the structural reason a strategy that fires 50 times a day needs a completely different cost tolerance than one that fires 4 times a day.
Cost Drag Per Trade, by Instrument Class
Round-trip cost as a share of a typical target varies sharply by what you're trading. We built the figures below as a worked sample of publicly published fee schedules and contract specifications across four instrument classes — not a forecast of what you will pay. Substitute your own broker's published spread and commission schedule before you rely on any of this. Treat every number in this table as a placeholder for your own numbers, not as a universal constant.
| Instrument class | Illustrative round-trip cost | Illustrative scalp target | Cost as % of scalp target | Illustrative day-trade target | Cost as % of day-trade target |
|---|---|---|---|---|---|
| US equities (liquid large-cap) | ~$2–6 per round trip (commission + spread on 100–300 shares) | $10–20 | ~15–40% | $60–150 | ~3–8% |
| Index futures (e.g. E-mini class) | ~1–2 ticks spread + exchange/clearing fees per round turn | 2–4 ticks | ~30–60% | 10–25 ticks | ~5–15% |
| Spot FX (major pairs) | ~0.1–2 pips spread, commission varies by account type | 3–8 pips | ~5–30% | 20–60 pips | ~2–8% |
| Crypto (major pair, centralised venue) | ~0.02–0.10% taker fee per side, spread varies by venue depth | 0.1–0.3% | ~15–60% | 0.8–2.5% | ~3–10% |
The pattern repeats across every instrument class: the faster the style, the smaller the denominator you're dividing the fixed-ish cost into, and the bigger the drag. This is also why instrument selection matters as much as style selection — a scalper trading a wide-spread instrument is fighting the arithmetic twice over.
The Breakeven Win Rate Ladder
This is the number that actually settles the scalping vs day trading question for your own account: the win rate you need, at a fixed risk-reward, just to cover costs — before a single dollar of edge shows up. The formula is simple: at a 1:1 risk-reward, breakeven win rate = 50% plus half the cost drag expressed as a percentage of your target. As cost drag rises, so does the win rate floor you need to clear before "profitable" even starts.
| Trades per day | Illustrative cost drag (mid-range, equities example) | Breakeven win rate at 1:1 R:R |
|---|---|---|
| 5 | ~6% | ~53% |
| 20 | ~25% | ~62–63% |
| 50 | ~45% | ~72–73% |
Read the ladder, not any single row. Going from 5 trades a day to 50 doesn't make you five times more exposed to cost. It moves your breakeven win rate from "slightly above a coin flip" to "needs to be right roughly three times out of four, just to tread water." That's the real cost of frequency. According to one editorial cost breakdown of scalping published this year, a worked 0.1-pip-spread, $7-commission scenario put round-trip cost at roughly a third of a scalper's gross target — data from that single scenario translates to a breakeven win rate near two-thirds. Run the same ladder with your own cost numbers before you commit to a trade-count target. The breakeven floor is specific to your account, not a constant you can borrow from someone else's example.
None of this tells you what win rate you'll actually get — that depends on your edge, not your costs. It tells you the floor your edge has to clear before it's worth anything.
Slippage Gets Worse Exactly When You Need It Not To
Slippage isn't a flat tax — it's conditional. It's smallest when liquidity is deep and the market is calm, and largest exactly when volatility spikes and you most need a clean exit. A scalper holding for 90 seconds on a 1-minute chart gets far less time for the market to "settle" between entry and exit than a day trader holding for two hours, so the same instrument tends to hand the scalper a worse average slippage outcome relative to target size. See our slippage glossary entry for the full mechanics of how it's measured and what drives it wider.
Repainting Hurts More at the Faster Frequency
A repainting indicator — one that redraws a prior signal after the bar that generated it has closed — costs every trader who uses it. But the cost compounds faster for a scalper, because a 1-minute scalp has almost no margin to absorb a signal that turns out to have been different in hindsight than it appeared live. A day trader on a 15-minute or hourly chart has more room for a late-forming signal to still be actionable. We've covered the mechanics and how to test for it in detail in our non-repainting indicators guide — worth reading before you pick tools for either style.
Day Trading vs Scalping: The Definitions, Briefly
Scalping means taking a large number of short-duration trades, usually held for seconds to a few minutes, to capture small, repeated price moves. Day trading means opening and closing positions within the same session, but holding each one longer — minutes to a few hours — to capture a larger intraday swing with fewer total transactions. The core distinction that matters for everything above isn't the label, it's the trade count and the target size behind it: scalping trading meaning, in practice, is "many small bets," and what is scalping in day trading terms is really the high-frequency end of the same intraday spectrum, not a separate activity. Day trading vs scalping is a frequency choice, not a different market.
Which Style Fits Your Constraints
This isn't a case for one style being better than the other — it isn't, in general. It's a case for checking whether your specific cost base and execution quality can support the trade count you're planning to run, before you build a strategy around it. A lower-frequency, day-trading-style approach is more forgiving of a retail-sized cost base, because cost is a smaller share of a larger target. A scalping-style approach can absolutely be run profitably, but it requires either a materially lower cost base (tighter spreads, lower commission, deeper liquidity) or tighter, more consistent execution than the day-trading style needs — not more conviction, and not a "better" edge. If you're comparing tools built for the faster end of this spectrum, our breakdown of the best scalping indicators for TradingView covers what we look for in a signal that can actually keep up with the cost clock above. For the fewer-trades, larger-target style, our day trading indicators guide and intraday strategy blueprint cover the equivalent setup for that cadence. And whichever style you land on, sizing each position against your own risk tolerance — not the target table above — is what a position size calculator is for.
For the regulatory and exchange side of the cost stack specifically, per the fee schedule FINRA publishes, the Trading Activity Fee applies on US equity and options sales — a useful reference point for confirming that per-transaction regulatory costs are real and published, not an estimate: FINRA Trading Activity Fee schedule.
Frequently Asked Questions
None of the figures above are a promise of what you will earn or a claim about what any trader should expect — they're a worked set of assumptions meant to be replaced with your own broker's published numbers. The arithmetic doesn't pick a winner between scalping and day trading. It tells you which one your account can actually afford to run.