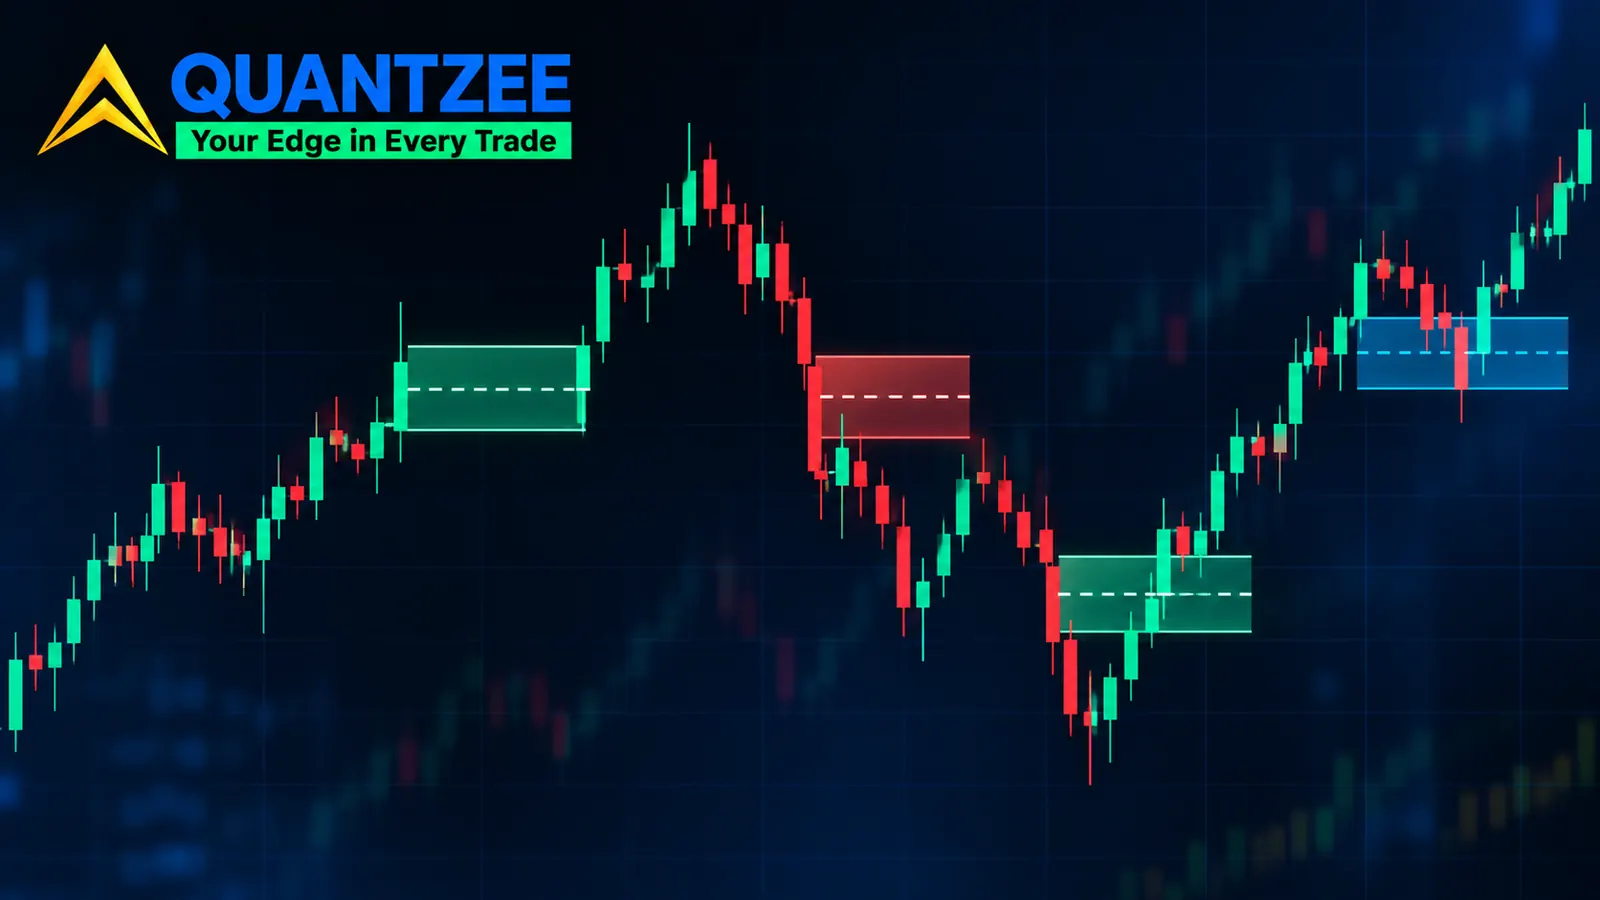
Load three popular fair value gap indicator scripts on one chart and you won't get one set of boxes, you'll get three. Each script runs its own detection rule, its own size filter and its own idea of when a gap is "filled", so each one draws a different sample and reports a different fill rate. That matters more than it sounds, because every fill-rate number you read about fair value gaps is really a number about one script's settings, not about the market.
This page puts the rules side by side. We read the published descriptions of three open-source TradingView scripts, wrote each rule down as plain logic, then ran them against 45 days of BTC/USDT 15-minute data to see how far the gap count and the fill rate move purely because of the rule. If you want the basics of what a gap is, our 500-gap fill-rate study on ES, BTC and EURUSD covers that ground. Here the subject is the detection rule itself.
What a fair value gap indicator actually checks
Strip away the colours and labels and every gap script starts from the same three-candle test, so call the newest closed candle bar 0, the one before it bar 1, and the one before that bar 2.
- Bullish gap:
low[0] > high[2]. The zone runs fromhigh[2](bottom) tolow[0](top). - Bearish gap:
high[0] < low[2]. The zone runs fromhigh[0](bottom) tolow[2](top).
That's the textbook rule, and real scripts bolt extra conditions on top. Per the LuxAlgo description, a bullish gap also needs close[1] > high[2], so the middle candle has to close above the reference level. The Viprasol script instead asks for a bullish middle candle, meaning close[1] > open[1]. Both sound like they tighten the rule, but on a lot of charts they don't.
Here's what we found when we ran the numbers on BTC/USDT, which trades around the clock: each candle opens at or very near the previous close. If low[0] sits above high[2], then the middle candle's close (which is roughly bar 0's open, and bar 0's open can't be below its own low) is already above high[2]. The middle candle opened near close[2], which is at or below high[2], so it must also have closed higher than it opened. In our data set, all 1,035 plain gaps passed both extra conditions. Not most of them. All of them.
So those two filters only bite on markets with real opening gaps between bars: equity index futures across the daily break, single stocks, or any chart where the session closes. On a 24/7 crypto chart they're decoration. That's worth knowing before you assume a "confirmed" gap script is being stricter than a plain one.
Three scripts, three detection rules
The three scripts below were picked because they rank on the first screen for this query and all three publish their logic openly. Everything in the table comes from each script's own description. Where a description doesn't state something, the cell says so.
| Rule | LuxAlgo Fair Value Gap | Viprasol FVG with Fill Tracking | TehThomas Fair Value Gaps |
|---|---|---|---|
| Core test | Wick-to-wick, plus prior close must clear the level | Wick-to-wick, plus bullish (or bearish) middle candle | Wick-to-wick only |
| Size filter | Gap height as a % of price must beat a threshold; "Auto" uses the cumulative mean of past relative heights | Gap height at least Minimum gap size × ATR | None described |
| Displacement filter | None described | Middle candle body at least Displacement × ATR | None described |
| When a gap is done | Mitigation level is the lower extremity of a bullish gap, the upper extremity of a bearish one | User picks: full fill, 50% fill, or a close through the far edge | Removed once price fully fills it; can shrink live as price trades in |
| Expiry / cap | Number of unmitigated levels extended is user-set | Max active gaps per side (oldest removed first) and an expiry for unfilled gaps | None described |
| Higher timeframe | Timeframe setting | HTF gaps from completed candles only | MTF option, e.g. 1H gaps on a 5-minute chart |
Two things jump out. First, none of the three agree on detection once you go past the bare three-candle test. Second, they disagree even harder on the end of a gap's life, and that's where published statistics come from.
The size filter decides how many gaps you see
A gap script with no size filter marks every three-candle hole, however small. On BTC/USDT 15-minute bars between 1 September and 15 October 2026, that came to 1,035 gaps, about 23 a day. The median gap was $46 tall against a median 14-bar ATR of $178. We counted 73 gaps under $5 and 135 under $10. Another way to say it: 106 of them were smaller than one-twentieth of the bar's average true range.
On a liquid crypto pair with a tight book that's mostly harmless clutter. Move to a market with a wider bid-ask spread, a thin altcoin or a minor currency cross, and an unfiltered script will draw boxes that are smaller than the cost of crossing the spread once. Nobody can trade those, yet they still count in the script's statistics table.
Turn on a filter and the sample shrinks fast. On the same 45 days:
| Detection rule (BTC/USDT 15m, 1 Sep to 15 Oct 2026) | Gaps found | Share of plain count |
|---|---|---|
| Plain wick-to-wick (TehThomas style) | 1,035 | 100% |
| Plus prior-close confirmation (LuxAlgo, threshold 0%) | 1,035 | 100% |
| Plus LuxAlgo-style auto threshold (above running mean height) | 342 | 33% |
| Plus gap ≥ 0.25 × ATR(14) | 577 | 56% |
| Plus gap ≥ 0.25 × ATR(14) and middle body ≥ 1.0 × ATR(14) | 317 | 31% |
Read that table carefully, because the 0.25 and 1.0 ATR multiples are illustrative values we chose, not the Viprasol defaults, because its description lists the settings without giving default numbers. The auto threshold is our implementation of the LuxAlgo description, not a copy of its code. The point stands either way: depending on the filter, the "same" chart holds anything from 317 to 1,035 gaps. A trader quoting a fill rate from one of these and a trader quoting from another aren't describing the same population.
If you want background on the volatility measure behind these filters, the average true range entry on Wikipedia lays out the formula. We used the simple 14-bar mean of true range.
Three ways to call a gap filled
Here's where the scripts drift furthest apart. For a bullish gap sitting below price, these are the common definitions, from loosest to strictest:
- Touch: any later low trades at or below the top of the gap (the near edge). One tick inside counts.
- 50% fill: a later low reaches the midpoint, which ICT traders call consequent encroachment.
- Full fill: a later low trades through the bottom of the gap (the far edge).
- Close through: a later candle closes below the far edge, not just wicks there.
The Viprasol script lets you pick between full fill, 50% fill and close through. TehThomas removes a gap on a full fill. The LuxAlgo description names the far extremity as the mitigation level but doesn't say whether a wick or a close triggers it, so you'd need to read the code to know. Same gap, same chart: it can be "filled" under one definition and still open under another for hours.
How much the fill rate moves on one chart
We measured this directly: for every gap in the plain set, we tracked forward bar by bar from the candle after it formed and recorded when each definition was first met. Then we did the same for two of the filtered sets. The table shows the share of gaps filled within 20 bars, which is five hours on a 15-minute chart.
| Gap set | Gaps | Touch | 50% fill | Full fill | Close through |
|---|---|---|---|---|---|
| Plain wick-to-wick | 1,035 | 85% | 80% | 77% | 67% |
| Auto threshold (above running mean) | 342 | 80% | 72% | 65% | 53% |
| 0.25 × ATR gap + 1.0 × ATR body | 317 | 84% | 74% | 66% | 56% |
Pick the loosest combination (no filter, touch) and you can say gaps filled 85% of the time. Pick a filtered set and a close-through rule and the same five hours of the same data give you 53%. That's a 32-point spread with no change to the market at all.
The gap is wider over short horizons. Within 4 bars (one hour), the plain set showed 67% touched but only 37% closed through. The auto-threshold set showed 63% touched and 21% closed through. Stretch the horizon the other way, to 20 days, and almost everything fills under every rule: 96% to 99% across all sets in this window. So the tracking horizon is a fifth variable sitting on top of the four rules. A fill rate without a horizon attached tells you very little.
One pattern held in every set: touch was always highest and close through was always lowest. It has to be that way, because a close beyond the far edge is impossible without first touching the near edge, so a touch-based fill rate will always look better. The two numbers aren't comparable, and they get compared constantly in forum threads and indicator descriptions.
Expiry and display caps quietly change the sample
Two settings rarely get mentioned when someone posts a screenshot of a statistics table. The first is expiry. A script that deletes unfilled gaps after a set number of bars is cutting off exactly the gaps that would have dragged its fill rate down. The second is a display cap. When a script keeps only the most recent N gaps per side and drops the oldest first, the chart you're looking at is a recent slice, not the history.
Per the Viprasol description, it does both: a maximum number of active gaps per side and an expiry for unfilled gaps. Neither is wrong. They keep charts readable. But a fill percentage computed on a capped, expiring set isn't the same thing as a fill percentage across every gap the market printed. Our own SMC Toolkit Pro has a max-gaps-per-side setting and a fill-sensitivity setting too, so the same question applies to it: write down what they're set to before you read anything into what's on screen.
Which definition our 500-gap study used
It would be odd for Quantzee to write this page and not hold our own numbers to it. The 500-gap study used this methodology, stated on the page:
- Detection: strict wick-to-wick three-candle rule, 15-minute bars, ES, BTC/USDT and EURUSD.
- Size filter: none at collection time. Size was recorded as a multiple of ATR, not screened out.
- Fill: "any touch" into the gap counted as filled, with a separate full-fill flag.
- Horizon: 20 sessions, with anything still open recorded as unfilled.
That puts the headline numbers firmly in the "touch" column. It reported 84% any-touch and 61% full fill on ES, 76% and 52% on BTC, 88% and 67% on EURUSD. Under a 50% definition, each market's fill rate would land somewhere between its touch and full-fill figures, since the midpoint sits between the near and far edge. Under a close-through definition, it would be at or below the full-fill figure, so no higher than 61% on ES, 52% on BTC and 67% on EURUSD. We haven't re-run that sample under the stricter rules, so those are bounds, not new measurements.
Note too that the BTC count on this page comes from a different period than the original study. The two sets of BTC figures shouldn't be read against each other as if they were one sample.
Higher-timeframe gaps on a lower-timeframe chart
All three scripts let you pull gaps from a higher timeframe onto your trading chart. It's a useful map, but it also creates a quiet category error. A 1-hour gap drawn on a 5-minute chart is a gap the 1-hour candles formed. The 5-minute candles inside that hour may have traded straight through the zone with no three-candle hole of their own. If you then compute a fill rate on the 5-minute chart, you're mixing gaps that chart never produced.
There's a timing catch as well. The Viprasol description is explicit that its HTF gaps come from completed candles only, so a daily gap appears once the daily candle that completes it has closed, and is drawn from that moment rather than back in time. That's the honest way to do it. A script that paints an HTF box back to where it "started" is showing you something you couldn't have seen live. Our guide to testing a TradingView indicator for repainting walks through the replay check that catches this in five minutes.
A four-line checklist before you trust any fair value gap indicator
When we compared these three scripts, the useful output wasn't a ranking. It was a short list of things to write down before believing any number a gap tool shows you. Apply it to any tradingview fair value gap indicator, ours included:
- Detection condition. Plain wick-to-wick, or extra conditions on the middle candle? On a 24/7 chart, check whether those extras do anything at all.
- Size filter. Percent of price, multiple of ATR, displacement on the middle body, or nothing? Find the actual default value, not just the setting name.
- Mitigation rule. Touch, 50%, full fill by wick, or close through? This one setting moved our fill rate by up to 32 points over five hours.
- Expiry and cap. Does the tool delete old or unfilled gaps? Then its statistics describe a trimmed sample.
Write those four lines next to any fill-rate claim. If you can't fill them in, the number can't be checked, and a number that can't be checked isn't a measurement. The engineering view on this is old and well documented: the NIST engineering statistics handbook on measurement process characterization makes the point that a result means little until the procedure that produced it is fixed and stated.
The same habit carries over to other smart-money tools. Order block scripts split along detection lines in much the same way, which is the subject of our comparison of order block indicator detection rules, and our mechanical rule set for marking order blocks shows what a written-down rule looks like in practice.
How we ran the count
Data from the Binance public market-data API: BTC/USDT spot, 15-minute candles, 1 September 2026 00:00 UTC to 13 November 2026 23:45 UTC, 7,104 bars. Gaps were detected only on bars before 16 October 2026 so every gap had at least 20 days of forward data. Bullish and bearish gaps were pooled (558 bullish, 477 bearish). Fill tracking started on the first bar after the gap's third candle. ATR was a simple 14-bar mean of true range. The sample of one instrument over 45 days is small, and crypto trades differently from futures and forex, so treat the counts as a demonstration of how much the rule matters, not as a fill rate to trade on. This is analysis of past bars, not a signal or advice.
Frequently Asked Questions
If you'd rather not juggle three scripts with three rule sets, SMC Toolkit Pro puts gaps, order blocks, structure and liquidity on one chart with its settings in plain view, and the checklist above works on it just as well. For how gaps fit next to the other smart-money concepts, see the ICT framework on one page.