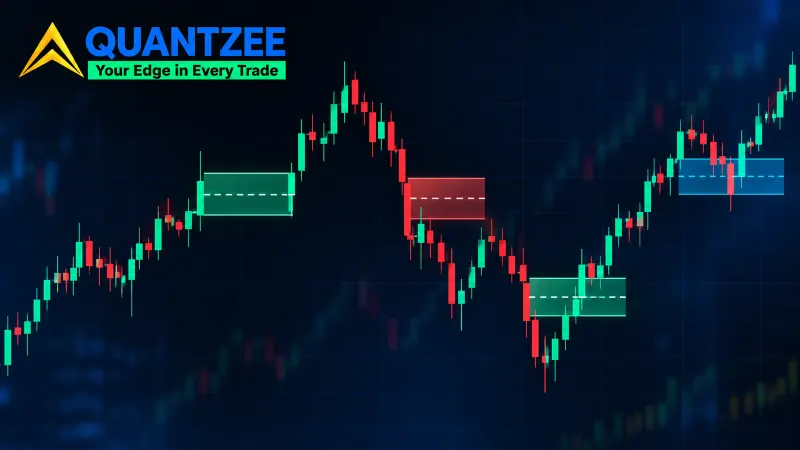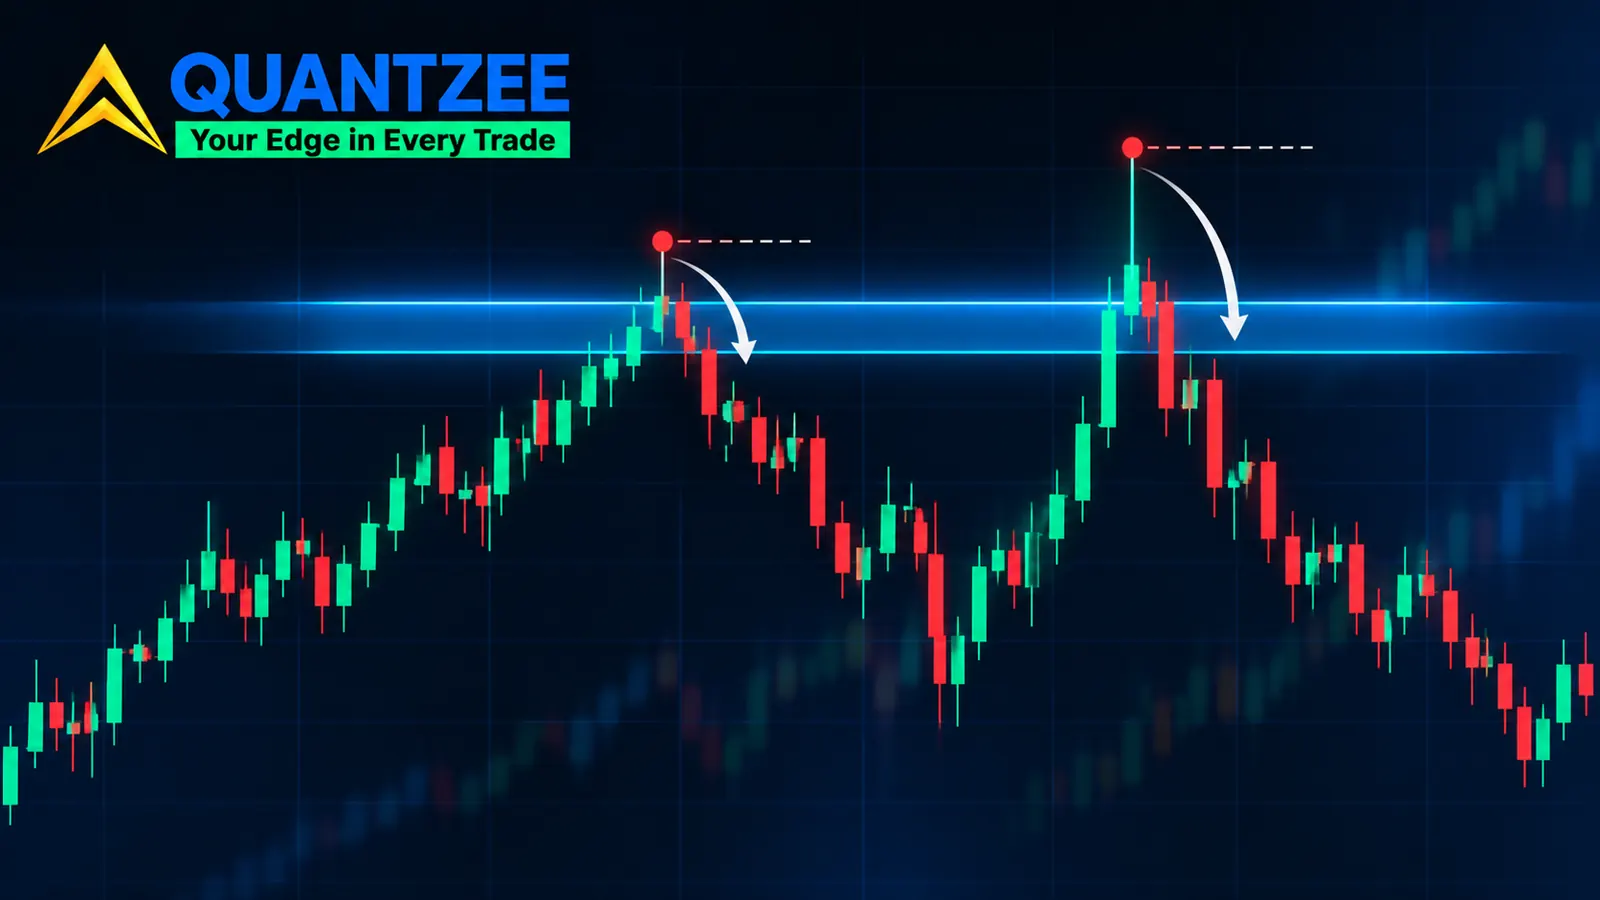
A liquidity grab is a short push through a level where stop orders rest, followed by a fast return inside the range. A liquidity sweep is usually described as the same thing done more slowly and more broadly. A stop hunt is the same event again, named after the people who got stopped out. Three names, one event, and not one of the pages that ranks for these terms gives you a number you could put into a script. So we wrote the numbers down and ran them on 656 real events. The short answer: the "grab vs sweep" label only carries information through one input, how deep price went, and the other two inputs barely matter.
This post sits next to our four-bar test that separates a liquidity sweep from a genuine break. That page answers "is this a sweep or a breakout?" This one answers a narrower question: once you know price went through a level and came back, does calling it a grab rather than a sweep tell you anything about what happens next?
What is a liquidity grab, and why does it have three names?
Read the three pages that rank on the first screen for "liquidity grab" and you'll find the same chart described three ways. The vocabulary splits along what each writer is looking at:
- Sweep names the action. Price sweeps through a cluster of highs or lows.
- Grab names the intent. Someone large "grabs" the resting orders to fill a position.
- Stop hunt names the victims. The orders that got filled were other traders' stops.
The most honest of the three competitor pages, from Orderflow Labs, says this outright: the three terms describe the same mechanic from different angles. Credit where it's due. The ATAS article goes further and does draw a line, by how long price spends inside the zone, and it backs that with four annotated footprint charts on currencies, crypto and gold. The Zeiierman page uses a comparison table and assigns each term to different timeframes. None of the three gives a threshold. "Minimal and fast" versus "broad and methodical" is a description, not a rule.
The resting orders themselves are not mysterious. A stop order, per the SEC's investor.gov glossary, becomes a market order once a set price is reached. Hundreds of those parked just beyond an obvious high turn into a burst of market buying the moment price touches them. That burst is the liquidity everyone is talking about. What's disputed is only how to label the move that fills it.
Why intent can't be read off a chart
Most explanations define a grab by purpose: a large player pushes price into the stops in order to fill a position. That's the root of the problem. Purpose leaves no mark on a candlestick. Two moves with identical bars can come from a fund deliberately reaching for stops, from a news headline, or from an algorithm that simply ran out of offers. You can't tell them apart from price alone, and you can't tell them apart from most order-flow data either.
Any definition that depends on intent will be argued about forever, because nobody can settle the argument with the chart in front of them. That's why traders keep using the three words interchangeably. It isn't sloppiness. It's the correct response to a distinction nobody has made measurable.
The fix is to drop intent entirely and keep only what a chart records.
Three measurable inputs that replace the adjectives
Every penetration of a level can be described by three numbers. All three can be computed by a script on the bar that closes back inside, so there's no hindsight in them.
1. Penetration depth, in ATR
How far price traded beyond the level before it closed back inside, divided by the 14-bar average true range measured on the bar before the event. Using ATR instead of points or percent means a $400 overshoot on bitcoin and a $9 overshoot on ether can be compared on one scale. A depth of 0.2 means price poked one-fifth of a normal bar beyond the level. A depth of 2.0 means it travelled two full bars' worth.
2. Bars closed beyond the level
The count of consecutive bars that closed beyond the level before the first close back inside. A pure wick through the level scores 0. A bar that closes outside and is reversed on the next one scores 1. This is the closest thing to the "duration in the zone" idea in the ATAS article, turned into an integer.
3. Levels taken in one move
How many distinct prior swing points lay between the reference level and the extreme of the move. We count the reference level itself as 1, then add every 3-bar swing high (or low) from the previous 72 bars that sat beyond the level and was taken out. A move that clears the prior-day high and nothing else scores 1. One that also clears two older swing highs above it scores 3. This is the "broad" in "broad and methodical".
The classification rule, with the thresholds named
Here's the rule we applied. It's written so a reader or a script gets the same answer every time.
- Grab: price closed back inside within 6 bars, depth ≤ 0.5 ATR, at most 1 bar closed beyond, and only 1 level taken.
- Sweep: price closed back inside within 6 bars, and at least one of those three limits was exceeded (depth above 0.5 ATR, 2 or more closes beyond, or 2 or more levels taken).
- Break: price did not close back inside within 6 bars. Neither a grab nor a sweep.
The thresholds are choices, not discoveries. A 0.5 ATR depth limit, a 1-bar close limit and a single-level limit are the most literal reading we could make of "minimal and fast". You can move them. The point is that once they're written down, you can test whether they mean anything.
How we tested it: methodology and sample
The test setup was deliberately plain, so anyone can repeat it.
Instruments and data. BTCUSDT and ETHUSDT, 1-hour bars, Binance spot, data from the exchange's public kline endpoint. Crypto trades 24 hours a day, so a "prior day" has no session gaps to argue about.
Date range. 1 November 2025 to 31 October 2026, UTC. Twelve months.
Reference level. The previous UTC day's high and low. We used one level type on purpose (more on why below). For each day and each side, the event is the first hourly bar that trades beyond the prior-day extreme. Days that opened already beyond the level were skipped.
Forward outcome. Measured from the bar that closed back inside, over the next 24 bars (one day). Two things can happen first. Either price travels 1 ATR back inside, past the level, or it trades beyond the event's extreme. We recorded which came first and how many bars it took.
Sample. 656 events across 586 instrument-days: 187 grabs, 314 sweeps and 155 breaks. Grabs split evenly, 92 at highs and 95 at lows, and sweeps 159 to 155, so neither side dominates.
One caveat goes on the record before the results. The outcome is measured from the level, while failure is measured from the event's extreme. A deeper event leaves more room between those two points, which helps it. We come back to what that does to the reading.
What happened next: grab vs sweep on 501 returned events
| Class | Events | Reached 1 ATR inside first | Made a new extreme first |
|---|---|---|---|
| Grab | 187 | 100 (53%) | 87 (47%) |
| Sweep | 314 | 204 (65%) | 108 (34%) |
| Break | 155 | 95 (61%) held beyond the level for the next 24 bars | |
So the classes do differ, by 12 percentage points. But not in the direction the folklore predicts. "Grab" is usually sold as the sharp, clean reversal. In our data the grab was close to a coin flip: 53% reached 1 ATR inside before making a new extreme, and 47% went on to take out the extreme. The deeper, messier "sweep" did better.
Both coins showed the same direction. On BTCUSDT, grabs reached the target first 49% of the time against 69% for sweeps. On ETHUSDT it was 57% against 61%, a much thinner gap. When the gap between two classes shrinks from 20 points to 4 just by changing the coin, treat it with caution.
Timing didn't separate them either. When the target was reached, the median was 1 bar for both classes. The mean was 1.4 bars for grabs and 1.8 for sweeps. Either the move back inside happens almost at once, or it doesn't happen.
Which of the three inputs actually did the work?
This is where the test earns its keep. A sweep can qualify through any of three doors, so we split the sweeps by which rule they tripped:
| Sweep qualified by | Events | Reached 1 ATR inside first |
|---|---|---|
| Depth above 0.5 ATR | 272 | 71% |
| 2+ bars closed beyond | 90 | 72% |
| 2+ levels taken | 154 | 57% |
| Levels only (shallow, quick, but took 2+ levels) | 40 | 28% |
Depth is doing almost all the work. Of the 314 sweeps, 272 qualified through depth. The bars-beyond input mostly overlaps with depth: a move that closes outside for two bars has usually also gone deep. And the "levels taken" input, the one that captures "broad", points the wrong way when it acts alone. The 40 events that were shallow and quick but cleared two or more swing points reached the target only 11 times. They're better described as small breakouts that hadn't finished yet.
Cut by depth alone, the picture is cleaner still:
| Depth beyond level | Events | Reached 1 ATR inside first | New extreme first |
|---|---|---|---|
| 0 to 0.25 ATR | 127 | 54% | 46% |
| 0.25 to 0.5 ATR | 102 | 43% | 57% |
| 0.5 to 1 ATR | 127 | 65% | 35% |
| 1 to 2 ATR | 101 | 76% | 23% |
| Above 2 ATR | 44 | 75% | 23% |
The median grab went 0.19 ATR past the level. The median sweep went 0.91 ATR. The breaks, by contrast, had a median depth of 3.3 ATR at the point we stopped watching. So depth is a single spectrum: shallow pokes are noisy, middling overshoots that come back are the cleanest reversals, and very deep moves mostly don't come back at all.
Now the caveat from the methodology. Part of the depth effect is mechanical. An event that went 1.5 ATR past the level needs to travel 2.5 ATR to make a new extreme and only 1 ATR plus the overshoot to reach the target. A 0.1 ATR poke has far less room. So "deeper sweeps reverse more" is partly built into how we measured it. What the measurement can't explain away is the 0.25 to 0.5 ATR band doing worse than the 0 to 0.25 band, and the levels-only group failing 72% of the time. Those are behaviours, not geometry.
The honest verdict: one word, graded by depth
Put plainly: the grab/sweep split exists in this sample, but it's a depth split wearing a vocabulary costume. The "fast" and "broad" parts of the definition add little or point the wrong way. If you strip them out and keep depth, you lose nothing.
That leads to a practical recommendation. Use one word, any of the three. Stop arguing about which one applies. Then grade the event by how far price went past the level in ATR, and treat the shallow end (under 0.5 ATR) as the low-information zone it appears to be. When we compared this with the order-block work on our order-block rule-set page, the lesson was the same: one measurable input usually beats three descriptive ones.
The limits of this test are real. It's two crypto pairs, one bar size, one year and one level type. It says nothing yet about ES futures, EUR/USD or 5-minute bars, and a 4-point gap on ETH is too thin to build on. We'd treat these numbers as a direction for your own testing, not as a rule that holds everywhere.
Where the reference level comes from changes everything
Every one of these rules starts from a level, and the choice of level moves the classification more than any threshold does. We used the prior-day high and low because they're unambiguous. Two people marking the same chart will get the same number. The usual alternatives each add their own noise:
Equal highs or equal lows. Two or more swing points within a tolerance band. The tolerance is itself a choice, and widening it from 0.05% to 0.1% of price can turn one level into two, which changes the "levels taken" count on the same move.
Session extremes. The Asian, London or New York session high and low. Useful on currencies and index futures, but the session boundaries differ by source and by daylight-saving shifts.
Prior-day or prior-week range. Stable and easy to automate. It misses intraday swing clusters that many traders actually stop behind.
Switch from prior-day highs to equal highs and the same bar can go from "grab, 1 level, 0.3 ATR" to "sweep, 3 levels, 1.1 ATR", because the reference sits lower and more swings lie beyond it. In our experience this is where most chart arguments really start. Two traders agree on the candle and disagree on the line. Fix the line first, and write down how you chose it.
Order-flow confirmation, and where it's even possible
Footprint and delta data can show what the bars can't: a burst of aggressive buying exactly at the level, absorbed by passive sellers, then a fast flip in delta. That's the closest you'll get to seeing stops actually being filled, and it's the strongest part of the ATAS write-up. Our guide to footprint charts and bid/ask volume covers how to read those cells.
The catch is market structure. Footprint data is reliable on centralised exchange-traded futures, where every trade prints to one tape. CME index futures, treasury futures and crude are the clean cases. The CFTC glossary is a good reference for how those contracts and their order types are defined.
- Spot forex has no central tape. Any footprint you see is one broker's or one venue's flow, so delta at a level is partial at best.
- Crypto is split across dozens of venues. A footprint on one exchange shows that exchange's stops, not the market's.
- Single stocks trade across many venues and dark pools. The consolidated tape helps, but trade-side classification is an estimate.
So the order-flow step is a real confirmation on CME-style futures and a weak hint elsewhere. On our BTC and ETH sample, from one venue's spot data, we didn't use it at all. The depth reading had to stand on price alone.
A repeatable checklist for your own chart
If you want to run this yourself, here's the whole procedure in six steps:
- Pick one level type and write down the rule for it before you look at outcomes.
- Compute ATR(14) on your bar size, using the bar before the event.
- When price trades beyond the level, record the furthest point reached before the first close back inside.
- Express that overshoot in ATR. That's your grade.
- Log the forward outcome over a fixed window, the same way every time.
- After 100+ events, compare outcomes by depth band. Ignore the label.
Our team kept the event file and script for this study, so the numbers above can be re-run on a new year or a new instrument without changing the rules. If the bands shift on your market, believe your data over ours.
For the step before any of this, deciding whether price swept a level or genuinely broke it, go back to the four-bar sweep anatomy. This page only begins once price has already come back inside.