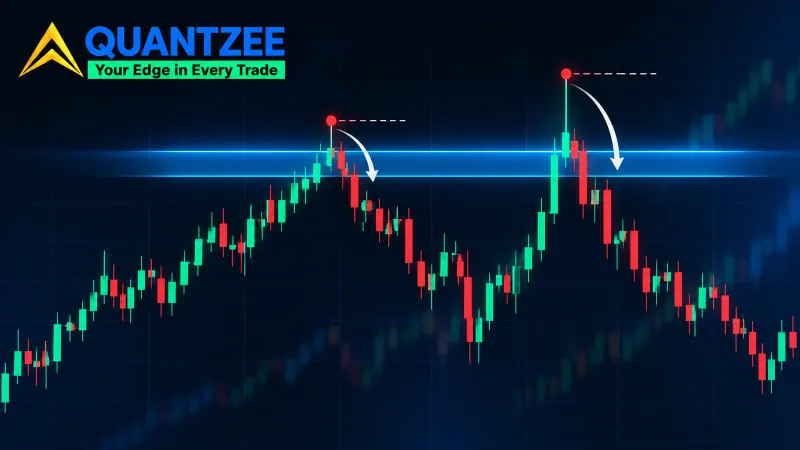
Turtle soup ICT is a false-breakout entry. Price takes out a prior swing high or low, fails to hold beyond it, and you enter on the reclaim. That is the whole idea. What no published version tells you is where "took out" ends and "broke" begins: how far past the level price has to go, and how many bars it may spend out there before the reversal stops counting. Without those two numbers you can't code the setup, and you can't count it either. This post supplies both as parameters you fix in advance, plus a third for entry depth, and shows how to measure your own base rate instead of borrowing someone else's percentage.
What turtle soup is, and where the name comes from
The name is a joke with a real target. In the early 1980s the trader Richard Dennis taught a group of recruits, nicknamed the Turtles, a simple trend-following system: buy when price rises above its recent range, sell when it falls below. According to Wikipedia's account of Richard Dennis, the recruits were trained for two weeks in December 1983 and December 1984 and traded commodities, currencies and bond markets on those breakout rules. A "turtle soup" trade does the opposite. It waits for the range breakout the Turtles would have bought, sees it fail, and trades the other way.
ICT teaching borrowed the idea and relabelled it. Where the older version fades a 20-day extreme, the ICT version fades a swing high or low that sits on a chart's own timeframe, and calls the failed push a sweep of buy-side or sell-side liquidity. Same event, newer vocabulary.
Why the published versions can't be tested
We compared the three pages that rank for this keyword and are not course-sales funnels: an indicator vendor's explainer of about 1,200 words, a replay-tool vendor's strategy card of about 2,100 words, and an independent education community's write-up of about 1,200 words dated July 2024. All three lean on annotated diagrams. None gives a penetration depth. None limits how long price may stay beyond the level. None reports a failure rate or states the market regime where the setup stops working. The replay vendor says as much about itself: it offers no bar-count rule and no failure rate, which is honest, and also an admission that the setup as published can't be backtested.
A fourth page, a broker blog, is the only one on page one carrying percentages: a 65% success rate attributed to a magazine, a 30% claim attributed to a journal, a 72% usage figure attributed to a forum survey. None of them names an issue, a date, a sample or a method. We aren't repeating them here. A number with no sample size, no period and no method isn't a finding, however widely it circulates.
Limit one: penetration depth
A sweep has to take enough out of the market to matter. If price pokes one tick past the prior high, few stops were touched and the "failure" tells you almost nothing. If price runs far beyond it, the move is probably a real break.
Measure depth in volatility units, not points. Take the average true range (ATR) on the chart's own timeframe, say the 14-bar ATR, and express penetration as a fraction of it. A 12-point push means one thing on a chart where ATR is 8 and something else where ATR is 60. Points can't travel between instruments or timeframes. ATR fractions can.
A workable framing is a band with two edges:
- Minimum: the high or low must exceed the level by at least some fraction of ATR, for example 0.1. Below it, the push doesn't count as a sweep at all.
- Maximum: the push must stay within some larger multiple, for example 1.0 ATR. Beyond it, you are looking at a break.
Those two figures, 0.1 and 1.0, are placeholders to test, not findings. The point is that both edges exist and are written down before you look at outcomes. Pick them first, then count.
Limit two: the bar-count deadline
The reclaim has to happen within a fixed number of bars. If price closes back inside the old range within N bars, it was a failure of the break. If it takes longer, it was a break that eventually retraced, which happens after almost any move given enough time.
This is the same clock we already published for the swing failure pattern. Our swing failure pattern page frames the deadline as a number you choose and keep fixed, commonly somewhere between 1 and 5 bars intraday and 5 to 8 on daily charts, and notes that beyond roughly 8 to 10 bars the setup stops measuring a fast rejection. Turtle soup uses the identical deadline. We aren't going to re-derive it here, and it would be dishonest to pretend it's a new idea.
What you do need is to pick N before you look. A 3-bar deadline on a 15-minute chart gives price 45 minutes to reclaim. The same 3 bars on a daily chart gives it 3 trading days. Those aren't the same bet, so state the timeframe next to the number.
Limit three: entry depth
Once price is back inside the range, how far in can you still be taking the same trade? Enter on the first close back inside and you're in near the level, with a stop just beyond the sweep. Enter after price has retraced half the range and you've changed the trade: smaller reward, and an entry that now depends on a different event.
Fix a maximum entry depth as a fraction of the prior range, for example 0.25 of the way in. Past that line the setup is something else, and it goes in a different column when you count. Keeping these separate is the only way the numbers stay interpretable later.
The level has to be one stops actually sit behind
A sweep needs something to sweep. Orders cluster behind levels that traders watch: an untested session high, a prior day's extreme, an equal-highs pair that several people have marked. Our guide to buy-side versus sell-side liquidity walks through ranking those pools before the session.
A swing nobody was leaning on can't be swept. A minor pullback high inside a trend gets exceeded constantly and means nothing. If your level definition lets in every 3-bar pivot, you will count hundreds of "turtle soups" that were just noise. Put the definition in writing: how old the level is, how many times it was touched, whether it is a session or daily extreme.
Is turtle soup different from a sweep, an SFP, or a failed breakout?
On most charts, no. It is one event with three vocabularies. A liquidity sweep, a swing failure pattern and a turtle soup all describe price pushing past a prior extreme and coming back. The differences are in what each name asks you to check.
- Our four-bar liquidity sweep test grades the sequence in stages: the level, the penetration, the rejection close and the displacement after it. It is the fullest of the three, and this post doesn't repeat it.
- The swing failure pattern adds the deadline: a sweep with a clock.
- A plain failed breakout has neither a depth limit nor a clock, so nearly every breakout qualifies if you wait long enough.
- Turtle soup, as published, is the failed breakout with a better story. Add the three limits above and it becomes the SFP with a depth band.
If you have already read the sweep and SFP pages, you have the mechanics. This page's contribution is the depth band and the entry limit. For where this sits among the rest of the vocabulary, see the one-page map of the ICT trading strategy. For a broader audit of which ideas hold up once written as rules, see our Smart Money Concepts rule test, and for a neighbouring story that turns out to depend on hindsight, the Judas swing.
What invalidates the setup
Most write-ups tell you what confirms a turtle soup. A rule you can code needs the reverse: the conditions that cancel it.
- A close beyond the level. One bar that closes outside the old range and stays counts as a break, whatever the wick did.
- A second, deeper penetration. If price pushes out again and goes further than the first sweep, the first was not the failure. Void it.
- A late reclaim. Back inside on bar N+1 is not back inside within N bars. The deadline is binary, and bending it once is how a rule turns into a feeling.
Write these as the first lines of your spec, ahead of the entry condition.
How to measure your own base rate
This is the only legitimate route to a percentage on this page. The recipe is short.
- Choose one instrument and one timeframe, for example a single index future on 15-minute bars.
- State a date range, for example the 12 months ending last month, and don't change it after seeing results.
- Fix the level definition, the penetration band, the deadline N and the entry depth before you start.
- Scan the chart and list every event that meets the definition. Count the reclaims that held and the ones that failed, where "held" has its own fixed test, such as price still inside the range 20 bars later.
- Report the counts, not just the ratio. 14 of 30 and 140 of 300 are both 47%, and only one of them tells you much.
Run it twice, once with N = 3 and once with N = 5, and you will see how sensitive the result is to the single choice the published pages leave open. That sensitivity is the real finding, and it is yours.
A caution on method: counting events by eye after the fact invites hindsight. Mark them with code, or with rules written down before you scroll the chart. Per the Federal Reserve Bank of New York's research pages, price formation is studied through order flow and liquidity over many transactions, which is a reminder that a single wick on a chart is a thin basis for a claim.
Where stops sit, and why that matters to the trade
The whole logic of turtle soup rests on stops resting behind an obvious level. A protective stop is an order that becomes a market order once price reaches a set level, a mechanism the SEC's investor education site describes in its glossary entry on stop orders. That is also why the trade is dangerous to take blind: the same mechanism that creates the sweep can carry price much further than your depth band allows. Define the maximum penetration and respect it, because a stop-run that doesn't stop is the break you were trying to filter out.
A note on methodology
Our team read the three ranking pages named above in full, and the claims about them are limited to what their own pages state. We haven't measured a base rate for turtle soup, so none appears here. The closest evidence we own is our own four-bar sweep test and our fair-value-gap fill study, both linked above, and nothing in this post should be read as a result for this setup. The figures 0.1, 1.0, 0.25, 3 and 5 are example parameters. Quantzee is analytical software, not advice, and nothing here predicts a future trade.
If you want the sweep and the level definitions marked automatically while you work through the counts, SMC Toolkit Pro on TradingView marks swept levels as bars close. Fixing the three limits is still your job.