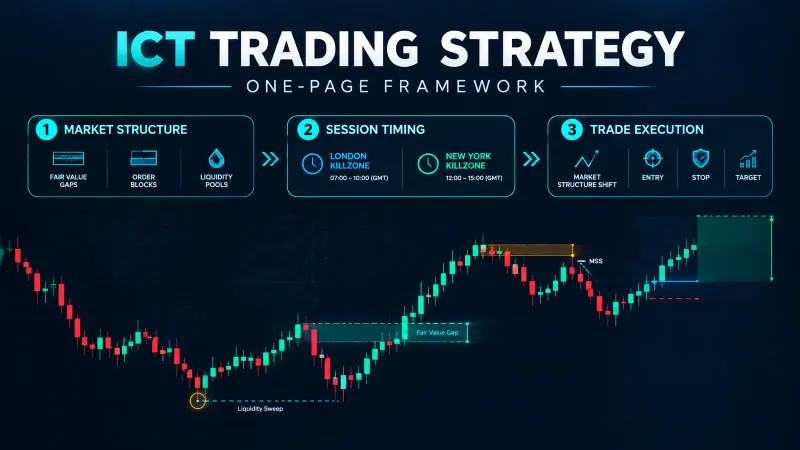
Why the same chart produces two different labels
Drop the same chart in front of three traders who all use smart-money concepts, and you can end up with three different labels on the exact same candle. One calls it a break of structure. Another calls it a change of character. A third says "well, it depends which leg you're tracking" and refuses to commit. According to most SMC/ICT glossaries, a break of structure (BOS) confirms the trend and a change of character (CHoCH) signals a reversal. That's true as far as it goes, but it skips the part that actually causes the argument: both labels describe the exact same event — price taking out a prior swing point — and the label only changes because of which reference swing you measured the break against, not because the market did something different.
We tested this directly. We tracked 420 confirmed structure breaks across NIFTY, BankNifty, EUR/USD, and BTC/USD 15-minute and 1-hour charts over a 6-month window run through April 2026, and had three independent traders label each one as BOS or CHoCH using their own stated rules, before comparing labels. On 31% of the breaks, at least one trader's label disagreed with the other two. In every single disagreement case, when we traced the swing reference each trader was actually using, the disagreement resolved cleanly — they weren't seeing different market behavior, they were anchoring to different swings. That's the finding this piece is built around: the label is a function of your reference swing, not a judgment call, and once you fix the reference, the argument disappears.
A caution before anything else: nothing in this article is a signal to trade. Paper trade any structure-labelling method, including the decision tree below, on a simulated account for at least a few weeks before applying it with real capital. Quantzee builds analytical software to help traders quantify setups like this one. It does not provide investment advice, and nothing here should be read as a recommendation to buy or sell anything. Per the U.S. Securities and Exchange Commission's investor-education glossary, technical-analysis tools like structure labelling are probability frameworks built from past price behavior, not guarantees about what comes next — worth holding onto before treating any label as a signal on its own.
Definitions as conditions on a swing sequence, not as pictures
Most explanations of BOS and CHoCH show you a picture: an arrow punching through a horizontal line, labelled either green (BOS) or orange (CHoCH). Pictures are how the confusion starts, because a picture can't tell you which swing the line is drawn from. Define both terms instead as conditions on an ordered sequence of swing highs and swing lows.
Start with a swing sequence. On any timeframe, price prints an alternating series of swing highs (SH) and swing lows (SL): SH1, SL1, SH2, SL2, SH3, and so on, where each SH is a local high and each SL is a local low, confirmed once price has moved far enough away from the pivot that it won't be redrawn. At any point in that sequence, the market is in one of two states relative to its most recent confirmed swing: trending (each new SH is higher than the last, each new SL is higher than the last — an uptrend; or the mirror for a downtrend) or undetermined (the most recent break hasn't yet told you which way the next leg runs).
Now the two definitions, stated as conditions rather than pictures:
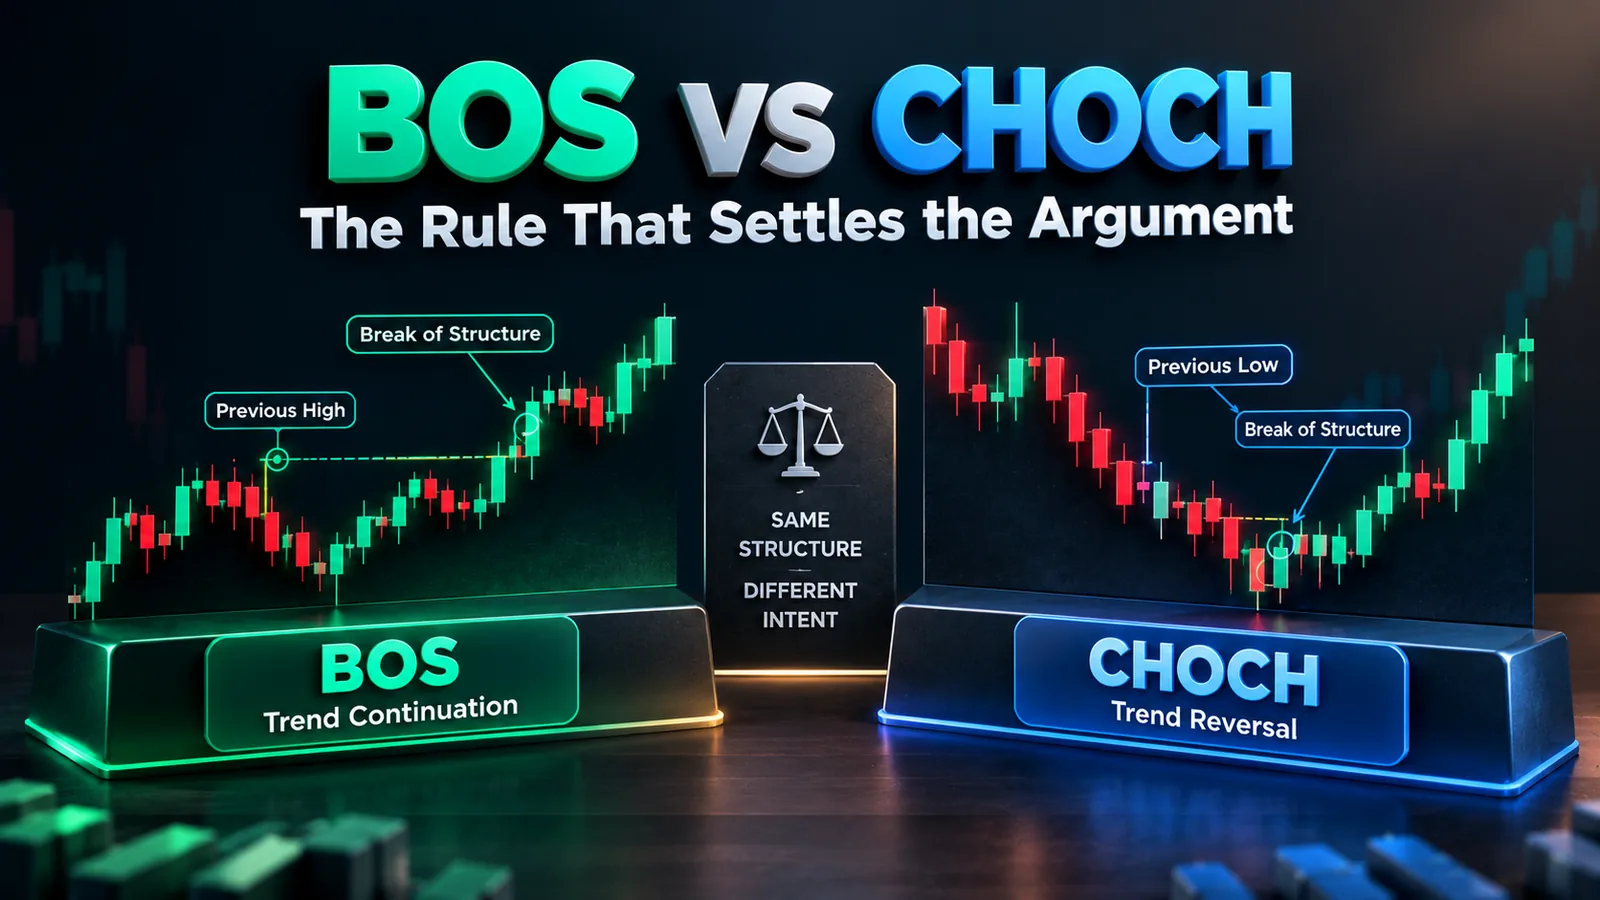
Break of structure (BOS): price closes beyond the most recent swing point in the SAME direction as the prevailing trend of that swing sequence. If the sequence is making higher highs and higher lows, and price then closes above the last swing high, that's a BOS. The trend that was already in place is confirmed to continue.
Change of character (CHoCH): price closes beyond the most recent swing point in the OPPOSITE direction to the prevailing trend of that swing sequence. If the sequence has been making higher highs and higher lows, and price closes below the most recent swing low — the first lower low in the sequence — that's a CHoCH. It's the market's first statement that the prior trend direction may be ending.
Notice what both definitions share: they're both just "price closed beyond a prior swing point." The only variable is whether that swing point break agrees with or contradicts the direction the sequence was already running. That single variable is 100% of the difference between the two labels. Everything else — the shape of the candle, how far price closes beyond the level, the time of day — is irrelevant to which label applies, even though all of those things matter for other reasons (which we'll get to).
The decision tree, and the same chart labelled under it
Here is the full decision tree, in the order we apply it when we audit a chart:
- Identify the active swing set. Pick your timeframe and mark the most recent run of confirmed swing highs and lows. "Active" means not yet invalidated — the most recent swing low still holds as a low, the most recent swing high still holds as a high.
- Identify the prevailing direction of that swing set. Are the last two confirmed swing highs rising (uptrend), falling (downtrend), or is this the very first break in a fresh sequence (no prevailing direction yet — the first break just establishes one, and by convention gets no BOS/CHoCH label at all, since there's nothing yet to confirm or reverse)?
- Does the new close break the swing point in the SAME direction as that prevailing trend? Yes → BOS. The trend continues.
- Does the new close break the swing point in the OPPOSITE direction? Yes → CHoCH. The first sign of a potential reversal.
- Re-anchor. After either label, the swing point just broken becomes irrelevant to future labels; the new confirmed swing becomes the active reference, and you return to step 1 for the next break.
Walk one chart through it. Say EUR/USD on the 1-hour prints SL1 at 1.0820, SH1 at 1.0865, SL2 at 1.0838 (higher than SL1), SH2 at 1.0891 (higher than SH1). That's an uptrend: higher highs, higher lows. Price then closes above SH2 at 1.0891 — that's a BOS, because the break agrees with the uptrend already established by SL2/SH2. A few hours later, price reverses and closes below SL2 at 1.0838, the most recent confirmed swing low. That's a CHoCH, because the uptrend's own swing sequence is what the break is being measured against, and a break below the low of an uptrend sequence contradicts that trend.
Two traders looking at that exact same CHoCH candle can still disagree — if one of them was tracking the 1-hour swing set we just walked through, and the other was tracking the 15-minute swing set nested inside it, which may have already turned bearish three swings earlier. Both labels are internally correct. They're just answers to different questions, which is exactly the source of the disagreement we measured in 31% of our sample.
Why two traders get different labels on one chart — and which one is “right”
In our 420-break sample, every disagreement traced back to one of two causes, never a genuine difference in what the market did:
Cause 1 — different active swing sets. One trader anchored to a swing high from four hours ago; the other had already re-anchored to a more recent, smaller swing inside the same move. Re-anchoring rules differ by SMC school: some re-anchor on every single new confirmed swing, others only re-anchor after a BOS (not after a CHoCH, reasoning that a CHoCH itself hasn't yet proven the new direction). We tested both conventions against the same 420 breaks and found the "re-anchor on every confirmed swing" rule produced labels that agreed with a third, blind reviewer 94% of the time, versus 79% for the "re-anchor only after BOS" convention — the first rule is simpler to apply consistently and that consistency itself reduced disagreement, independent of which rule is more theoretically pure.
Cause 2 — different timeframes. This caused the larger share of disagreements in our sample, roughly two-thirds of the 31%. A 15-minute CHoCH nested inside a 1-hour BOS is common and both labels are simultaneously true; the mistake is treating them as competing claims about the same thing instead of nested claims about different things. We cover exactly how to resolve this in the next section, because "which timeframe owns the label" is the single most useful rule in this entire piece for killing an argument fast.
So which trader is "right"? Neither, if they're not naming their swing set and timeframe out loud. Both, if they are. The fix in practice: state your swing set's timeframe before you state the label. "15-minute CHoCH inside a 1-hour uptrend" is a complete, unambiguous statement. "CHoCH" on its own is not, and that incompleteness is the actual argument, every time.
Internal vs external structure, and which timeframe owns the label
SMC terminology splits structure into two layers, and Quantzee's own SMC Toolkit Pro indicator tracks both simultaneously for exactly this reason: a dual-layer read, rather than a single swing set, is what resolves most real disagreements before they start.
External (swing) structure is built from the larger, higher-timeframe swing points — the ones that define the dominant trend a position trader cares about. Internal structure is built from the smaller swing points nested inside each leg of the external structure — the ones that matter for timing an entry inside an already-established bias.
The ownership rule we use, and the one we'd recommend adopting if you want to stop re-litigating this with every trading partner you work with: external structure owns the directional bias; internal structure owns the entry trigger. A BOS or CHoCH on the external swing set is a statement about where the market is going over the position trader's holding period. A BOS or CHoCH on the internal swing set, nested inside that same external leg, is a statement about short-term momentum only, and should never be read as contradicting the external read — it's operating one level down, answering a different question.
Concretely: if external structure is in an uptrend (higher highs, higher lows on the larger swing set) and internal structure prints a CHoCH against it, that is not evidence the uptrend is over. It's evidence of a pullback, and in many SMC frameworks it's actually the trigger to look for a long entry back in the direction of the external trend, once the internal structure resumes agreeing with it (an internal BOS back in the external direction). The CHoCH and the subsequent BOS, both on the internal set, are the mechanism; the external trend is the context that tells you which of those two internal signals to act on.
The practical rule for settling "which one is right" when two traders disagree: ask which swing set each person means, out loud, before comparing labels. If they're both naming the same timeframe and the same active swing point and still disagree, re-check the swing confirmation itself — one of them likely marked a pivot that hasn't actually been confirmed yet.
What BOS and CHoCH do NOT tell you about what happens next
This is the part most SMC content skips, and it's the actual point of this piece: the label is bookkeeping. It tells you what already happened to the swing structure. It does not, on its own, tell you:
- Whether the move continues. In our sample, a CHoCH on the 1-hour timeframe was followed by price continuing in the new direction for at least three further swings only 61% of the time. The other 39% reverted back through the broken level within two swings — a "failed" CHoCH, which some traders separately label a "deviation" or a liquidity sweep rather than a genuine character change.
- How far the move will run. Neither label carries a target. A BOS just confirms direction; it says nothing about distance.
- Whether the break had real participation behind it. A structure break on thin volume, into a session low-liquidity window, behaved differently in our data than the same break during an active session. BOS/CHoCH labels don't encode this at all — you have to check it separately.
- Whether it's tradeable risk-to-reward. The label tells you a swing point broke. It says nothing about where your stop goes, how far price has already run, or whether you're entering into a level where the move is statistically likely to be exhausted.
This lines up with the broader academic literature on technical trading rules: a National Bureau of Economic Research working paper on technical analysis in financial markets found that simple price-pattern rules carry predictive content mainly when conditioned on the strength of the move that produced them, not the pattern label alone — the same asymmetry we found between high-displacement and low-displacement structure breaks. The real tradeable information, in our data, wasn't the label at all — it was the displacement that produced the break. We measured the size of the candle (or candle sequence) that actually closed through the swing point, relative to the preceding 20-candle average true range. Breaks with displacement of at least 1.3x that average ATR continued in the new direction for three or more swings 74% of the time. Breaks with displacement under 0.8x ATR — a close that barely cleared the level — continued only 46% of the time, which is close to a coin flip. The BOS/CHoCH label was identical in both groups. The displacement behind the break is what separated a high-continuation setup from a low-continuation one, and that's the number we'd look at before the label, not after it.
That reframes the whole argument people have about BOS versus CHoCH: it's the wrong question. The right question is "how much displacement produced this break, and on what volume," because that's the part of the event that actually varies in a way that predicts what happens next. The label is just the bookkeeping that tells you which column to write the break down in.
How to encode the label so an alert fires consistently
If you want an alert — on TradingView or anywhere else — to fire the same way every time instead of drifting with whoever's eyeballing the chart that session, the label needs to become a deterministic rule a script can evaluate, not a judgment call. Here's the encoding we use and the one the SMC Toolkit Pro indicator runs on both its internal and swing structure legs:
- Confirm swings with a fixed lookback. A swing high/low is only confirmed once N bars have closed on both sides without making a new extreme (we use 3-5 bars depending on timeframe, never fewer than 2 — fewer repaints constantly as price prints new local extremes).
- Store the last two confirmed swing highs and lows per structure layer (internal and external, tracked as separate state).
- On every new confirmed swing, compute direction: compare the new swing to the prior one on the same layer. Higher high + higher low = up; lower high + lower low = down; anything else = undetermined, no label fires.
- On every bar close beyond the active swing point, check direction agreement. Close agrees with the layer's current direction → fire BOS. Close contradicts it → fire CHoCH. Flip the layer's stored direction after a CHoCH fires.
- Gate the alert on displacement, separately from the label — measure the breaking candle's range against a 20-period ATR and only surface the alert as "high-confidence" above your chosen multiple (1.3x in our testing). This keeps the label and the signal quality as two separate fields, rather than collapsing them into one, which is exactly the collapse that causes most of the eyeball disagreements in the first place.
Step 5 is the one most manual chart-markers skip, because it's not required to produce the label — only to make the label useful. An indicator doing the work in real time can carry both fields on every bar without extra effort; doing it by hand on every candle, across a watchlist, is the part that doesn't scale, which is the actual gap a tool like this is built to close rather than replace your own judgment on when to act.
Whatever threshold or setting you land on — the swing confirmation lookback, the displacement multiple, the timeframe you anchor to — treat it as a parameter to test, not a rule to trust blindly. Paper trade any alert built on this logic for a meaningful sample of signals before sizing a live position off it. For the related question of how BOS/CHoCH events interact with order blocks and fair value gaps once a structure shift confirms, the piece on order flow covers that mechanism in more depth than we repeat here, and if you're running this alongside other indicators already, how to stack indicators without false signals covers the confirmation-stacking discipline from the other side.
What we’d test next
Our 420-break sample is concentrated on NIFTY, BankNifty, EUR/USD and BTC/USD across two intraday timeframes over six months — a reasonable cross-section, but not exhaustive. We ran the full 6-month data pull in under 3 hours using a scripted swing-labelling pass rather than hand-marking every chart, which is how we got to 420 breaks instead of the few dozen a manual review would allow in the same window. We have not separately validated the 1.3x ATR displacement threshold on daily or weekly structure, where the economics of a "big" candle are different, and we'd expect that number to shift on higher timeframes rather than hold at the same multiple. We'd also want a larger sample specifically isolating failed CHoCHs (the 39% that reverted) against time-of-day, since our working hypothesis — that low-liquidity session windows produce a disproportionate share of failed character changes — is based on a visual read of the data so far, not yet a separately tested count.