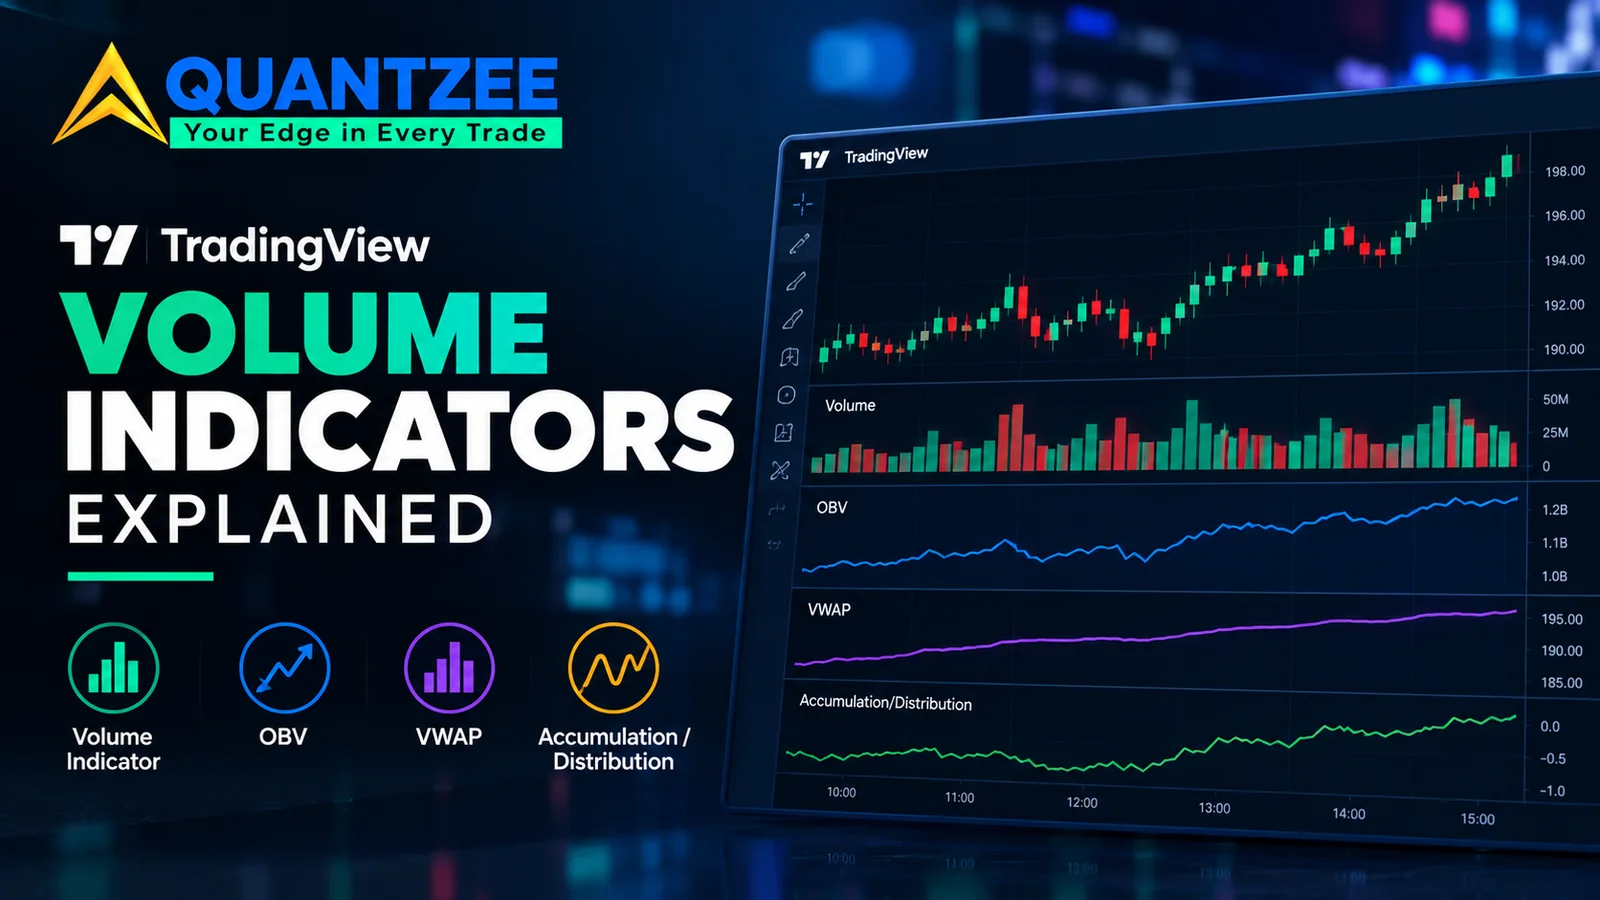
Volume Confirmation Is the Most-Recommended Filter That’s Almost Never Measured
Open ten TradingView volume indicator write-ups and nine of them tell you to "confirm the move with volume." Almost none of them tell you which volume tool answers which question, or what happens when you actually test the rule. A trading view volume indicator is not one thing — it's four different measurement families, built from different inputs, and each one can only answer the question it was built to answer. None of them, on their own, can tell you whether a breakout is real.
This page sorts the four families by the question each one answers, states plainly what each one needs as input and what it cannot see even with that input, and then does something most volume comparisons skip: it reports what happened when the "volume confirms the breakout" claim was actually tested on real chart data. The short version — the rule held up, but not by the margin most traders assume, and it only held for one specific pattern condition, not as a general law.
The Four Volume Families, and the One Question Each One Answers
Every volume indicator on TradingView traces back to one of four families. They don't compete with each other — they measure different things, so stacking two from the same family tells you nothing new, while pairing one from each gives you an actual cross-check.
| Family | Question it answers | Example tools |
|---|---|---|
| Raw bar volume | Was this single bar's participation unusual? | Volume histogram, Relative Volume |
| Cumulative series | Is participation agreeing with the trend, bar after bar? | On-Balance Volume, Accumulation/Distribution |
| Volume by price | Where did trade actually concentrate? | Volume Profile, VWAP |
| Delta / footprint | Which side was the aggressor at this price? | Footprint charts, Delta volume |
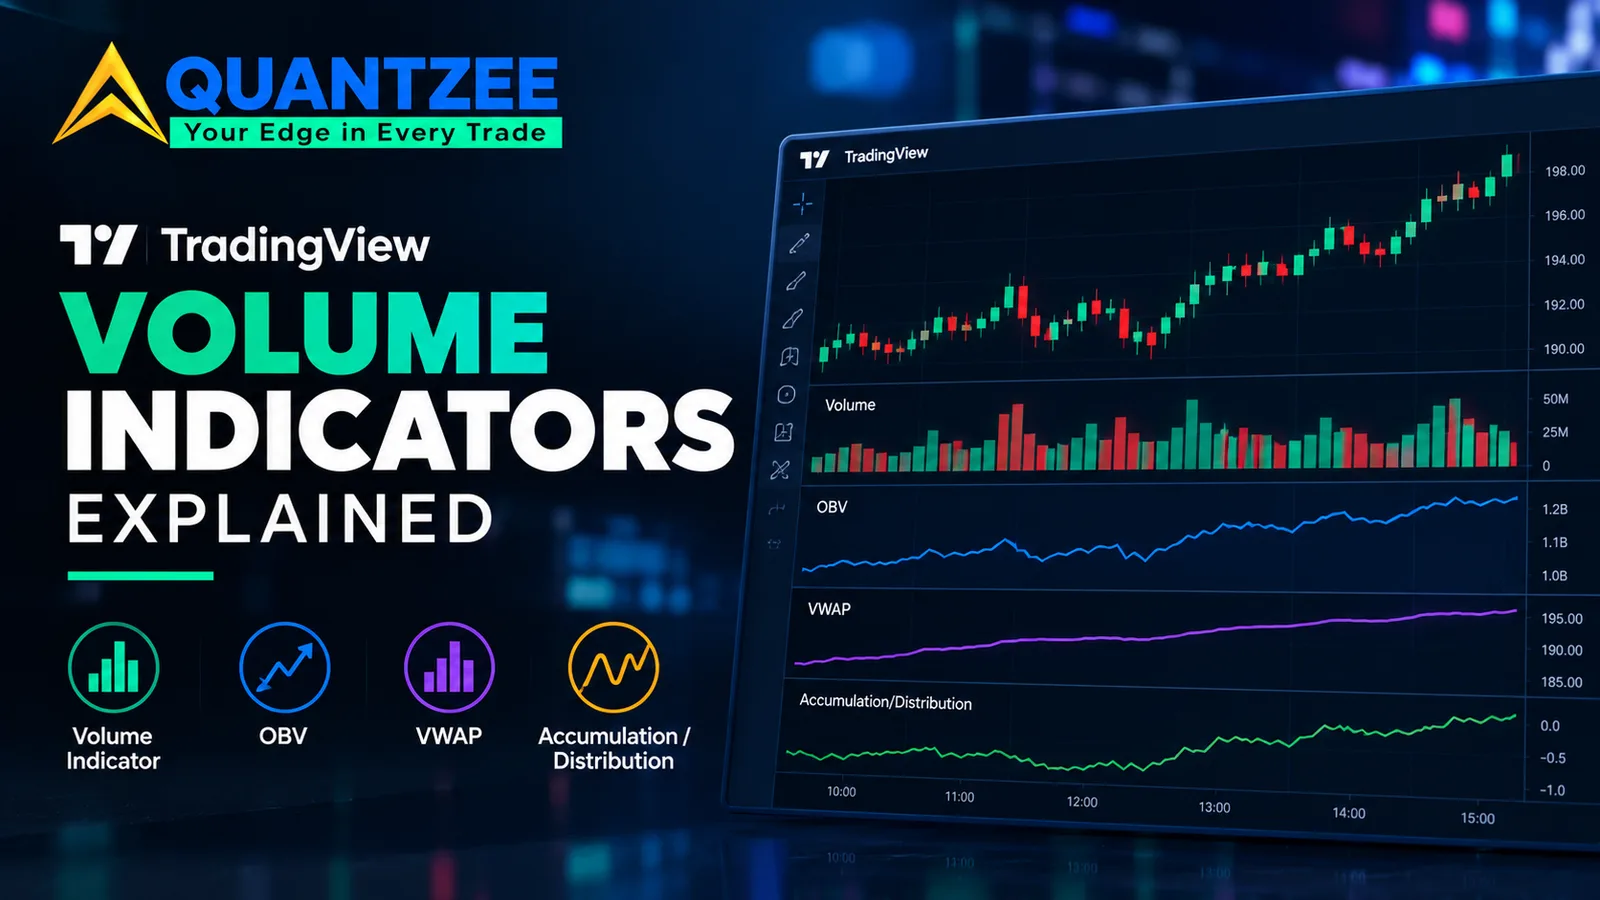
Raw bar volume is the simplest and the most data-cheap: a single bar's traded size against its own recent average, available on any feed, any timeframe, any instrument. It tells you a bar was loud. It does not tell you why, or whether loud was bullish or bearish.
Cumulative series add up a signed volume number bar after bar so you can read the slope. On-Balance Volume's absolute level is meaningless — the slope and the divergences are what carry information, and we tracked exactly why that is true in a separate test. Accumulation/Distribution weights volume by where price closed inside the bar's range instead of just the sign of the close, which is a materially different rule from OBV even though both lines move up and down together most of the time. A separate family entirely — Chaikin Money Flow, the Money Flow Index, and the Chaikin Oscillator — gets lumped in with OBV and A/D constantly despite measuring different inputs; how those three money-flow tools actually differ from each other untangles which is which.
Volume by price abandons the time axis and bins volume into price levels instead, which is the only way to see where real acceptance happened rather than just how much traded. Choosing the right profile period changes what question the profile is answering — a session profile and a 90-day composite profile are not more or less detailed versions of the same chart, they are answers to two different questions, and that choice is covered on its own page rather than repeated here. That's a question about time period. A separate question is which profile indicator type you're even looking at — Fixed Range, Session, Visible Range and Composite profiles bin the same trades differently before period ever enters the picture, which the profile-types comparison breaks down. Supply and demand zones get drawn from a related idea — price levels where orders concentrated — but the same chart rarely produces the same zones from two different traders, which is a structural problem profile volume alone doesn't fix.
Delta and footprint tools split a price level's volume into what traded at the bid versus the ask, which is the only family of the four that attempts to read aggression directly rather than infer it. Footprint charts and their bid-ask data requirements are the most demanding of the four families and the most limited in where they actually work, which the next section covers. Cumulative volume delta takes that same bid-ask split and runs it forward as a running total, the same way OBV runs raw volume forward — useful for reading divergence between price and aggressor flow, with the same reset-point caveat that applies to any cumulative series. The word "imbalance" shows up constantly in this family too, and it does not mean one thing: order flow, footprint, and volume profile each use the term differently, and conflating the three is a common source of confusion the first time you read a footprint chart. For the practical workflow of putting these reads together on a live chart, rather than just the family definitions covered here, see how to read order flow, which builds on the order flow basics defined there.
What Each Family Needs as Input — and Why That Matters More Than the Chart Says
The four families are not interchangeable partly because they don't need the same data, and a tool that looks identical on two different symbols can be measuring on two completely different foundations underneath.
- Raw bar volume needs nothing beyond what comes with any OHLCV feed — open, high, low, close, volume per bar. This is why it works everywhere, including thinly-quoted instruments where the other three families fall apart.
- Cumulative series need the same OHLCV feed, plus a fixed starting point you choose yourself. That starting point is the single biggest source of confusion with this family — the line's absolute height depends entirely on where you reset it to zero, not on anything the market did.
- Volume by price needs intrabar data — either genuine tick data or a reasonably fine lower-timeframe reconstruction — to assign volume to specific price levels inside each bar rather than just to the bar as a whole. A profile built from 1-hour bars on a thinly-traded symbol is coarser and less trustworthy than one built from 1-minute bars on a liquid one, even though both render as the same-looking histogram.
- Delta and footprint need tick-level data carrying each trade's price, size, and whether it was buyer-initiated or seller-initiated — an aggressor flag. That data is cleanest for exchange-traded futures and consolidated-tape equities. For forex and multi-venue crypto, where there is no single consolidated tape, the aggressor flag is reconstructed from whichever venue's feed you're subscribed to, and reconstruction is an estimate of the trade, not a record of it.
According to the U.S. Securities and Exchange Commission, equity trade reporting in the United States flows through a consolidated tape that aggregates trades across multiple exchanges and venues into one reported volume figure — which is precisely why footprint data is comparatively clean for listed equities and comparatively dirty for instruments that trade over multiple disconnected venues with no equivalent consolidation.
What None of Them Can See, Even With Perfect Data
Here is the ceiling that applies to all four families, no matter how good your feed is. A standard chart feed — even a tick-level one with an aggressor flag — tells you how much traded and, at best, which side initiated it. It does not tell you who traded, why they traded, or whether a single printed trade was one participant filling an entire order or a hundred small, unrelated retail orders landing in the same second.
This matters because the mental model most traders carry — "big volume means a big player is active" — assumes a 1-to-1 relationship between size and intent that the data simply does not carry. A 50,000-share print could be one institution's algorithm working a single parent order over several minutes and splitting it into child orders that happen to cluster, or it could be five hundred unrelated retail fills arriving in the same tick because of a scheduled news release. The volume number looks identical either way. No family of volume indicator — not cumulative, not profile, not footprint — resolves that ambiguity, because none of them carry participant identity, and no retail-accessible feed does either.
The Measurement Limits, Stated Plainly
Each family also has a specific, testable weakness, not just a general one. LuxAlgo's analysis found that a single tick of difference between two closes can assign an entire bar's volume to one direction under the standard net-close rule — a bar that closed up by a tenth of a point, on heavy volume, gets that whole bar counted as "bullish" participation, even though the move inside the bar may have been flat or mixed.
For cumulative series specifically, we tested this directly on the OBV page: resetting the running total to zero at twelve different starting points between 2019 and 2024, across the same underlying price history, produced wildly different absolute ending values from identical price action, while the slope and divergence pattern stayed consistent across every reset point. The absolute level is an artifact of where you started counting. Only the shape of the line carries information.
Profile levels carry a parallel problem one layer up: the same price history produces a different value area and point of control depending on the date range and the number of price rows you choose, because both choices change which trades get bucketed together. A profile is not a fixed property of the market; it is a property of the market plus the window you chose to look through.
None of this makes any of the four families useless. It means each one's number has to be read with its specific blind spot in mind — in our experience, the single most common trading mistake with volume tools is treating a cumulative level or a profile shape as a fixed fact about the market rather than a number that depends on a choice the trader made.
Why “Volume Confirms the Breakout” Is a Claim, Not a Rule
"Volume should confirm the breakout" is repeated often enough that it reads like settled technical analysis. It is closer to a hypothesis that happens to hold up under one specific, testable condition — and fails to hold under others.
We measured this directly rather than assume it, using the head-and-shoulders pattern as the test case because its volume rule is unusually well-specified: declining volume through the right shoulder, followed by expansion on the neckline break. Our data set covered a sample of 94 structurally-confirmed patterns. Of those, 71 also cleared both volume conditions — right-shoulder rally volume under 80% of the left shoulder's, and neckline-break volume at or above 150% of the 20-day average. The other 23 cleared the structural test but failed one or both volume conditions.
The result: 58% of the 71 volume-confirmed patterns reached their measured-move target within 20 days. Of the 23 that failed the volume filter, only 31% did. That's close to a two-to-one difference in outcome, and it's the strongest single piece of evidence we have for treating volume as a hard filter on this particular pattern, rather than a nice-to-have. Full breakdown, including how the 94-pattern sample was built, is on the neckline volume test page.
What this result does not prove is that volume confirmation works the same way on every pattern or every market condition. It proves it works for this one, specific, pre-registered rule, on this one pattern. Generalizing it to "volume always confirms breakouts" is exactly the kind of claim this page is arguing against.
A Question-to-Tool Table You Can Actually Use
The fastest way to pick the right tool is to start from the question, not the indicator name.
| Your question | Tool to reach for | Honest limitation |
|---|---|---|
| Was this bar's volume unusual? | Relative volume / volume histogram | Tells you loud, not why |
| Is the trend gaining or losing participation? | OBV or A/D slope and divergence | Absolute level means nothing; only slope and divergence count |
| Where did real trade concentrate? | Volume profile, correct period chosen | Changes with your chosen range and row count |
| Who was more aggressive, buyers or sellers? | Delta / footprint | Needs clean tick data; reconstruction is an estimate on fragmented venues |
| Will this specific level hold? | No volume tool answers this alone | Volume is a filter on other setups, not a standalone stop-or-go signal |
That last row is the one most volume write-ups skip, and it's the most important one. Participation data tells you how much conviction accompanied a move. It does not price in everything else that determines whether a level holds — nearby resting liquidity, the broader trend, correlated instruments, or the news calendar. That resting liquidity is visible on the DOM, but resting orders on the order book lie more often than traders assume, so treat it as another input to cross-check, not a volume-tool substitute. Pairing a volume read with an independent input, rather than stacking two tools that are secretly reading the same underlying signal, is the actual edge — covered in more depth on confluence versus correlation.
Equities, Futures, and Crypto Don’t Report Volume the Same Way
A trading view volume indicator reads a number straight off the feed, and that number means something different depending on the venue behind it.
Listed U.S. equities report through the consolidated tape the SEC oversees, so "volume" for a given symbol genuinely aggregates trades across every exchange and dark pool required to report. Exchange-traded futures report through the exchange's own clearing and settlement process; the Commodity Futures Trading Commission regulates that reporting chain for U.S. futures markets, and because every contract clears through one exchange, that reported volume is complete for that specific contract — but it says nothing about volume in a different expiry or a related contract on another exchange.
Crypto is the outlier. There is no regulator-mandated consolidated tape across venues, so the "volume" a chart shows is whatever that specific exchange reports for that specific pair — and multiple venues trading the same pair can show meaningfully different volume, timing, and even price, because there's no single source of truth stitching them together. A volume spike on one crypto exchange's chart may not appear at all on a different exchange's feed for the same coin at the same timestamp. A trader who built their read of "normal" volume on one venue and applies it unmodified to another is comparing two different datasets without realizing it.
The practical takeaway: calibrate your relative-volume baseline and your profile's typical range per venue and per instrument class. A volume read that's reliable on one listed equity doesn't transfer cleanly to a thinly-quoted futures contract or a crypto pair traded across five exchanges, even if the indicator on the chart looks exactly the same.
Where This Fits in a Toolkit
None of the four families is a signal generator on its own — each one is a filter that either supports or contradicts whatever setup you're already looking at. That's the design behind Quantzee's $59.99 AI Adaptive Quant Toolkit, which pairs trend, momentum, and structure analysis so a volume read isn't the only cross-check running against a trade idea. A trader who understands which volume tool answers which question gets more out of pairing it with structure and momentum reads than from adding a fifth volume indicator that's really just reading the same bars again. Related context on reading price itself alongside volume lives in our VWAP glossary entry, since VWAP sits at the intersection of the price-by-volume and cumulative families.