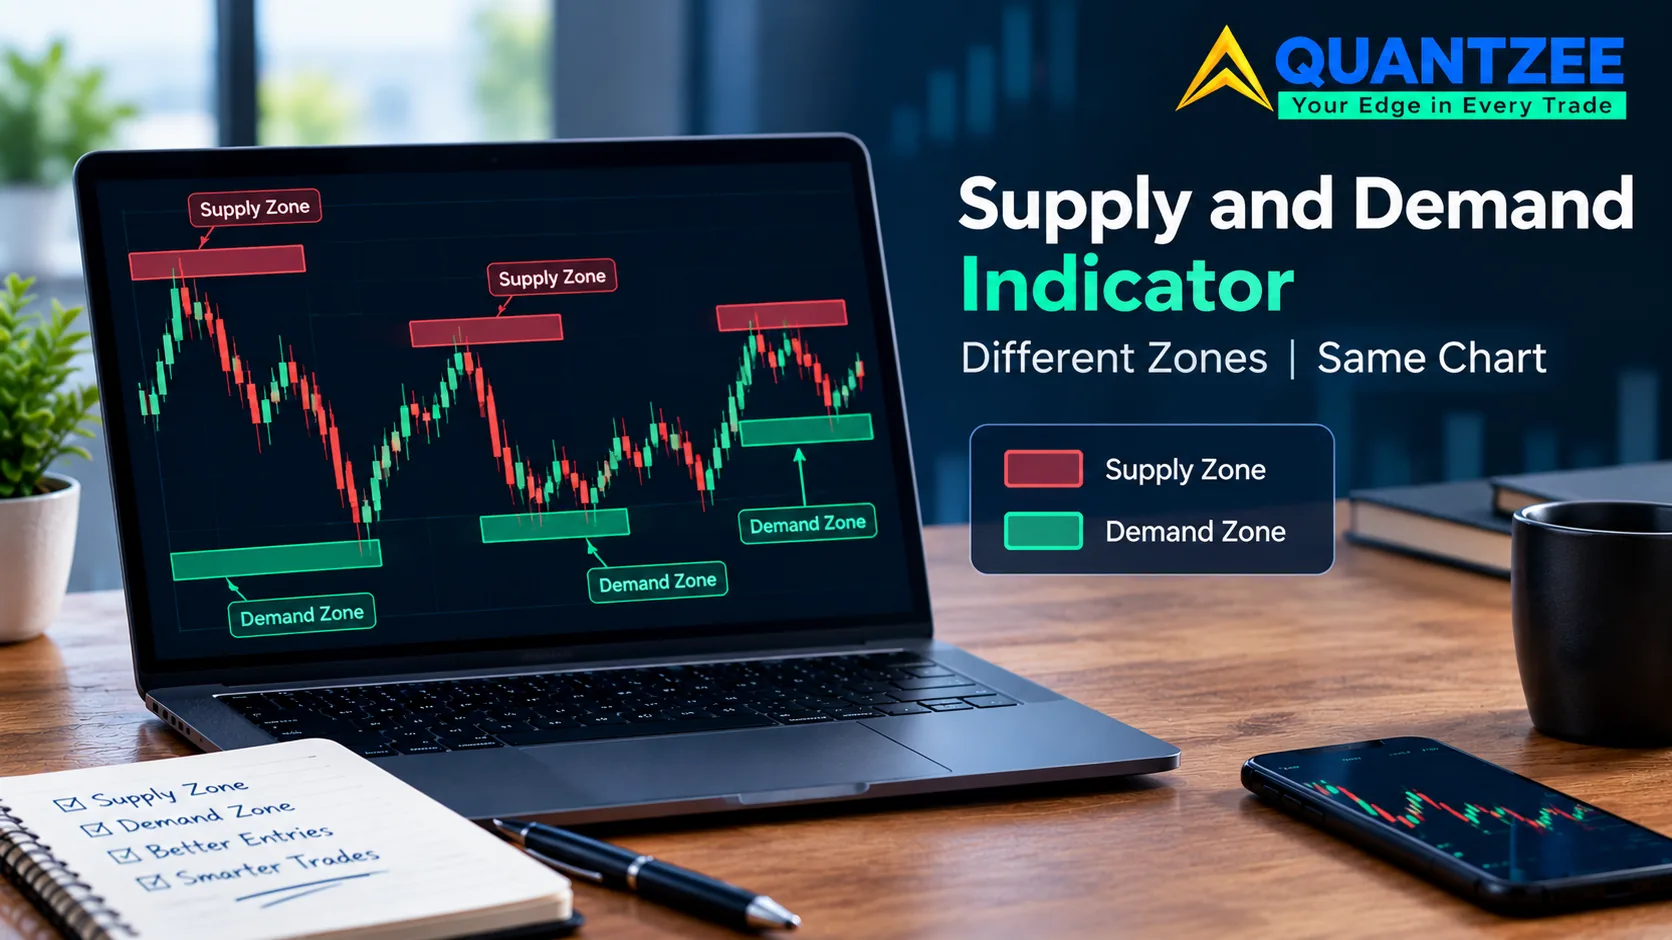
Load two different supply and demand indicator scripts on the same five-minute chart and you will see two different boxes. These are not similar boxes with slightly different edges. They box genuinely different candles, sometimes in a different place on the chart entirely. This is not a bug in either script. A supply and demand indicator is not measuring one agreed-upon thing. It is applying a rule set, and every vendor picks a different rule set without saying so on the product page.
Quantzee already covers how a human trader should judge a zone by hand — the four tests a zone has to pass are laid out at our zone-validity breakdown, and this article does not restate that ground. What follows is a different question: when a piece of software draws the box for you, what parameters does it have to fix to do that, and which of those parameters is the one that moved when your indicator and your neighbor's indicator disagreed about the same chart?
The Four Base Patterns Are a Vocabulary, Not a Rule Set
Per the retail trading literature that most supply and demand indicator write-ups draw from, there are four named base patterns: drop-base-rally, rally-base-drop, drop-base-drop and rally-base-rally. Each one describes a short consolidation (the "base") sitting between two opposing directional moves, and the base is the zone. That is useful shorthand for talking about a chart out loud. It is not, on its own, enough information to code a script.
The gap shows up the moment you ask a follow-up question: how short does a "short consolidation" have to be? How large does the move on either side have to be, relative to the base, to count as a "rally" or a "drop" instead of just noise? The retail vocabulary doesn't answer this. It was never written as a specification. It was written to teach a reader how to recognize a shape, not to tell a machine how to draw one. A supply and demand indicator has to answer that question somehow. The answer it picks stays invisible unless you go looking for it in the settings panel or the source code.
What the Three Real Competitor Write-Ups Actually Cover
A screen of page-one results for this keyword is dominated by TradingView's own script directory, a mirror of that directory for an India audience, two course and prop-funnel pages, and a PDF host — none of which is a content competitor in any real sense. Three pages on that screen are genuine articles, and reading all three side by side is instructive, because none of them answer the question this piece is built to answer.
A piece published by ATAS on 2024-11-05 runs roughly 3,800 words and lists seven separate identification methods: swing reversal blocks, imbalance gaps, a Wyckoff read, market profile bulges, footprint clusters, non-standard charts and order-book concentration. It carries real chart examples across crypto and index futures. It never compares how differently those seven methods would draw a box on the same candles, and it states no boundary rule and no measured outcome anywhere in the piece.
A direct indicator-vendor competitor, quantum-algo, published roughly 4,500 words on 2026-04-20 and is the only page on the screen that states numeric rules at all — a base of 6 candles or fewer, a displacement of 3 or more large-bodied candles, and the 12-point quality score discussed below. The numbers read as precise. The terms behind them, "tight range" and "large-bodied," are never defined on the page itself.
The oldest of the three, forexbee, published around 2022-05-31 and runs about 1,200 words. It is where most of the retail four-pattern vocabulary traces back to on this particular search result. It names the four base-pattern types cleanly, states one loose criterion (a larger-body candle against a smaller-body candle), and stops there — no numbers, no boundary definition, no invalidation rule, no data behind any of it.
Put the three side by side and a pattern emerges: the page with real chart examples has no numbers, the page with numbers has no definitions behind them, and the oldest page has neither. That gap is exactly the parameter taxonomy this article exists to fill.
Five Parameters Every Auto-Drawing Zone Tool Has to Fix
Strip away the branding and every zone-drawing script, ours included, is making five decisions. Change any one of them and the box on your chart changes with it.
- Base-candle test. What counts as a "base" candle in the first place — usually a body-to-wick ratio or a maximum body size relative to the candles around it. A candle that passes on a loose ratio and fails on a strict one changes which candles belong to the base at all.
- Base-length cap. How many consecutive base candles are allowed before the pattern is disqualified as a base and reclassified as something else, like a range. One competitor states a 6-candle cap; another indicator we reviewed uses 10. Neither number is wrong — they're different design choices with different consequences.
- Displacement count and size. How many candles, and how large relative to recent average range, have to move away from the base before the base is confirmed as a zone rather than discarded as a pause that went nowhere. A 3-candle displacement requirement will confirm zones a 5-candle requirement would reject.
- Boundary placement. Where the near edge and far edge of the drawn box actually sit — this is the single biggest source of disagreement between tools, and it gets its own section below.
- Death condition. What has to happen to the zone before the tool stops drawing it or marks it as broken. This is also covered on its own, because three different events get treated as "the zone is dead" depending on the tool.
None of these five parameters has an industry-standard value. A supply and demand indicator tradingview script and a supply demand indicator built into a different platform can both be built honestly. They can still disagree on every single candle. That is what you get when five open parameters are each set independently.
The Boundary Question That Changes Every Entry
This is the parameter with the largest practical consequence, because it changes your stop-loss distance on every trade that uses the zone. There are two competing conventions for where a zone's far edge sits:
Wick-inclusive boundary: the far edge is drawn at the extreme wick of the base, including any spike beyond the candle bodies. Body-inclusive boundary: the far edge is drawn at the extreme body close, ignoring the wick entirely. The near edge has a parallel split — some tools draw it at the body closest to the breakout, others at whichever price first triggered the displacement move.
A tool using the wider, wick-inclusive boundary will draw a bigger box. A bigger box means a wider stop if you're trading off that zone's far edge. A wider stop means smaller position size for the same dollar risk. That chain ends in a different realized outcome on every single trade — not because the market behaved differently, but because the indicator measured the same candles with a different ruler. If a supply and demand indicator doesn't disclose which convention it uses, you cannot compare its win rate to another tool's win rate. They are not measuring the same box.
A Zone Can Die Three Different Ways, and Tools Don't Agree on Which One Counts
Every zone-drawing tool eventually has to decide the zone is no longer valid and stop drawing it, or flag it as mitigated. Three distinct events get used as the kill signal, and they are not the same event:
- A single wick through the zone. Price pokes through the boundary on one candle's wick and immediately reverses. Some tools treat this as a touch that respects the zone; others kill it on contact.
- A body close beyond the zone. A full candle body closes past the boundary, not just a wick. This is the stricter and, in our experience supporting Quantzee clients running multiple zone tools side by side, the more common convention for a genuine invalidation.
- Repeated grinding through the zone. No single decisive break, but price chops back and forth through the boundary enough times that the zone has clearly lost whatever imbalance made it a zone. Few tools code this explicitly. Most let the zone sit stale on the chart for weeks after it has stopped meaning anything.
A supply and demand indicator that only codes rule one (single wick) will report a worse hit rate than one that only codes rule two (body close). This holds even on the exact same price data, because the two tools are not counting the same invalidations. This is one more reason raw performance claims from vendor to vendor don't transfer.
Why a Quality Score Out of a Fixed Total Is a Presentation Choice, Not a Measurement
The quantum-algo write-up from 2026-04-20, named above, scores every detected zone out of 12 points and calls anything above 8 a "high-quality" zone. The scoring looks rigorous on the page. According to the same write-up, the inputs feeding that score include a base of "6 candles or fewer" and a displacement of "3 or more large-bodied candles." The write-up never discloses the methodology behind how "large-bodied" is defined. It never states what sample of trades the 8-point pass threshold was validated against. A number out of 12 is only evidence if the inputs to that number are themselves defined and the threshold was tested against outcomes, not picked because it looked like a reasonable cutoff.
The same page also states a 75% win rate for zones scoring above the threshold, with no sample size, no date range and no out-of-sample test named anywhere on the page. We are not going to publish a competing number to replace it. We don't have one that would meet our own bar for a measured claim. The pattern worth naming here is simple: a win rate with no sample and no date range is a marketing sentence wearing a statistic's clothes. A reader should treat it exactly that skeptically, regardless of which vendor published it.
What a Zone Tool Cannot See, No Matter How It's Tuned
Every parameter above operates on one input: the candle series. That has a hard ceiling. A zone tool cannot see who actually transacted at a price level. It cannot distinguish a large resting order from ten small retail orders that happened to cluster at the same price. It cannot tell you whether the interest that created the original imbalance is still resting there unfilled, or whether it was fully absorbed the first time price returned. Order-flow and footprint tools get closer to that question by reading trade-by-trade prints. A candle-based zone indicator, including ours, is reading the aggregate shape of price action after the fact. That's a close proxy for where supply or demand was, not a direct reading of resting interest. Volume-by-price tools sit closer still, binning actual traded volume into price levels instead of inferring concentration from candle shape — which volume indicator answers which question covers that family and the other three alongside it.
This is also why claims phrased as certainties — "this zone will hold" or any wording that implies a guaranteed outcome — don't belong anywhere near a candle-based tool. The tool is reporting a pattern match against a rule set you can inspect. It is not reporting a fact about unfilled orders sitting in a venue's book. The SEC's own investor-education material on technical analysis frames chart-pattern tools the same way: as pattern-recognition aids built from historical price data, not as predictors with a verified forward edge. FINRA's investor insights on technical analysis make a related point from a different angle. Tools built on historical price shapes carry no guarantee that the pattern repeats.
How to Interrogate Any Zone Indicator in Five Minutes
You do not need source code access to find out which rule set a supply and demand indicator is running. Our clients who run this check once rarely need to re-run it on the same tool, because the behavior is consistent once you've mapped it:
- Change the base-length cap in the settings, if it's exposed. If the tool draws a different zone on the exact same candles, you've confirmed it enforces a length cap at all, and roughly where it sits.
- Change the boundary setting from wick-based to body-based, or vice versa, and watch whether your stop distance on a saved setup changes. If it does, you now know which convention the tool shipped with by default, and that default was quietly setting your risk per trade before you checked.
- Force an invalidation by scrolling to a zone you know got a single wick poke versus one that got a full body close through it, and see which one the tool marked as broken. That tells you which of the three death conditions above it actually codes.
Run these three checks on any tool, including ones built by Quantzee, before you size risk off a drawn zone. A tool that discloses its parameters openly in its settings panel will survive this check in under five minutes. One that doesn't expose any of the three will leave you guessing exactly where you started.
Quantzee's SMC Toolkit Pro publishes its base-length cap, boundary convention and invalidation rule in the open settings panel rather than hiding them inside a black-box score, specifically so this five-minute check has an answer every time you run it. If the parameter taxonomy above is the question you came here with, the toolkit's settings documentation is where the answers to your own chart live.
For the adjacent structural tools that often sit alongside a zone indicator on the same chart, see our breakdowns of order blocks and market structure you can code, and the glossary entry on support and resistance if the zone-versus-level distinction isn't yet clear.
Keep this short list on hand the next time a chart looks "wrong." The box is not wrong. It is a rule, drawn by a tool, using settings you may not have checked yet. Open the panel. Read the five values. Then judge the box with eyes open, not blind trust.