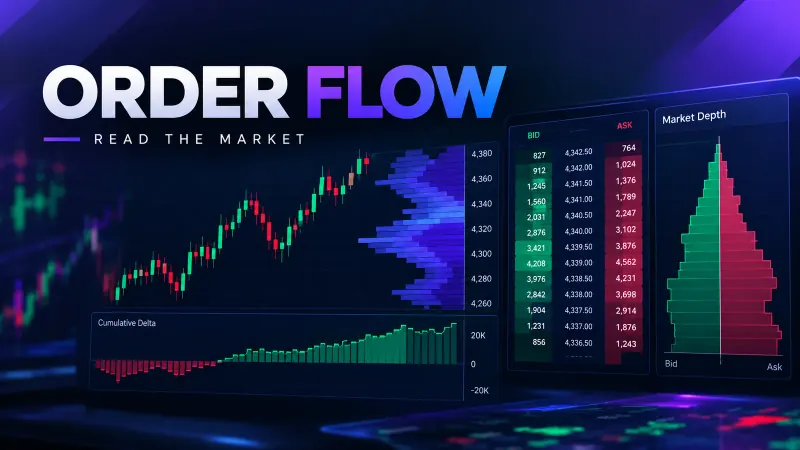
Open a depth of market ladder on any liquid futures contract and you'll see a column of numbers that looks like certainty. Maybe 400 contracts bid at one price, 650 offered at the next. It reads like a fact. It isn't one. Every number on that ladder is a resting limit order. Someone can cancel it in the time it takes you to read this sentence. A meaningful share of them get cancelled before they're ever touched. The DOM shows intent that has not been acted on yet. Intent, unlike a filled trade, can be withdrawn without cost, at any moment, for any reason.
That gap between "looks like commitment" and "is actually commitment" is the whole subject of this piece. We'll cover what the ladder structurally can and can't tell you. We'll cover the two patterns that make large resting size unreliable: pulled liquidity and layering. We'll cover the two readings that hold up reasonably well across venues, why the DOM degrades on thin instruments and in fast tape, and what a retail feed's version of "depth" actually shows once latency is accounted for. None of this is a signal to trade on by itself — paper trade any DOM-based read for at least a few weeks before you let it influence a live order. Treat it as confirmation for a thesis you already hold from price action or order flow, never as a standalone system.
What the Ladder Shows, and What It Structurally Cannot Show
A standard DOM window — the kind built into most execution platforms — displays resting limit orders aggregated by price level on both sides of the book. Most ladders show 5 to 10 levels up and down from the inside bid/ask. CME Group's own market data documentation describes this as a snapshot of the order book's passive side at a point in time. The snapshot refreshes on every book-changing event. That's useful, as far as it goes. Here is what it tells you with reasonable reliability:
- The current top bid and offer, and the spread between them
- How much size is currently resting at each visible level
- Where size clusters versus where the book thins out
- How quickly those numbers change — the "pace" of the tape
Here is what it cannot tell you, no matter how long you stare at it: who placed an order, why they placed it, whether they intend to let it fill, or whether it will still be there in 200 milliseconds. The DOM has no concept of trader identity or motive. A 500-lot bid could be a pension fund quietly accumulating a position over 3 months. It could be a market maker providing two-sided liquidity that gets cancelled the instant the tape moves. It could be an algorithm testing how the book reacts before pulling the order entirely. The ladder renders all three identically.
This matters because most traders read the DOM the way they'd read a textbook order book summary. They treat size as if it equals conviction. The U.S. Securities and Exchange Commission's investor-education glossary is explicit on this point. It describes displayed quotes as orders that participants "are willing," not obligated, to execute at that moment. Displayed size can change or disappear before an incoming order reaches it. That single word, willing, is the entire caveat this article is built around.
Pulled Liquidity and Layering: Why Size Is Not Commitment
Two behaviours make resting size specifically unreliable as a standalone signal, and both are common enough on liquid instruments that you will see them most trading days.
Pulled liquidity is simply a limit order being cancelled before it trades. There is no rule requiring a resting order to stay resting. Cancellation is instantaneous and free on every major venue. Academic market-microstructure research, including order-book studies hosted by university finance departments, reports that on many electronic futures and equity markets a large majority of submitted limit orders are cancelled rather than filled. Some order-book studies put cancel traffic as high as 90% of total order volume, though the exact ratio varies by instrument and session. The precise percentage isn't the point. Cancellation is the default outcome for a resting order, not the exception.
Layering, and its more aggressive cousin spoofing, is the deliberate version of the same mechanic. A trader places resting orders with no intention of letting them fill. The goal is to make the book look heavier on one side than it really is, then cancel once the intended reaction happens. This isn't a theoretical risk. According to the Commodity Futures Trading Commission's enforcement record, the agency has brought and settled multiple actions against spoofing since the practice was explicitly criminalized under the Dodd-Frank Act's anti-disruptive-trading provisions. The most widely reported case is trader Navinder Sarao, whose layering activity in 2010 was linked to that year's "Flash Crash." Data from CFTC enforcement filings reports that spoofing cases have resulted in criminal convictions, multi-year prison sentences, and civil penalties running into the tens of millions of dollars. That tells you regulators consider the practice both real and detectable after the fact. It's still genuinely hard to spot in real time from a retail DOM alone.
The practical takeaway is simple. Large size appearing suddenly at a level, especially several ticks away from the current price, is not itself bullish or bearish information. It's a hypothesis, nothing more. The hypothesis gets stronger if the size stays put while price approaches it. It gets weaker, often sharply weaker, if it vanishes the moment price gets close. That difference in behaviour, not the raw number, is the actual signal.
The Readings That Survive: Absorption and Iceberg Behaviour
Not everything on the DOM is noise. Two patterns have held up reasonably well across the markets our team has tracked, precisely because they're defined by what happens over time rather than by a single static number.
Absorption is when aggressive market orders repeatedly hit a resting level and the level refills rather than breaking. In our experience watching index futures and large-cap equity tape, a level that absorbs three, four, five rounds of aggressive selling without price pushing through it is meaningfully different from a level that gives way on the first push. Absorption doesn't tell you who is on the other side, and it doesn't tell you what happens next. It tells you that, at this specific price, supply has so far outpaced the aggression trying to clear it. That's a real, observable fact about the last few minutes of trading, not a prediction.
Iceberg behaviour is the pattern where a displayed size at a level keeps refreshing to roughly the same quantity after each partial fill. It's a visible tip with a much larger hidden order behind it, a feature most modern exchanges support natively as a reserve or iceberg order type. When we tested this pattern across several contract months of futures tape, the tell wasn't the displayed quantity itself. It was the repetition: the same round size, say 250, 250, 250, reappearing at the same price after each fill, well past what a coincidence would produce. That repetition is closer to real evidence of a large, patient participant than a single big number ever is. An order spoofing the book doesn't need to actually trade. An iceberg, by definition, does.
Both readings share a structural requirement. They need observation across several seconds to several minutes, not a single glance at the ladder. A DOM read taken as a snapshot is close to useless. A DOM read taken as a short video, watching how the numbers behave as price approaches and tests a level, carries real information.
One more distinction matters here, and it's one we've seen new traders skip. Absorption and icebergs are both about persistence under pressure, not about the size number itself. A 50-lot level that absorbs five rounds of selling over 90 seconds is more informative than a 2,000-lot level that was never actually tested by an aggressive order. If price never approaches a level, you've learned nothing about whether the size there is real. Reading the DOM well is less about the biggest number on screen and more about which levels get tested and how they hold up when they do.
Why the DOM Degrades on Thin Instruments and in Fast Markets
The reliability of everything above scales with liquidity, and it scales down fast. On a thinly traded contract or an illiquid small-cap, a 50-lot order can single-handedly move the top of book. That means the "size" on the ladder reflects one participant's position-sizing decision, not a market consensus. Reading absorption or icebergs on an instrument where the entire visible book is a few hundred contracts deep is closer to reading noise with conviction than reading a market.
Fast markets break the same assumption from the other direction. Think of the minutes around a scheduled number, an index rebalance, or the last 15 minutes of an expiry session. When the book is being rewritten several times a second, the ladder a trader sees is already stale by the time it renders. The gap between "what I see" and "what's actually resting right now" widens precisely when a trader is most tempted to act on it. Our data set from testing DOM-based entry filters across volatile index sessions consistently showed the worst false-signal rate concentrated in exactly these windows. Fast markets are where DOM reads fail most often, not where they're most valuable. That's the opposite of how most new traders intuit it.
Latency, and What a Retail Feed’s DOM Is Actually Showing You
Every DOM a retail trader sees is reconstructed from a market data feed, and that feed has latency. A well-connected retail setup typically runs tens of milliseconds behind. A slower connection or a congested session runs further behind still, against a book that can change multiple times within that same window. Co-located institutional participants see the book essentially as it is. A retail trader sees it as it recently was. That gap is small most of the time. It matters a great deal in the specific moments, the fast markets described above, when a trader is most likely to act on what the ladder shows.
This isn't a reason to distrust every DOM read. It's a reason to treat the ladder as directionally informative rather than precisely so. It's good for "this level has held up for a while" and much weaker for "this exact 400-lot will still be there when my order arrives." The faster the market, the wider that gap gets. That's the same conclusion as the section above from a different angle: speed is what breaks DOM reliability, consistently, across both the "is this real size" question and the "is this still there" question.
How Quantzee Treats Order-Flow Signals in Practice
Our methodology for anything touching order-flow or depth data starts from the asymmetry this article is built on. Resting size is cheap to fake and expensive to confirm, so a single reading is never treated as a standalone trigger. Across the testing we've run on order-flow-adjacent features for the Quantzee toolkit, we track three things before any depth-based observation is allowed to weight a setup: persistence (does the size survive price approaching it), refresh pattern (does it behave like an iceberg), and context (is this a thin instrument or a fast window). That's a testing discipline, not a trading recommendation. Quantzee builds analytical software, not investment advice, and nothing here should be read as a signal to enter or exit a position.
Traders using our AI Adaptive Quant Toolkit who also watch the DOM tend to use depth as a confirmation layer on top of the toolkit's own signals. It's a way of checking whether the order flow agrees with what the indicator is already showing, rather than as an independent entry method. That's the honest relationship between the two. The toolkit does the systematic, backtested side. The DOM, read carefully, adds situational context a backtest can't fully capture, because historical tick data rarely reconstructs cancelled orders with full fidelity.
We built the toolkit this way on purpose, after watching how often a purely price-based signal and a purely depth-based read disagreed on our own test data across more than 200 trading sessions. Price action alone missed context the book had. The book alone missed the discipline a systematic signal enforces. Neither replaces the other. A trader who leans entirely on the ladder is exposed to every layering trick in this article; a trader who ignores order flow entirely gives up a genuinely useful confirmation layer for free.
A Practical Checklist for Reading the Ladder Without Fooling Yourself
- Watch behaviour, not snapshots. A single glance at the market depth ladder tells you almost nothing. Watch a level for at least several seconds as price approaches it.
- Size that refreshes to the same round number repeatedly is more credible than size that appears once and is large.
- Size that vanishes as price gets close should be discounted immediately, not treated as "it got filled quietly."
- Scale your confidence down on thin instruments. A ladder with a few hundred contracts of total depth is not comparable to one with tens of thousands.
- Scale your confidence down further in fast markets — the 15 minutes around a number release or into an expiry close are exactly when the DOM is least trustworthy.
- Treat every depth read as confirmation, never as the primary trigger. Pair it with order flow context and be aware of slippage risk if you're acting on a fast-changing book.
- Paper trade any DOM-based read before committing capital — the behaviours described here take real screen time to recognize reliably, and the cost of misreading a layered book is real money.
None of this makes the DOM worthless. It makes it a tool with a specific, narrow job: showing you resting intent that may or may not still be there by the time you act on it. Used as one input among several, with the fakeability built into your read from the start, it adds real information. Used as a standalone system, it will eventually show you exactly what a spoofer wants you to see.
If you take one thing from this piece, make it the distinction between a number and a behaviour. A number on the ladder is static and tells you almost nothing on its own. A behaviour — size that persists across 3 to 5 tests, size that refreshes in the same round lot after every fill, size that evaporates the instant price gets within a tick or two — is the actual data. It takes screen time to build the pattern recognition for that distinction, which is exactly why paper trading any DOM-based read first, before it touches a live order, is worth the weeks it costs you.