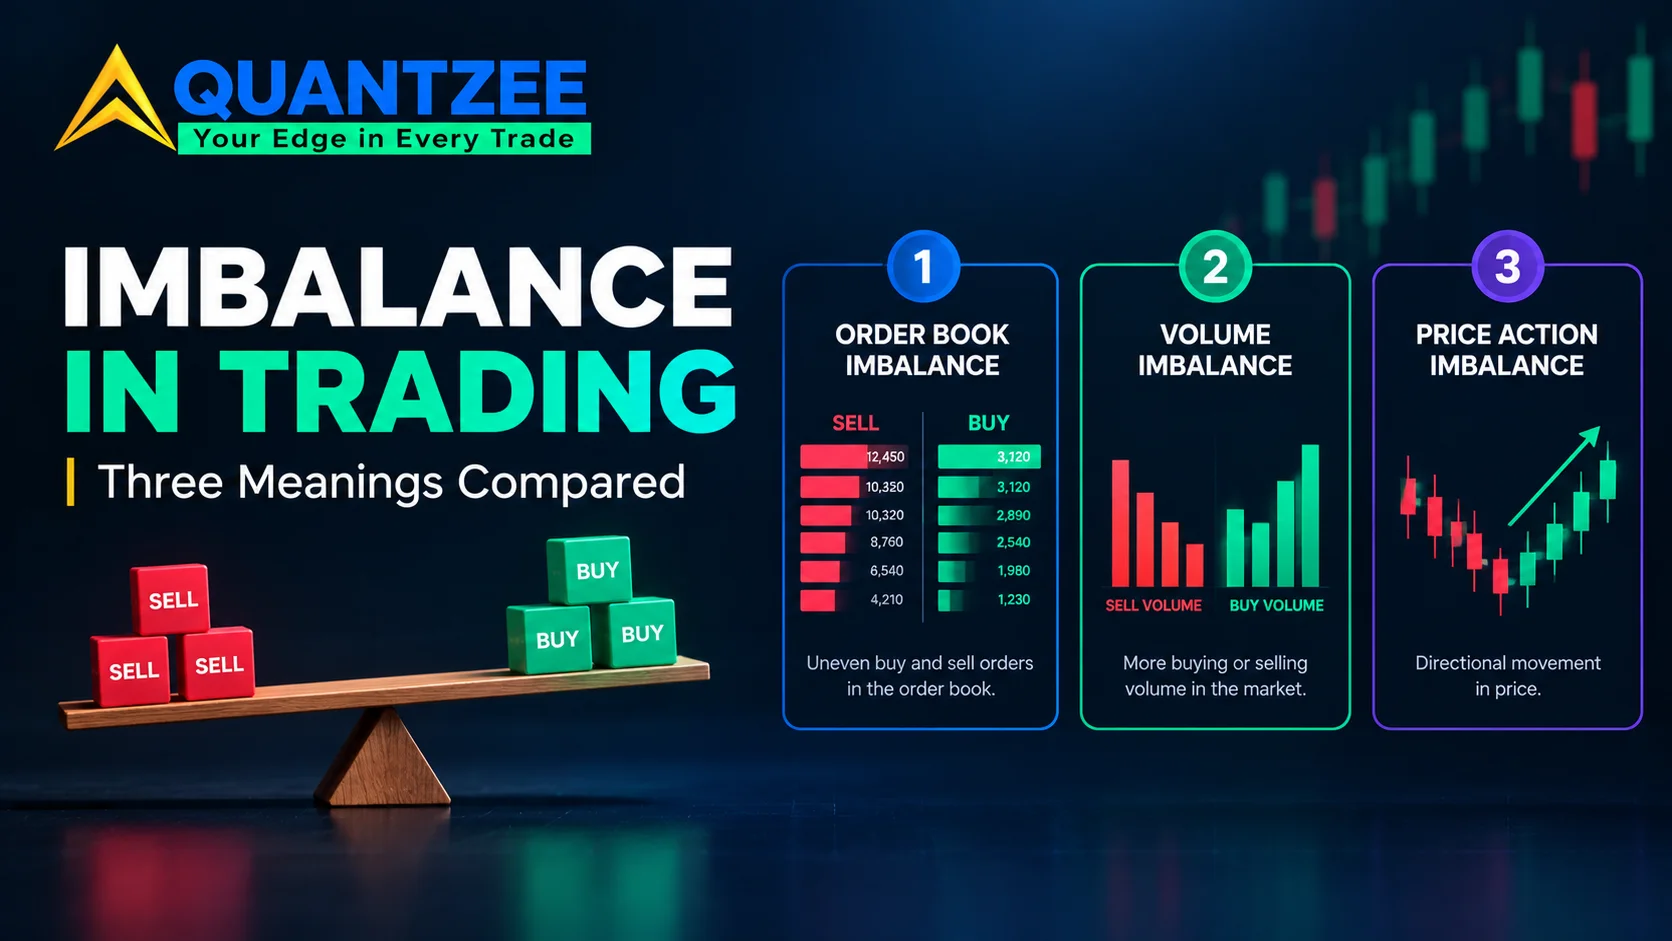
Search "imbalance in trading" and you land on three different definitions. They have nothing to do with each other. Each one comes from a different corner of the market. One page means a gap left on an ordinary price chart. Another means a comparison of buy orders against sell orders, read off a footprint chart one level away. A third means an imbalance published by an exchange before the open or the close. That third version is driven by order flow almost no retail trader can see directly. Each meaning needs a different kind of data. One needs plain candles. One needs tick-by-tick footprint data. One needs an exchange auction feed. Whichever page you land on first usually acts like the other two don't exist. That's the gap this article closes. All three meanings, named side by side, with the data each one needs and the platform that actually shows it to you.
At Quantzee we build analytical software around order flow and price structure. We run into all three of these terms constantly, from traders who assumed they were the same thing. According to the chart-pattern camp, an imbalance is a price inefficiency. Per the footprint camp, it's a volume comparison at the tape level. Market-bulls and similar sites treat it as an exchange-level auction mismatch. None of that is wrong. It's just three words sharing one name, and nobody on the first screen says so plainly.
The three meanings, side by side
Before going deep on any one of them, here's the map. If you already know which tool you're staring at, skip straight to that section below.
| Meaning | What it compares | Data it needs | Where you see it |
|---|---|---|---|
| Price-gap imbalance | A three-candle sequence where the middle candle's range isn't overlapped by the first or third | Ordinary OHLC candles — no tick data required | Any charting platform, usually under "fair value gap" or "imbalance" drawing tools |
| Footprint/order-flow imbalance | Bid volume vs. ask volume one price level diagonally away | Tick-level footprint data, exchange order-book feed | ATAS, Bookmap, Sierra Chart footprint modules |
| Auction/order imbalance | Buy interest vs. sell interest the exchange can't match at a fixed moment | Exchange auction feed, published around the open and close | NYSE and Nasdaq imbalance feeds, usually behind a data subscription |
Three different comparisons. Three different data requirements. Three different places you'd actually look for them. Mixing them up is why a trader reading about the open-auction imbalance on the NYSE walks away thinking it explains a gap on their 5-minute chart. It doesn't. They're unrelated mechanisms that happen to share one English word.
Meaning one: the price-gap reading (what most chart tools call "imbalance")
This is the version most retail traders meet first. It usually shows up inside a smart-money-concepts or ICT-style toolkit. The setup is three consecutive candles. If the high of the first candle doesn't overlap with the low of the third, the untouched range in the middle candle gets marked as an imbalance, also called a fair value gap. There's no tick data involved, no order book, no footprint. It's just ordinary candle highs and lows. That's the appeal: any charting platform with basic drawing tools can mark it, and most indicator libraries now ship a version that does it automatically.
The theory behind it is simple. A fast, one-sided move leaves behind a range where buyers and sellers never actually traded against each other at those prices. Price supposedly tends to revisit that range later to "fill" it. That claim gets repeated constantly and measured rarely. We built a study around exactly that gap in the evidence. We marked 500 fair value gaps across ES futures, BTC, and EURUSD, then tracked what actually happened to each one over the following sessions. Our data shows the fill rate is high but not universal. The time-to-fill also varies enough by instrument that treating "price always comes back" as a rule is the wrong takeaway. We measured this across three separate instruments on purpose, because a single-instrument result only tells you about that instrument, not about the underlying mechanism.
If you want the full breakdown by instrument and by gap size, read our study on 500 marked fair value gaps across ES, BTC, and EURUSD. It's the first-party source behind the numbers cited here. We'd rather point you at the primary data than restate a rounded summary that loses the nuance.
Meaning two: the footprint reading (bid vs. ask, one level away)
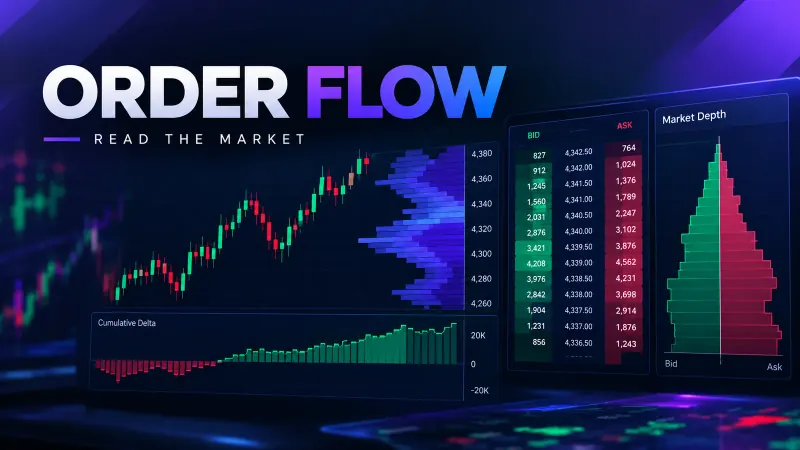
This is the imbalance traders mean when they're looking at a footprint chart rather than a candle chart. Here the comparison isn't past price action. It's live volume at the bid compared with volume at the ask, read diagonally one price level apart. ATAS, one of the platforms built specifically around this method, flagged a 300% diagonal imbalance as worth noting in its 2019 documentation — meaning ask volume three times the bid volume one level down, or the reverse. The platform shipped 150% as its default threshold at that time. That threshold is a setting a user can change inside the platform. It is not a fixed market law. A 300% imbalance on one instrument's typical volume profile might be completely unremarkable on another instrument with heavier average flow.
This reading needs tick-level data. Every trade has to be timestamped and attributed to either the bid or the ask, then aggregated into the footprint grid. A candle-only charting platform simply can't compute it, because there's no record of which side initiated each trade at that resolution. If you're looking at a footprint-style imbalance indicator and it changes its output depending on a threshold setting in the sidebar, you're looking at this version — not the price-gap version from the previous section.
The practical use case here is reading aggression inside a specific price range during a live session. Where did one side overwhelm the other, and did price absorb it or reverse on contact? It's a short-timeframe, order-flow-level tool, closer in spirit to how we approach reading order flow and footprint charts than to a swing-trading chart pattern that you set and forget for days. Footprint is one of four volume families worth knowing apart before you lean on any of them — which volume indicator answers which question covers how it sits alongside raw bar volume, cumulative series, and volume-by-price.
Meaning three: the auction/order imbalance (exchange-published, fixed timing)
The third meaning has nothing to do with your charting platform at all. Exchanges including NYSE and Nasdaq publish order imbalance data around the opening and closing auctions. It's a running tally of buy-side versus sell-side interest that hasn't been matched yet. Per the data from NYSE's own trading information pages, this imbalance exists because large orders — including market-on-close and limit-on-close orders — accumulate ahead of a fixed auction moment. The exchange publishes the net direction and size so market makers and other participants can react before the actual print.
Two things make this version different from the other two. First, the timing is fixed. It exists specifically in the minutes before the open or the close, not continuously through the session like the footprint reading. Second, acting on it in real time typically requires a market-data subscription most retail platforms don't include by default. The raw imbalance feed is an institutional product, even though summarized versions sometimes reach retail screens with a short delay. A trader reading a headline about "a large sell imbalance going into the close" is reading about this mechanism specifically — not a footprint reading, and not a fair value gap.
How to tell which one an indicator is actually computing
If a tool on your screen is labelled "imbalance" and you're not sure which of the three it means, three questions settle it quickly, in order:
- Does changing a percentage threshold in the settings change what it draws? If yes, it's the footprint reading. The 150%/300% style setting is specific to that method.
- Does it draw a box or zone spanning three candles on an ordinary price chart with no tick data loaded? If yes, it's the price-gap or fair-value-gap reading.
- Does it only appear around the market open or close, tied to a specific auction time, and require a separate data feed to populate? If yes, it's the auction imbalance.
Most retail traders only ever get a "no" answer to the first and third questions, because most retail platforms don't carry footprint or auction feeds by default. That's part of why the price-gap meaning dominates search results today. It's simply the version that needs the least infrastructure to display on a standard retail account.
Where each meaning runs out of usefulness
The price-gap reading is cheap to compute and easy to visualize. But it says nothing about who actually traded and why — it's purely a geometric statement about three candles in sequence. It also overlaps heavily with adjacent vocabulary. An "order block," a "liquidity void," and a "fair value gap" are often used by different authors to describe overlapping or near-identical chart structures. That's a separate source of confusion from the three-meanings problem this article is mainly about. If you want that vocabulary separated out cleanly, our liquidity glossary and order block breakdown deal with that overlap directly.
The footprint reading is more data-intensive and far more session-specific. It tells you something true about aggression at a price level in that moment, but it says nothing about whether that aggression will still matter an hour later. It needs a trader actually watching the tape in real time, not a set-and-forget signal running in the background. See our notes on tick data versus bar data if you're unsure whether your current data feed can even support it.
The auction reading is the most mechanically reliable of the three. It's reporting an actual, verifiable mismatch the exchange has to resolve one way or another by a fixed deadline. But it's also the least accessible of the three, gated behind data subscriptions and relevant only in a narrow pre-open or pre-close window each day. For most retail traders it's useful informational context for the open or close, not a standalone signal to build an entire strategy around.
What our own data says about "price always fills the imbalance"
This is the claim that gets repeated across almost every price-gap explainer without a single number attached to it. Closing that exact gap in the evidence is why we built our study in the first place. We tracked 500 marked fair value gaps across ES, BTC, and EURUSD. We deliberately spread the sample across an index future, a crypto pair, and a forex pair, rather than testing one instrument and generalizing the result to every market. We found that the majority of gaps did eventually see price return into their range. But "majority" is not "always," and the time-to-fill ranged from the same trading session to multiple days, depending on the instrument and the size of the gap. Reports that gaps fill within a fixed, short window don't match what we measured in our own data. Some filled within hours, some took several days, and a minority never filled at all within the window we tracked.
We'd rather send you to the primary numbers than compress them into one misleading average here. The full breakdown by instrument is in the full study. The methodology there — how the 500 gaps were marked, what counted as a "fill," and how the measurement window was set — is laid out in detail, so the result can be checked rather than taken on faith from a summary like this one.
Reading the official auction-imbalance picture
For the auction meaning specifically, the exchanges themselves are the source worth checking, rather than a third-party summary blog. The U.S. Securities and Exchange Commission publishes investor-facing material on how equity market structure and order handling actually work. The SEC's investor-education arm at Investor.gov covers the basics of how orders get matched, and why opening and closing auctions behave differently from continuous trading during the rest of the day. Neither page will hand you the live imbalance number on a given morning — that's a paid data product sold separately. But both explain the underlying mechanism in plain terms, without a vendor trying to sell you a platform in the same paragraph.
A worked example: the same word, three different screens
Picture a trader who opens three tools at 9:25 a.m. before the US cash open. On a plain candle chart from the prior session, a three-candle sequence left an unfilled range around a 15-point area on an index future — the price-gap reading, visible with zero extra data cost. On a footprint panel for the same instrument, the bid-versus-ask comparison one level away is running close to a 200% split, below the 300% level ATAS flagged in 2019 but above the shipped 150% default — the footprint reading, requiring tick data the first chart never touched. And on a market-data terminal showing NYSE's pre-open feed, a sell-side order imbalance of several hundred thousand shares is building into the 9:30 bell — the auction reading, requiring a feed neither of the first two tools carries. Three screens, three numbers, three unrelated mechanisms, and only the shared label "imbalance" to connect them on the surface. None of the three tools can read the other's data. The candle chart has no idea the footprint split exists. The footprint panel has no idea the auction feed exists. Only the trader looking at all three screens at once can see that the word means something different on each one.
A note on the overlap vocabulary
Part of why "imbalance" gets confusing is that it sits next to a cluster of terms traders use loosely. Order block, fair value gap, liquidity void, and inefficiency all get applied to roughly the same chart structure by different authors. Meanwhile "imbalance" in the footprint sense and "imbalance" in the auction sense are talking about something else entirely, several steps removed from any of that chart-pattern vocabulary. There is no universal glossary enforcing consistent use here. Each platform and each educator settles on their own convention over time. The most useful habit is the one from a few sections back: ask what data a term requires before trying to match it to a definition. The data requirement, not the name on the label, tells you which meaning you're actually looking at.
Frequently Asked Questions
Quantzee's order-flow and price-structure tools are built around treating claims like these as measurable, not assumed — including the fill-rate study referenced throughout this piece. If you want to see how we read order flow and structure in practice, our toolkit overview lays out what's included at each tier.