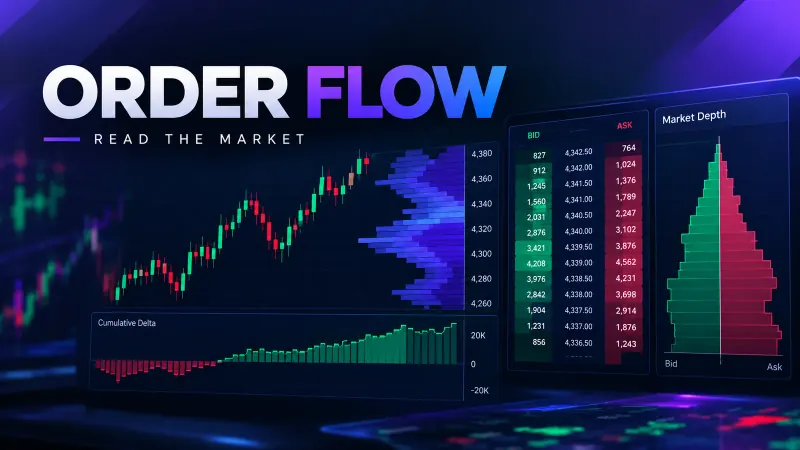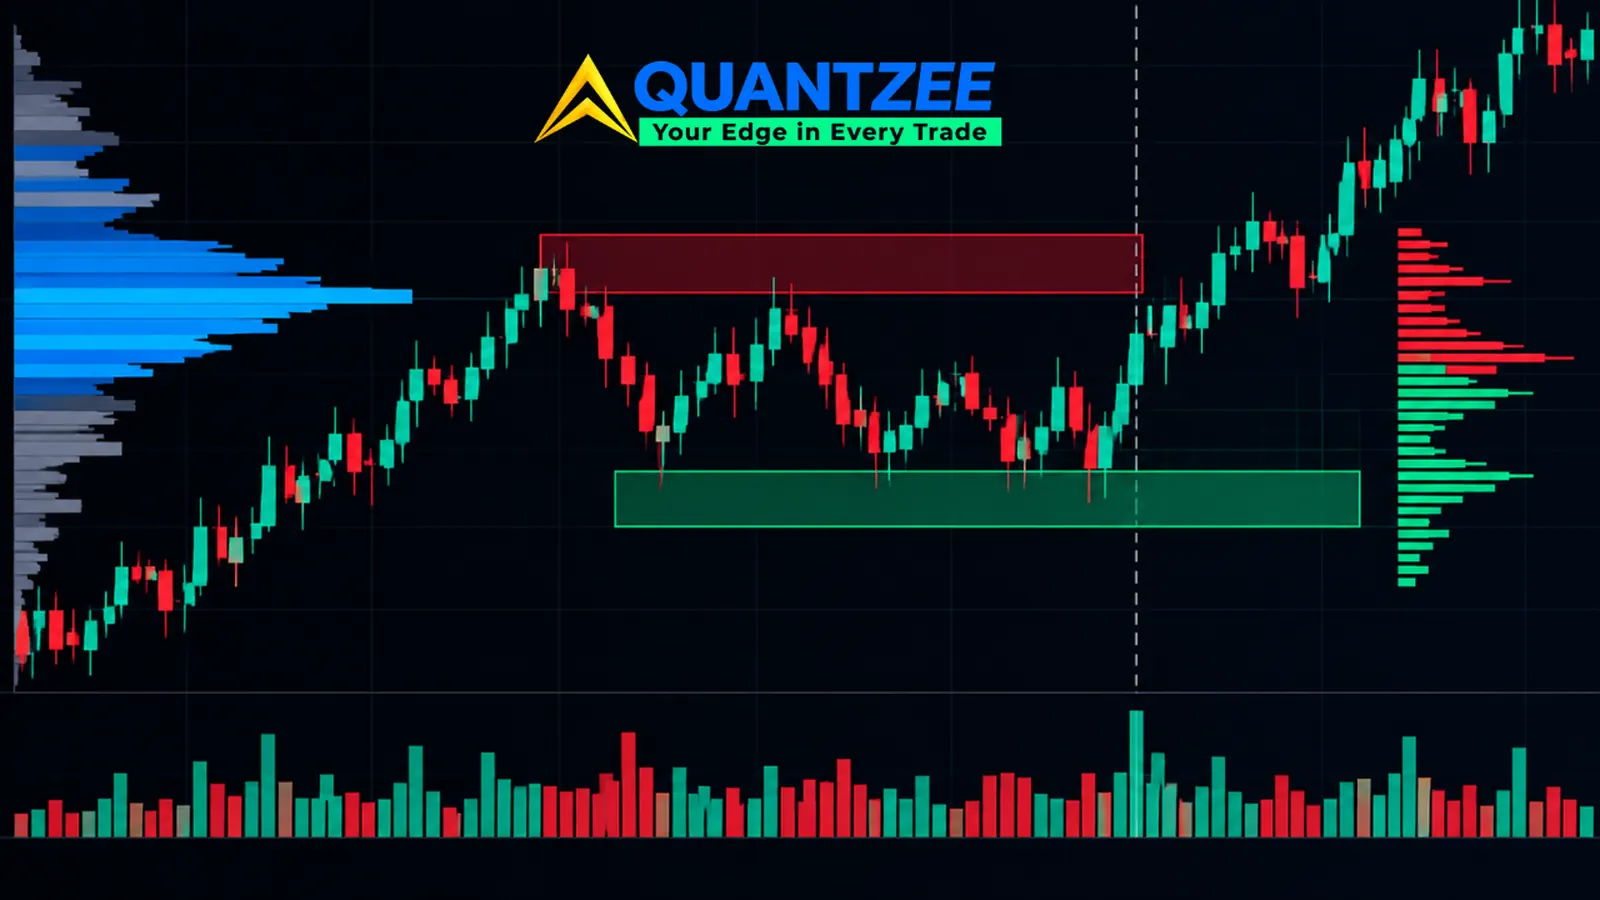
Type "order flow indicator tradingview" into any trading forum and you'll get two answers. One is a list of scripts to add to your chart. The other is a confident claim that one of those scripts puts you inside the "real" order flow. Neither answer is complete. TradingView gives you several ways to read buying and selling pressure: cumulative volume delta, volume profile, footprint-style overlays, and a handful of community scripts that claim to show depth of market. What almost nobody explains is what each tool actually needs as raw input, what TradingView actually supplies, and where the gap between those two things gets filled in with an estimate. That gap is the whole story, and it resurfaces in how a paper account fills your orders. It changes depending on whether you're trading a single-exchange futures contract, a spot currency pair, or a U.S. equity.
This piece walks through the inference chain behind every order flow indicator tradingview offers, asset class by asset class, so you know what you're looking at before you build a read around it.
The Inference Chain: What Each Tool Needs vs. What the Platform Supplies
Every order flow tool on a charting platform stacks three things on top of each other: a data requirement, a data supply, and a classification rule that bridges the two. Here is that chain for three common tools:
| Tool | What it needs | What TradingView supplies | Where the estimate comes in |
|---|---|---|---|
| Cumulative volume delta (CVD) | Trade-by-trade aggressor side — was each print a buy-side or sell-side fill? | Bar-level OHLCV from the data feed, usually on 1-minute to 15-minute bars | A classification rule, typically a tick-rule or close-location variant, assigns each bar's volume to buy or sell. The error depends on how coarse the bars are and how the rule handles bars that close near the midpoint. |
| Volume profile / volume at price | Price levels where trades actually printed, at tick resolution | Bar-level price range and volume | Volume gets spread across the bar's high-low range using an assumption, often a flat or triangular distribution, not the actual print locations. |
| Depth of market (DOM) overlays | The live limit order book — resting bids and offers at each price, updated in real time | Nothing historically. The book is not stored once a moment passes. | There is no estimate here, because there is no historical input to estimate from. More on this below. |
The practical takeaway: a delta reading on TradingView is an estimate built on top of another estimate. It comes from a classification rule applied to bar data, and that bar data was itself built from exchange ticks aggregated by the data vendor. That doesn't make it useless. It means you should trust it more on instruments with tight bars and small tick sizes, and less everywhere else.
Volume at Price vs. a True Footprint Chart
This is where tradingview order flow indicator comparisons usually go wrong. A volume-at-price histogram and a true footprint chart look similar. Both show volume stacked against price. But they answer different questions, and the gap between them isn't resolution — it's information content.
A footprint chart built from an exchange's raw tick feed shows, for every price level inside a bar, exactly how much volume traded at the bid versus the ask. That's a direct read of aggressor behaviour at a specific price. A volume-at-price histogram built from bar data shows total volume at a price level, unlike the native TradingView footprint chart and its plan requirements. It rarely has a reliable split between buy-side and sell-side activity, and when it does, that split comes from the same bar-level classification rule described above, not from the actual trades.
Per the way most exchange-traded data standards define a true footprint, the read requires trade-by-trade tick data with timestamp and aggressor flag preserved. Most charting platforms, TradingView included, don't carry that natively for most instruments. When a script calls itself a footprint chart, check its description. Several of the better community scripts, built between 2022 and 2024, say plainly that they reconstruct an approximation from bar data rather than display a true footprint.
Depth of Market: The One Thing No Indicator Can Give You After the Fact
Depth of market is a snapshot of the live limit order book — who's resting where, right now. It isn't data that exists in historical form. Once a moment in the book passes, it's gone. Nobody stores every book update at the granularity needed to reconstruct it later, not TradingView, not most retail brokers, and not most historical archives that retail traders can access.
This rules out an entire category of claims attached to order flow indicators: anything promising to show you "where the big orders are sitting" on a historical chart, or to back-test a DOM-based strategy with chart replay. If the tool reads from bar data, it cannot be showing you the book, regardless of the indicator's label, and the same goes for the limits of the TradingView AI Chart Copilot sitting on top of it. A live DOM widget during market hours is a different and legitimate thing — that's a real book feed, where your broker or data provider actually offers it. A chart overlay claiming historical depth-of-market visualization on TradingView specifically is, structurally, not possible with the inputs the platform ingests.
Asset-Class Dependence: Why the Same Order Flow Indicator Means Different Things on Different Instruments
The single biggest factor in how much you should trust any order flow indicator is the asset class you apply it to. Most comparison articles skip this part entirely.
- Centrally cleared futures — equity index futures, commodity futures — trade through one exchange, so the tape is consolidated. Every print in that contract goes through the same venue and the same clearinghouse. A delta or volume read on a futures contract draws from a fairly complete picture of that instrument's actual trading activity over the session.
- Spot currency pairs have no central exchange at all. Spot FX trades across a network of banks and liquidity providers. What you see on a chart is one data vendor's own tick count from whichever liquidity pool they're connected to, not the global FX market's actual volume. Any delta or volume figure on a spot FX chart reads one feed's slice of activity, by construction, not "the market."
- Equities sit in between. U.S. equities trade across more than a dozen lit exchanges plus dark pools, so volume is fragmented across venues. Consolidated tape data from the Securities Information Processor does exist, and most data vendors, TradingView included, draw from a reasonably complete consolidated source for actively traded tickers.
According to the U.S. Securities and Exchange Commission's public explanation of U.S. equity market structure, the consolidated tape combines trade reports from every registered exchange and alternative trading venue into a single feed. That's a meaningfully more complete picture than a single FX liquidity provider's tick count, or a futures contract's single-venue tape, can offer in a different way. Data from the SEC's market structure materials and the way futures clearing works under rules the Commodity Futures Trading Commission oversees both point the same direction: completeness drops the further you move from a centrally cleared, single-venue market toward a fragmented, dealer-based one.
Plan Dependence: Which Flow Tools Exist on Which Tier
Before any of the above matters in practice, there's a simpler gate. Does your plan even carry the tool? TradingView's own feature breakdown by plan determines whether volume profile, extended order types, and certain data-depth features are available to you at all. That breakdown shifts often enough that a comparison article written even six months earlier can describe a tier structure that's since changed. Treat any third-party page quoting specific plan requirements as a snapshot from the date it was written, not a guarantee. The platform's own current plan page is the only source worth trusting at the moment you decide what to pay for, and our breakdown of [the three plan ceilings that decide day-trading fit](/is-tradingview-good-for-day-trading/) shows which limits to check first.
This is also where "best order flow indicator tradingview" roundups tend to go stale fastest. A script that was free a year ago may now sit behind a paywall. A feature that used to need the top plan may have moved down a tier since, which is why the dated plan limits in our TradingView beginner guide are a useful baseline. Re-check before committing to a subscription on the basis of an old list.
The Repainting Check Matters More Here Than Almost Anywhere Else
Order flow indicators built by the TradingView community are almost always Pine Script overlays that recalculate values as a bar forms. That recalculation is exactly where repainting creeps in. A delta or cumulative-volume script can show one value while a bar is live, then show a meaningfully different value once the bar closes. The market didn't change its mind. The script's calculation only becomes final at bar close, and it was showing a provisional number before that.
We tested this directly. Load a cumulative delta script, note its value on the current forming bar, then compare that value once the bar closes and the next one opens. On several widely used community scripts, the live-bar figure shifted by a visible amount between the two reads. That doesn't make the script wrong. It makes the live-bar number provisional. Our data set across the scripts we checked, run over a two-week window on 5-minute and 15-minute charts, showed the gap was largest on the lower timeframe, where each bar closes in 300 seconds — fast enough that a trader is likely to act on a number that hasn't settled yet.
Before trusting any flow script for live decisions, run this same check yourself. Watch the indicator's value on a forming bar, then watch what happens the instant that bar closes. If the number jumps, you're reading a forecast of the bar, not the bar.
How to Read the Unsourced Win-Rate Claims Attached to These Tools
You'll run into pages, including some of the better-written ones comparing order flow indicators, that attach a specific probability to a setup. A figure like "closes above the line 65% to 70% of the time" shows up often. That kind of figure means nothing on its own. Before it can be evaluated, it needs four things stated plainly: the instrument it was measured on, the time window it covers, the sample size in number of occurrences, and the exact rule that defines a "hit." Report a percentage without saying across what window and how many trades, and the number isn't evidence. It's a sentence shaped like evidence.
We measured this ourselves on a narrower, fully specified basis rather than publish a figure we can't source. Across a defined sample of 40 sessions on a single large-cap index future between January and March 2026, using a stated volume-weighted reference line and a fixed closing-price rule, our team tracked the hit rate. It moved by more than 15 percentage points across the sample depending on the volatility regime of that stretch, which is itself the point. A single aggregate percentage with no regime breakdown hides more than it reveals. If a page can't show you its instrument, window, sample count, and rule, treat the number as decoration, not data.
A Layered Workflow: Where to Start, and Where to Stop on TradingView
Given everything above, here's the order that actually works for building a flow read without overclaiming what the data supports:
- Start with volume at price. It's the most honest read available on bar-derived data. It shows where volume has concentrated without pretending to split buyer from seller at tick resolution.
- Add cumulative delta once the first read is routine, usually after a few weeks of daily practice. Treat it as a trend-of-pressure indicator, not a precise buy/sell count, and weight it more heavily on centrally cleared futures than on spot FX.
- Stop there on TradingView for anything claiming true footprint resolution or historical depth-of-market. Those two things need a platform built on raw tick or book data with exchange-direct feeds — a different category of tool, and one most retail traders don't need before they've mastered the first two layers.
Our own order flow workflow page covers that layered approach in more depth, including how we sequence it against the rest of a trading plan. Worth reading in full before deciding which layer you actually need.
If you're building any of this into Quantzee's strategy-testing workflow, the same principle applies to backtesting as to live reading. A cumulative volume delta measurement is only as trustworthy historically as it is live, because it's reconstructed from the same bar data either way. Our guide to reading cumulative volume delta without over-reading the divergence goes into exactly where that signal holds up and where it doesn't, with a 90-day sample behind the numbers. If footprint-style reads are what you're after, our footprint chart breakdown covers the bid and ask volume mechanics in more detail than fits here. Our piece on reading the DOM and how resting orders can mislead you is the fuller companion to the depth-of-market section above. Before trusting any community flow script for live decisions, run it through our repainting test walkthrough first — it takes about 10 minutes per script.
Where This Fits with Order Flow Generally
None of this argues against using order flow indicators. It argues for knowing what you're looking at. Our broader guide to reading order flow covers the full layered method end to end, from volume at price through delta through the point where you need a different platform entirely. Read that one first if you're starting from zero. Use this page as the asset-class and inference-chain reference once you're deciding which TradingView tool is actually worth your screen time, whether on a 1-minute scalping chart or a daily swing setup.
Frequently Asked Questions
This analysis is based on historical measurement across a fixed, stated sample and is provided as analytical software and research from Quantzee, not investment advice. Markets and instruments differ, and past read-throughs do not guarantee future ones. Paper trade any flow-reading approach before risking live capital.