How the simulator sources its price, and what the feed delay does to it
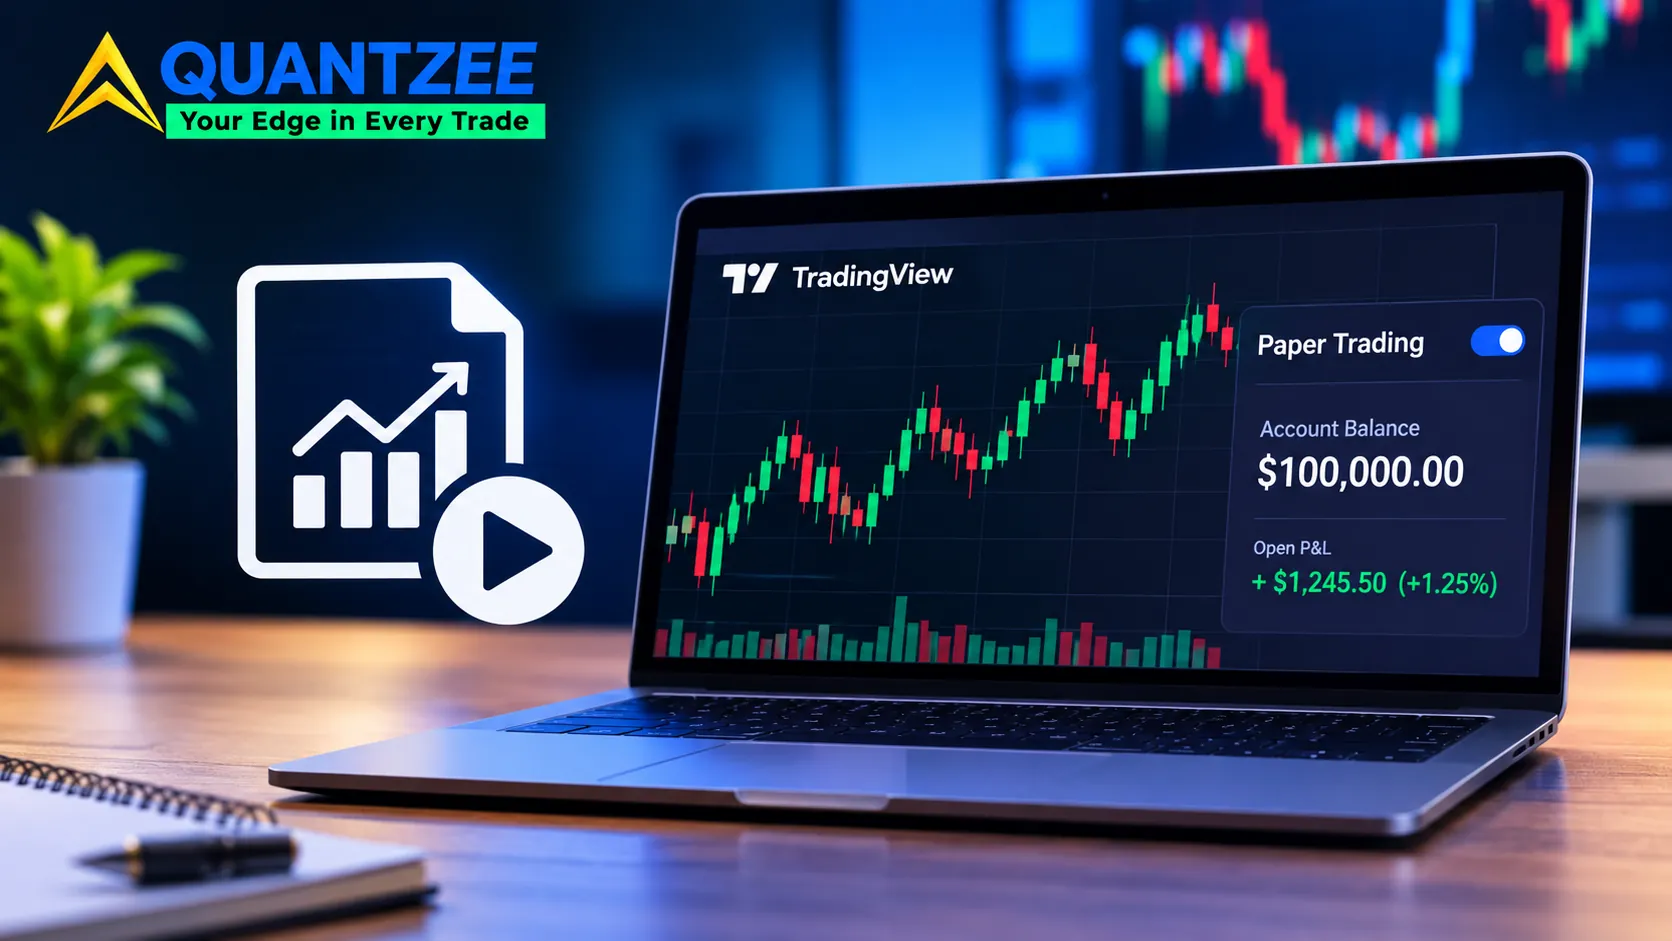
TradingView's paper trading account matches your order against the quote already on your chart. There is no separate matching engine behind it, and no real order book. The simulator reads the price feed you're subscribed to and fills you at, or very near, that price the instant your order hits the panel. For a market order, the fill price is whatever print is on screen. It is not a price discovered by actually competing with other orders.
That's fine on a real-time data plan. It stops being fine on the free plan, where U.S. equities and several other feeds run on a delay — commonly 15 minutes, per the delay figures retail education sites quote for free-tier access. A paper fill built on a 15-minute-old quote isn't a small rounding error on a 1-minute chart. It can be a completely different candle. If you're testing an intraday entry rule on the free plan, every fill from that session is sourced from a price your broker's systems never saw at the moment you clicked buy. We've seen traders run a week of "backtesting" this way and never notice. The equity curve still moves. It still looks like data.
The fix isn't complicated. Confirm your plan tier and your feed status before you log a single paper trade. If the symbol is delayed, treat every fill timestamp as approximate. A sample built on approximate fills can still teach you about your own decision-making. It just can't tell you anything about execution.
What the fill model leaves out: spread, queue, partial fills, and gaps
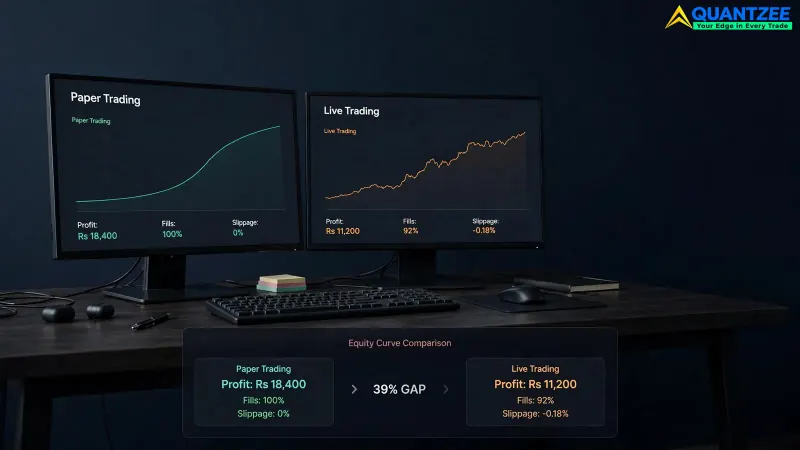
A live order doesn't just get the quoted price. It pays the bid-ask spread, waits in a queue behind every other order already resting at that price, and sometimes gets only part of its size filled before the market moves away. According to the Options Industry Council's explainer on bid and ask pricing, the bid is the highest price a buyer is currently willing to pay and the ask is the lowest price a seller will accept. The gap between them is a cost paid on every round trip, in both directions, win or lose. The TradingView simulator doesn't model any of that for you.
Four specific gaps matter most:
- Spread. A market buy fills at the ask, a market sell at the bid, every single time in live trading. The simulator fills both at the same mid-level price. A strategy that trades often will look artificially better in paper than it can ever be live.
- Queue position. A resting limit order in a real book sits behind every order placed before it at the same price. The paper account has no concept of priority. If the price touches your limit, you're filled, regardless of size or timing.
- Partial fills. Illiquid names and large size routinely fill in pieces live. TradingView's paper engine fills the whole order size at once or not at all. That erases a real source of P&L variance.
- Gaps. A stop placed before a weekend or an earnings print can jump straight through in a live account, filling well past the trigger. Whether the simulator reproduces that gap risk accurately isn't documented publicly by TradingView. The honest answer is that we don't know, and neither does anyone citing a specific number for it. What you can observe yourself is whether a stop placed ahead of a known gap event fills at your price, or somewhere worse, once the market reopens.
Each of these pushes in the same direction: live execution is worse than the simulated fill, almost never better. That asymmetry is the single most important thing to carry forward from a paper record.
Commission at zero corrupts every number you compute from it
Open the paper trading settings and the default commission field is blank — zero. That one setting quietly breaks every statistic you compute afterward: win rate, average winner versus average loser, payoff ratio, expectancy. A strategy that takes forty trades a month and nets a small edge per trade can look profitable with zero friction. It can lose money the moment real costs are applied, because the costs scale with trade count and the edge usually doesn't.
Real commission schedules vary by broker and instrument, and they're worth checking rather than guessing. Interactive Brokers' published IBKR Lite schedule lists options commissions at $0.65 per contract with no base fee. Tastytrade's published pricing charges $1 per contract to open an equity option, capped at $10 per leg, with $0 to close. Neither number is universal. Your own broker's fee schedule is the one that matters for your account. But both show the same thing: options commissions are a real, line-item cost that a zeroed-out paper account simply deletes from the picture. Multiply either figure across your real trade frequency and position size before trusting a paper win rate.
Set the commission field to something before you run a session, even if it's an estimate. A wrong-but-nonzero number teaches you more than a correct-but-zero one, because at least the shape of the cost curve is visible in your results.
Does TradingView have paper trading for options?
Yes, but with real limits worth knowing before you build a strategy around it. Paper trading on TradingView covers a wide range of instrument classes, depending on your connected broker integration and your TradingView plan. Stocks, futures, forex, and crypto all have straightforward simulated order flow, though trading futures on TradingView with a live broker adds data and contract-month issues paper hides. Options support is narrower. It depends on the specific broker-data connection you have paper trading linked to, and it is not uniformly available across every account the way equities and futures are, per TradingView's own support documentation on connecting a paper trading account. If your strategy is options-specific, confirm your exact connection supports simulated options fills before you log a single trade. Don't assume parity with the equity or futures paper experience just because the panel looks the same.
Resetting the balance mid-sample throws away the only thing the exercise produced
The paper account lets you reset your balance back to the default at any time, and that convenience is exactly what destroys most paper trading records. The entire value of a paper log is the unbroken sequence of decisions and outcomes it contains. Reset the balance halfway through a bad stretch, and you've deleted the drawdown that would have told you the most about your own rule-following under pressure. Our own rule, when reviewing a trader's paper log, is simple. A reset in the middle of an open question — does this strategy hold up over a full month, does this trader follow their own stop — means the sample starts over at zero. It does not mean the bad trades quietly disappear.
If you're going to reset, pick a defined boundary in advance: the start of a new month, the start of a new strategy test. Write down why, before you do it. A reset that happens because the number on screen felt uncomfortable is a tell that the sample was working.
Three adjustments that make a paper record comparable to a live one
None of this means paper trading on TradingView is a waste of time. It means the raw P&L column needs three adjustments before it tells you anything close to the truth:
- A spread charge per round trip. Apply a fixed estimate — even half a tick on a liquid future, a few cents on a popular stock, or the published commission on an options contract — to every entry and exit. This alone usually cuts a flattering paper edge in half.
- A slippage allowance sized to the instrument. Thin, low-volume names need a bigger allowance than a heavily traded index future or large-cap stock. Size the allowance to what you've actually seen that instrument move between your signal and a realistic live fill. Don't borrow a flat number from a different market.
- The same position size you would actually take live. Paper accounts make it easy to size up, because there's no real capital at risk and no real margin call. Trade the size you'd commit with real money, or the P&L curve is measuring a different trader than you.
Run those three adjustments against a paper log and you get something close to a believable forecast of live performance — still not a guarantee, but a number built on the same cost structure a live account actually pays.
What to log per trade, and the minimum sample before it says anything
A paper record only answers a question if you decide the question before you start logging. For each trade, record the signal that triggered entry, the price you were quoted versus the price you'd realistically get live after spread and slippage, the size, and the exit reason — target, stop, time, or discretion. Also record whether you followed your own plan or deviated. That last column catches more strategy failures than any number on the P&L line. In our experience, a trader's deviation rate predicts live results better than their paper win rate does.
On sample size: a handful of trades proves nothing either way. Our methodology for reviewing a trader's paper log starts with a sample of at least 30 trades, logged with the cost adjustments above already applied, covering more than one kind of market condition rather than one calm week. FINRA's guidance on execution quality exists precisely because a handful of good or bad fills tells you about that moment, not about the strategy. Four to six weeks of consistent logging is a more honest minimum than any single round number, especially when the adjustments are applied from day one instead of bolted on afterward.
The specific failure case: a strategy that only works because of a fill the real book never offers
Here's the trap in its purest form. You backtest or paper-trade a limit-order strategy that buys slightly below the current price and sells slightly above it, scalping the spread. In the simulator, every limit order that touches the quoted price fills. There's no queue, so touching the price is the same as getting the trade. Live, that same limit order sits behind every other resting order already there first. The price can touch your level and reverse without you ever being filled, especially in the fast moves where the strategy most wants to trigger.
The paper account will show this strategy working, sometimes for months, because it rewards exactly the behavior that the real market doesn't reward the same way: placing a limit at a level that gets touched. The tell is a strategy whose paper performance depends heavily on limit fills at favorable levels in fast-moving conditions. If removing those specific fills from the log collapses the edge, the edge was never real. It was a property of the simulator's queue-free fill model.
Turning TradingView's paper account into something worth keeping
At Quantzee, we build analytical tools for traders who already understand that a strategy's number on a screen and a strategy's number in a live account are two different things. See our note on the backtest-vs-live trading mismatch for the broader version of this problem across backtesting generally, not just paper accounts. A paper log, treated correctly, is a decision record. It tells you whether you follow your own rules, whether your sizing holds up under a losing streak, and whether your entries are as good as you think once a realistic slippage figure is subtracted from every one of them.
Pairing that decision record with a written log matters more than most traders expect. See our piece on how a trading journal habit affects win rate for why the logging habit itself changes outcomes, independent of the strategy being tested. And if the paper log is feeding into a more formal test of an indicator-based rule, our walkthrough on backtesting a TradingView indicator covers how to extend this same cost-adjustment thinking into a full historical backtest.
The simulator itself hasn't changed in the ways that matter. There's no spread. There's no queue. Commission defaults to zero. The fill model is documented nowhere in detail by TradingView. What changes the value of the exercise is what you do with the output: adjust it, log it honestly, and treat the raw P&L number the way the SEC's own investor bulletin on day trading treats unadjusted results generally — as a number that needs real costs applied before anyone acts on it.
Frequently Asked Questions
Changelog
Published November 2026. Reviewed against TradingView's current support documentation for paper trading connection, default balance, and plan-tier data rules at the time of writing.
Paper trading NIFTY options? The NSE options guide has a worked round-trip cost you can apply by hand to your paper log.