The TradingView footprint chart is a native chart type that you can load on the Premium and Ultimate plans, and on no lower tier. That's what TradingView's own pricing page shows as of 5 November 2026. Free, Essential and Plus accounts see a cross in the Volume footprint row. If you're on one of those three, the chart type won't load, and the only footprint-style views you'll get are community scripts, which are a different thing (more on that below).
That's the short answer. The longer one matters more, because two pages that rank for this exact search disagree with each other, and neither explains what the two columns in a footprint actually count. This post gives the plan answer with a date on it, then walks through how a bid/ask split gets produced, where it's a measurement and where it's an estimate, and what a footprint can't show you however clean it looks.
Which TradingView Plans Include the Footprint Chart?
We compared TradingView's pricing page with the two dedicated articles on this topic. The pricing page has a feature row called "Volume footprint" under the Orderflow group, and each plan column carries a tick or a cross. Here's what it showed when we read it on 5 November 2026:
| Plan | Volume footprint chart type |
|---|---|
| Basic (free) | Not included |
| Essential | Not included |
| Plus | Not included |
| Premium | Included |
| Ultimate | Included |
Two other places on TradingView's side say the same thing. The launch post for the chart type, dated May 14, 2024, describes it as available "for Premium and higher-tier plans." A later post about footprints in Pine Script, dated March 2, says "in order to use these footprint features, you'll need to have a Premium or Ultimate plan." Three TradingView pages, one answer.
Now the contradiction. According to the notes we took on the two competing articles, one of them (updated September 14, 2026) says the native footprint starts at the entry paid tier. The other (updated June 17, 2026) says Premium or higher is required and that free, Essential and Plus users can't load it. Both can't be right, and the pricing page sides with the second. The first page may be describing a promotion, a past plan layout or something we haven't seen, and we can't tell which. What we can say is that the tier it names doesn't match TradingView's table today.
Plan tables move. TradingView has rearranged features between tiers before, and a table like this one goes stale quietly. Treat the date above as part of the answer. Before you pay for an upgrade just to get this chart, open the pricing page, scroll to Orderflow, and read the Volume footprint row yourself. It takes under a minute and it's the only source that can't be out of date.
One more wrinkle worth knowing. Subscribing to a plan doesn't guarantee a footprint on every bar of every symbol. TradingView's launch post says the chart "will display a footprint for each bar with available intrabar volume data." The plan unlocks the chart type. The data decides what it can draw. If you've read our breakdown of data subscriptions versus plans, this is the same split showing up again: the plan and the market data are two separate purchases.
What a Footprint Bar Actually Shows
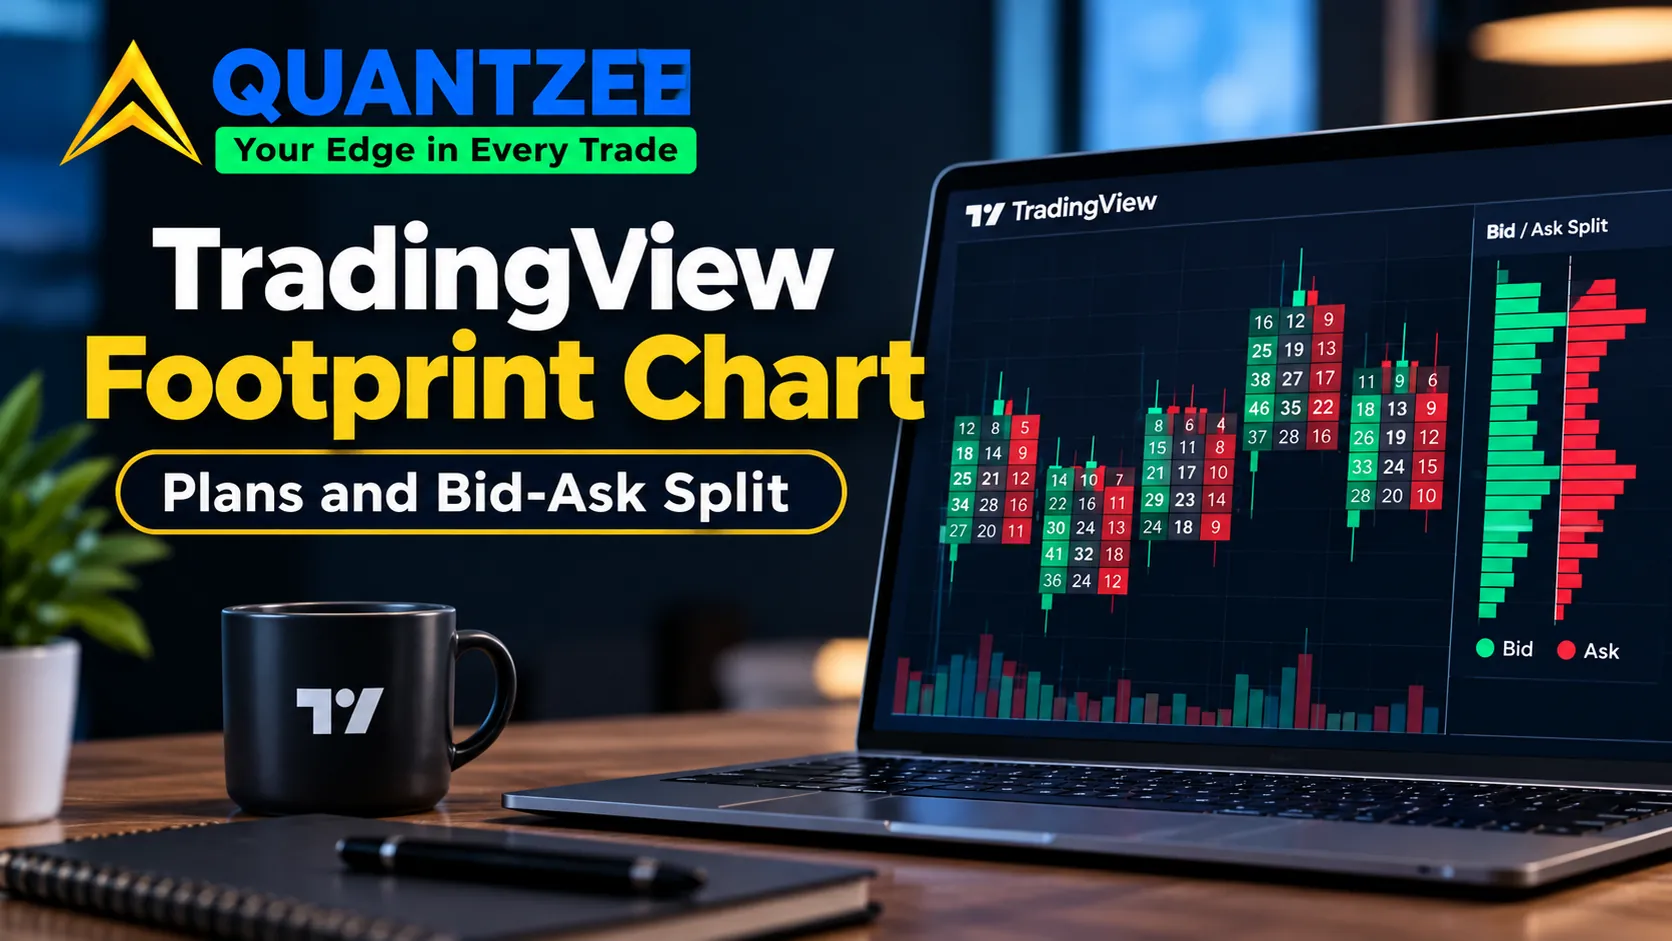
A normal candle gives you four prices. A volume profile gives you how much traded at each price, with no idea who was pushing. A footprint sits between them and adds the missing piece. For every price level inside a bar, it shows two numbers: volume on the sell side and volume on the buy side. Add them for a total at that price, subtract them for a delta, and roll the whole column up into a bar total and a bar delta.
TradingView's default layout puts selling volume on the left of each bar and buying volume on the right, shades the cells by intensity, marks the Point of Control (the price with the most volume in the bar), and prints delta and total volume under the bar. That's the visual. The reading method, meaning how to tell absorption from a real push and what an imbalance stack suggests, lives on our main footprint guide, and we won't repeat it here. This post stays on the tool question.
The useful contrast is with the volume profile. A profile tells you 12,400 contracts traded at 5,310. A footprint tells you 7,100 of them hit the ask and 5,300 hit the bid. Same total, very different story, and it only exists if the chart knows which side each trade belongs to. Which brings us to the part nobody explains.
How Is the Bid/Ask Split Calculated?
Here's the honest limit of what TradingView's public pages say: none of the three we read explains the method. The Pine Script post describes the output as "exact" buy (ask) and sell (bid) volume totals for the bar and at specific price levels. The launch post says the chart uses intrabar volume data. Neither states whether the side comes from an executed-trade flag on the feed or gets worked out afterwards. We looked for that sentence and didn't find it, so we're not going to invent it.
What we can do is lay out the two ways any footprint, on any platform, can get its split. They produce different objects.
Method one: the feed carries the aggressor
Some venues report, with every trade, which side was the aggressor, meaning whether a buyer lifted the offer or a seller hit the bid. Futures exchanges that publish trade-level data are the clearest case. If your feed carries that flag, the footprint is a count. A trade marked as buyer-initiated goes in the ask column, full stop. Nothing is guessed.
Method two: the side is inferred
Many instruments don't come with that flag. Then the software has to classify each trade after the fact. The simplest rule is the tick rule: if the trade printed above the previous price, call it a buy; below, call it a sell; equal, copy the last decision. A fancier version compares the trade price to the prevailing bid and ask quotes. Both are estimates.
How good are they? The best-known test is Ellis, Michaely and O'Hara's study of Nasdaq data where the true direction was known. According to the RePEc record of that paper, the Lee-Ready rule classified 81.05% of trades correctly, the tick rule 77.66% and the quote rule 76.4%. Read that the other way: roughly one trade in five was put on the wrong side even by the best rule, on an older Nasdaq dataset. The errors weren't evenly spread either. The paper reports that all the rules did poorly on trades executed inside the quotes, which skews results for large trades, busy periods and electronic-network trades. Those are exactly the moments a footprint reader cares about most. A paper on Lee-Ready accuracy, hosted by Cornell, reports misclassification rates of up to 32% on certain trade types when quotes and trades were matched closely, though daily totals looked far better than individual prints.
That matters for how you read a footprint. If the split is inferred, a fast move where price jumps several ticks on one print, or a moment when the quotes cross, can push volume into the wrong column. Your delta number then carries an error you can't see on the chart. The cell still shows a clean "412 x 389", and nothing flags that some of it is a best guess.
Our position, stated plainly: until TradingView documents which method applies to which instrument, treat the split on any symbol as unconfirmed. Check the help-center page for the chart type, and for futures, check whether your exchange data package carries trade-level information at all. That last part is why this chart tends to behave differently on a CME contract than on a spot FX pair, where there's no central tape and so no single set of trades to count.
Historical Bars Versus Live Bars
Can you scroll back and read last Tuesday's session the way you read today's? This is a question we can only half answer. The sources we read don't say whether historical bars are built from the same resolution as live bars. The Pine Script post adds one concrete clue: if no footprint data is available for a bar, the request returns na. So some bars simply won't have a footprint, and a script has to check for that.
Practical consequence: don't assume the history behind a study is as fine-grained as the live data in front of you. If you plan to review sessions from three or six months ago, load a handful of old bars first and see which ones draw. Missing footprints on older bars tell you what the data covers, so don't mistake them for a glitch. And never compare a signal's behaviour on recent bars with its behaviour on old ones until you've confirmed both were drawn from the same kind of data.
Repainting is the same question from another angle. A live bar's cells change as trades arrive, which is normal. What you want to know is whether a closed bar's cells can change later, and TradingView's pages we read don't say. We won't claim either way. If it matters to your process, watch a closed bar across a reload and write down what you see.
The Community Pine Script Route
If you're on Essential or Plus, you'll find plenty of community "footprint" indicators in the script library. They run on lower plans, they look convincing, and they aren't the native chart type. A script only gets what Pine hands it, which is bar-level data from the chart or from a lower timeframe it requests.
From the script descriptions we read, community versions split volume in a few ways:
- Give a bar's entire volume to buyers if it closed up and to sellers if it closed down.
- Divide volume by where the close sits inside the high-low range.
- Scan a lower timeframe and sort those smaller bars into up-volume and down-volume, which is the idea behind Pine's
ta.requestVolumeDelta().
One script author describes their split as an estimated representation of buy and sell activity, not true transaction-side volume, which is a refreshingly straight label. Each of these methods is a rule applied to candles. None of them has seen an individual trade. A script that infers the split from one-minute bars is working from a coarser picture than a tick-level count, and it can look identical on screen: same two columns, same colours, same delta row. The visual hides the difference.
So when a community footprint tells you delta was +900 at a level, ask what produced that number before you lean on it. We've seen readers treat a script's output as an exchange-reported fact simply because the cells were neatly shaded. They're not the same kind of number, and the gap grows the lower the timeframe you try to read.
A side note on trust: one popular community footprint script publicly corrected its buy/sell orientation after a user pointed out the sides were swapped. Scripts get fixed in public, which is good, but it also means the side convention is worth checking on any script before you read a single delta.
Crypto and Aggregated Symbols: One Venue Isn't the Market
On 24-hour instruments the most common misreading has nothing to do with the plan or the maths. A footprint built from one exchange's trades describes that exchange. Bitcoin trades on a dozen major venues at once, and a chart tied to a single venue's tape captures only the slice that traded there. A big sell-side delta on one venue can be matched by buying somewhere else.
The same applies to any symbol that blends several venues into one feed. Before you treat a heavy imbalance as market-wide, check which source the symbol draws from. If it's a single exchange, the footprint is an accurate picture of that exchange and only a partial one of the market. Our piece on how order-flow indicators on TradingView infer what they show goes through the chain of assumptions in more detail.
What a Footprint Cannot Show
Even with a perfect, exchange-reported split, three things stay invisible.
Orders that never traded. A footprint counts executions. A large resting order that sat at a price and was cancelled before anyone hit it leaves no trace. Neither does a stack of orders that stopped price from reaching a level at all. That information lives in the order book, and the book has its own failure modes, covered in our guide to reading the DOM. If you want the plain definition, see the glossary entry on market depth.
Intent. A buy at the ask is an aggressive buy. It doesn't say whether the buyer is opening a position, closing a short or hedging something else. Footprint reads describe pressure at a price, and anything about who or why is a story you've added.
Cause. A heavy ask-side print followed by a rally looks like cause and effect. Sometimes it is. Sometimes the same orders would have been filled anyway. This is why we keep pairing footprint reads with other order-flow tools, for example cumulative volume delta, and why our order-flow overview treats each tool as one witness rather than a verdict. If a term in this post is unfamiliar, the glossary has a short page on order flow.
When a Dedicated Flow Platform Is the Honest Answer
TradingView's native chart type is a solid starting point, and for many readers it's enough. It has gaps, though. Going by TradingView's own descriptions, the chart gives you a default layout with colour intensity, a Point of Control and delta under each bar. Features that dedicated order-flow software often provides, and that we didn't find in the TradingView pages we read, include:
- Fully configurable cells, for example showing delta only, or bid and ask side by side in a custom layout.
- Cell filters that hide anything under a volume threshold.
- Automatic stacked-imbalance detection across consecutive price levels.
- A professional time-and-sales tape alongside the chart.
If your process depends on those, the native chart may feel limiting, and a purpose-built platform is a fair next step. We aren't recommending one here, and the right choice depends on the markets you trade and the data package you can get. The point is narrower: know what you need before you pay for an upgrade tier to get a chart that might not do it.
A Worked Example of Why the Source Matters
Take one price level inside a 5-minute bar on an index future. The cell reads 412 on the bid side and 389 on the ask side, so the level's delta is -23 and its total is 801. Now suppose the feed was inferred and 18% of those prints were put on the wrong side. That's about 144 contracts moved from one column to the other. In the worst case all of them belong on the ask side, which would flip the delta from -23 to roughly +265. The picture changes from mild selling to clear buying, and the chart looks exactly the same.
Real errors rarely land all in one direction, so that's an upper bound, not a forecast. The lesson is smaller and more useful: a level with a delta of -23 is a coin flip under any estimated split, and only a large, lopsided cell can survive a 15 to 20% error rate. That's one reason readers who care about imbalance ratios of 3 to 1 or more tend to ask harder questions about their data than readers who glance at the colours. The ratio is the signal. The number behind it has to be one you can trust to within a few percent.
Think about what that means for a stack of 3 or 4 consecutive imbalanced levels. If each level is individually uncertain, a stack is only as reliable as the weakest assumption underneath it. Check the feed first, then trust the pattern.
A Short Checklist Before You Rely on a Footprint
Run through these five checks, in order, the first time you load one on a new symbol:
- Confirm your plan shows a tick on the Volume footprint row of the pricing page, not an old article.
- Find out whether the symbol's feed carries trade-level data or whether the side is estimated.
- Load several bars from the past 3 months and see whether history draws the same way live bars do.
- Identify which venue the symbol comes from, and whether it covers one exchange or several.
- Decide what you'd do if the split were wrong for 20% of the volume. If the answer is "nothing changes", the footprint was never carrying your decision.
Our methodology for this post was simple: we read TradingView's pricing page and two of its published posts on the feature, compared them with the competing articles, and recorded the date. No performance claim appears here because we have no test behind one, and none is needed to answer the question. Quantzee builds analytical software for chart analysis and order-flow study. Nothing in this post is advice, and a footprint reading is information about past trades, not a prediction. If you're new to this kind of chart, practise on a paper account first.