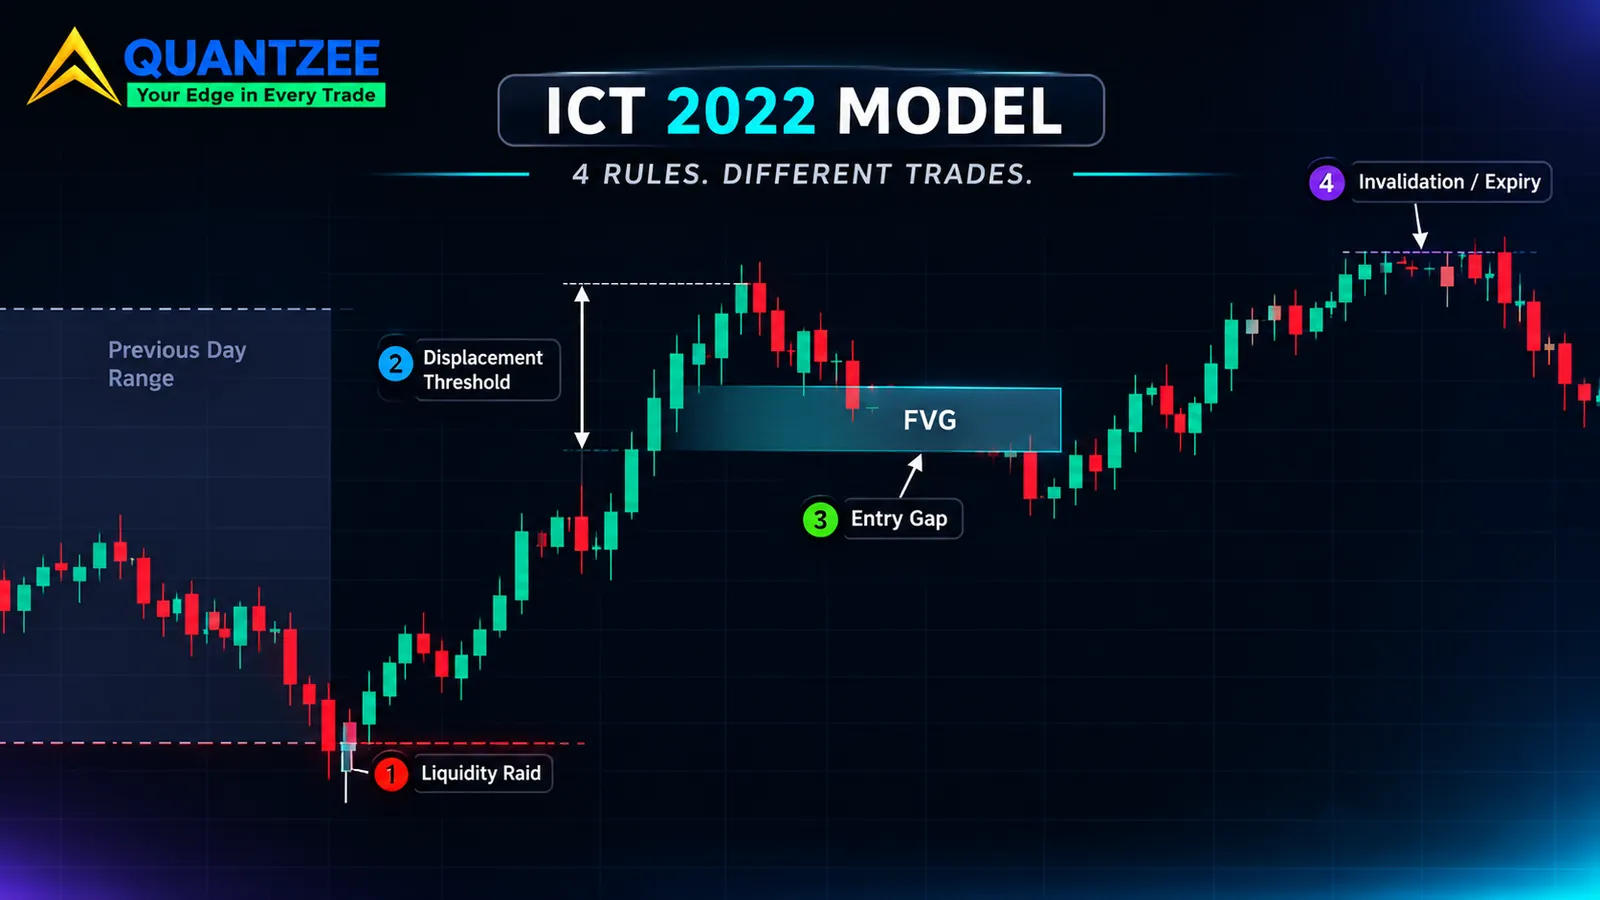
The ICT model that most people mean by "the 2022 model" fits in one sentence. Price raids a pool of resting orders, snaps back with a large move that breaks structure, leaves a gap behind, retraces into that gap, and then runs toward the opposite pool. Every guide you'll find tells you that sequence. Almost none of them tells you the numbers that make it a rule instead of an opinion.
Paper trade first. Everything below is a proposal for you to test on a demo chart, not a signal, not advice and not a performance claim. Quantzee builds analytical software, and nothing in this post says what the model will earn.
Here's the short version. The model is not a strategy until four joints are pinned to numbers: which pool is the target, how large the displacement must be, which gap is the entry, and when the setup is dead. Pin those four before the session opens and you have something you can test. Leave them open and you have a story you can fit to any chart after the fact. By the end you'll have four numbers to write down and a worked example showing how much the answer moves when the numbers change.
What the ICT model is, stated once and plainly
The sequence has five beats. We'll use a long setup; flip everything for a short.
- Raid. Price trades through a level where stop orders are assumed to be resting, such as a prior-day low or a pair of equal lows.
- Structure shift with displacement. Price reverses and breaks the most recent swing high, with a large, one-directional move.
- Gap. That move leaves a fair value gap: three candles where the first candle's high sits below the third candle's low.
- Retrace. Price comes back into the gap. That's the entry.
- Target. The opposing pool, usually the prior-day high or an old swing high.
The "2022" in the name is simply the year the mentorship material was published. It isn't a version number for the market, and nothing about price behaviour changed that year. It's a label for a teaching package. Treating it as a vintage of a trading system gives it more authority than a date deserves.
If you want the wider vocabulary first, our one-page map of the ICT framework sorts every term into vocabulary, timing and execution layers and shows which ones overlap. This post goes the other direction. It takes one named model and asks where it stops being specific.
Why the beats aren't the hard part
We compared the four pages that currently sit around this keyword. Three of them walk through the five beats in numbered steps. The fourth covers a breaker-plus-gap variant of the entry. All four agree on the sequence, and they agree because the sequence is easy to describe.
The useful sentence on that results page comes from the LuxAlgo library entry. According to LuxAlgo, "the model is discretionary at every joint: which pool counts as the draw, how much energy qualifies as displacement, and which gap is the entry all vary by operator, so two traders can run Model 2022 on the same chart and take different trades." The same page adds that no published, independently audited track record exists. You can read it at the LuxAlgo library.
That is an honest admission, and it points straight at the gap. The page names three joints. We count a fourth, and it matters as much as the others: the point where the setup is dead. None of the four pages we compared defines a threshold for any of them. Nobody tells you what "enough" displacement is in a number, or what "the" gap means when the move leaves two. One of those pages states a specific clock time per session, which is a start, but a clock time is a filter, not a rule for the three joints that actually decide the trade.
So let's take the joints one at a time.
Joint one: which pool is the target
"Raid a resting pool" sounds clear until you look at a chart. On a typical morning there are several candidates at once. The prior day's low. The low made in the London session. A pair of equal lows from last Thursday. A swing low from two hours ago.
Each of these is a defensible "pool". They sit at different prices. A raid of one is often not a raid of the others, so which one you named decides whether the setup exists at all.
Here's the trap. If the rule lets you pick the pool after the move, any reversal can be matched to some level it technically swept. The model then explains every reversal and predicts none. A rule with no way to be wrong has no testable edge. It also can't lose, which should make you suspicious rather than happy.
The fix is boring. Before the session, write down the list of eligible pools and keep it short. Our own default proposal is two: the prior-day high and the prior-day low. Session extremes and equal highs or lows can be added later as separate, counted variants, each declared in advance. A shorter list means fewer setups, and that's the price of being testable.
The related idea of a four-bar sequence that separates a real sweep from a breakout is covered in our post on the anatomy of a liquidity sweep. Use it to decide what counts as a raid once the pool is named.
Joint two: how big is "displacement"
Displacement is the word doing the most work with the least definition. Guides call it "aggressive", "energetic" or "institutional". None of those is a measurement.
There are three measures people actually use, and any of them can be written as a single line of code:
- Range multiple. The candle's high-to-low range is at least 1.5 times (or 2 times) the average true range over the last 14 bars.
- Body-to-range ratio. The body is at least 60% or 70% of the full range, so the candle closes near its extreme.
- Structure close. The candle closes beyond the opposing swing point, not just wicks through it.
They disagree with each other on ordinary charts. A wide candle with a long wick passes the range test and fails the body test. A modest candle that closes cleanly above a swing high passes the structure test and fails the range test. Our post on measuring displacement instead of eyeballing it puts the three definitions side by side and shows what each one flags and misses.
For this model, our proposal combines them: range of at least 1.5 times ATR(14), a body of at least 60% of the range, and a close beyond the last swing point. All three, because "and" removes the arguments. The numbers themselves aren't sacred. What matters is that they're written down and fixed before you look at the chart.
Joint three: which gap is the entry
A displacement leg is often several candles long. Three consecutive candles make one gap; five make up to three. The leg usually leaves more than one.
The usual guidance says "enter on the fair value gap". Which one? The first one formed, at the base of the move? The largest? The one that overlaps the level you broke? Each is reasonable. Each has a different entry price and a different stop distance, so each produces a different reward-to-risk ratio on identical candles.
The rule has to be chosen before the retrace happens. If you choose after, you'll pick the gap that price happened to touch and your entry will look prescient. Our default proposal is the first gap in the leg, entered on a limit order at its near edge. It is the simplest rule to apply and the hardest to bend afterward.
Joint four: what kills the setup, and when it expires
Most walkthroughs put a stop "below the swept low" and move on. That's a stop for a trade you're already in. The model also needs two rules for a trade you haven't taken yet.
Invalidation price. The level at which the setup is cancelled before entry. If price closes back through the raid extreme before filling the gap, the story that justified the entry is gone.
Expiry. The number of bars after which an unfilled retrace is abandoned. A gap that gets touched three hours later is a different event from one touched in four bars. Without an expiry you can keep a stale setup alive until it finally fills, and then credit the model.
Our default proposal is a close beyond the raid extreme as the invalidation, and 12 bars on the working timeframe as the expiry. That's a number we picked for being easy to defend, not one we found by searching. Treat it as a starting value, then count how many setups it cancels.
The same ten candles, labelled two ways
This is the part we built to show the size of the problem. The methodology is simple: take one sample of ten 5-minute candles, apply two rule sets that each look reasonable, and compare what each labeller does.
Important: these ten candles were constructed for illustration. They are not a market record, not a backtest and not a sample of any real instrument. We chose round, readable prices so the arithmetic is easy to follow. Average true range over the previous 14 bars is set at 5.0 points. Eligible levels on the chart: a prior-day low at 5,400.00, a London-session low at 5,404.50, equal lows at 5,406.00, and a prior-day high at 5,423.00.
| Bar | Open | High | Low | Close |
|---|---|---|---|---|
| 1 | 5,410.0 | 5,411.0 | 5,407.0 | 5,408.0 |
| 2 | 5,408.0 | 5,409.0 | 5,405.0 | 5,405.5 |
| 3 | 5,405.5 | 5,406.5 | 5,403.5 | 5,406.0 |
| 4 | 5,406.0 | 5,414.5 | 5,405.5 | 5,413.5 |
| 5 | 5,413.5 | 5,422.0 | 5,411.5 | 5,420.5 |
| 6 | 5,420.5 | 5,421.0 | 5,417.0 | 5,417.5 |
| 7 | 5,417.5 | 5,418.0 | 5,413.0 | 5,414.0 |
| 8 | 5,414.0 | 5,414.5 | 5,410.0 | 5,411.0 |
| 9 | 5,411.0 | 5,418.0 | 5,410.5 | 5,417.5 |
| 10 | 5,417.5 | 5,424.0 | 5,417.0 | 5,423.5 |
Bar 2 trades below the equal lows at 5,406.00. Bar 3 trades below the London low at 5,404.50. Bar 4 is a big up candle, and bar 5 is bigger. Two gaps form: bars 3-4-5 leave a gap from 5,406.50 to 5,411.50, and bars 4-5-6 leave one from 5,414.50 to 5,417.00. Price then drifts back down through bars 7 and 8, and rallies to the prior-day high by bar 10.
Labeller A
- Target pool: the equal lows at 5,406.00. Bar 2 raids them.
- Displacement: range at least 1.5 times ATR (7.5 points) and body at least 70% of range. Bar 4 has a 9.0-point range and a 7.5-point body, which is 83%. It qualifies.
- Gap: the first one formed, 5,406.50 to 5,411.50. Limit entry at the near edge, 5,411.50. Bar 8 trades down to 5,410.00, so the order fills on bar 8, four bars after displacement.
- Stop: 1.0 point below the swept low, at 5,404.00. Risk is 7.5 points.
- Target: the prior-day high at 5,423.00. Reward is 11.5 points, a ratio of 1.53 to 1.
Labeller B
- Target pool: the London low at 5,404.50. Bar 3 raids it.
- Displacement: range at least 2 times ATR (10 points). Bar 4 has a range of 9.0 and fails. Bar 5 has a range of 10.5 and qualifies.
- Gap: the one formed by the displacement bar and its neighbours, 5,414.50 to 5,417.00. Limit entry at the near edge, 5,417.00. Bar 7 trades down to 5,413.00, so the order fills on bar 7.
- Stop: 1.0 point below the swept low (bar 3's 5,403.50), at 5,402.50. Risk is 14.5 points.
- Target: the same prior-day high at 5,423.00. Reward is 6.0 points, a ratio of 0.41 to 1.
Both labellers followed a rule set that could be defended in a chat room. Both reached the target on bar 10. They disagree on the raid, the displacement candle, the gap, the entry price, the stop and the reward-to-risk ratio. Add a minimum reward-to-risk of 1.5, which is an ordinary filter, and Labeller A takes the trade while Labeller B skips it entirely.
Now imagine each of those labellers posting a record. One has a trade that made 11.5 points on 7.5 of risk. The other has either a trade that made 6.0 points on 14.5 of risk or no trade at all. The chart is identical. The difference between the two records is entirely the labeller. That's what "discretionary at every joint" costs, and a hit rate computed from either record would tell you about the person, not the model.
The frozen-parameter table
This table is our own editorial proposal. It is not a tested configuration. We built it to be the shortest list of choices that removes the labeller from the result. Fill in your own value for each row, write it down before the session opens, and don't touch it until you've logged a pre-agreed number of setups.
| Joint | Question to fix | Default proposal |
|---|---|---|
| Target pool | Which levels may be raided? | Prior-day high and low only |
| Displacement | How large is large enough? | Range of 1.5x ATR(14) or more, body of 60% or more, close beyond the last swing |
| Entry gap | Which gap, which price? | First gap in the leg, limit order at the near edge |
| Invalidation | What cancels the setup? | A bar close beyond the raid extreme |
| Expiry | How long may the retrace take? | 12 bars on the working timeframe |
| Session window | When may a setup start? | One declared window, counted as a parameter |
| Minimum reward-to-risk | Below what is a setup skipped? | 1.5 to 1 |
Four numbers get written down before the session starts: the displacement threshold, the entry-gap rule, the invalidation price rule and the expiry count. The other rows are choices of list rather than number. If you only commit to four things, commit to those.
Time windows: a parameter, not a reason
The model is usually taught with clock times attached, a morning window for one market session and sometimes a second window later in the day. Those times are there because liquidity and volatility are higher then. That's a reasonable observation about when moves are large.
What a time window is not: evidence that a setup inside it is valid. A session filter is a parameter. It should be declared before you start, and it should be counted, because every window you try is another degree of freedom. Test three windows and report the best one, and you've run three tests and reported one.
The honest way to handle it is to fix one window up front. If you later want to compare windows, log them as separate variants with the same frozen joints and keep the count visible. We did the same exercise on a related time-based idea in testing the AMD trading strategy against real sessions.
Why this model resists honest backtesting
Discretion is the first reason. If the joints aren't fixed, a backtest measures how the person doing the labelling felt on each chart. The second reason is mechanical. A replay tool or a scripted strategy can quietly flatter the result in ways the user doesn't notice.
TradingView's own help centre describes this under the heading of look-ahead bias. According to TradingView, a strategy can produce unrealistically good results by using information from bars the trader couldn't have seen yet. Its page lists several causes. Three map neatly onto this model:
- Non-standard chart types. TradingView explains that on Renko or Kagi charts the backtesting engine treats each bar as four transactions and can enter or exit at a price that didn't exist in reality. A model that depends on exact gap edges is sensitive to that.
- calc_on_order_fills. With this setting on, the engine recalculates inside the bar after an order fills, which gives the script access to the bar's high and low. TradingView's own example enters at the open and exits at the same bar's high, something that can't be done live. Our entry, a limit order inside a gap, is exactly the kind of fill where this matters.
- Look-ahead on higher-timeframe requests. The page shows that requesting a daily high or low with look-ahead turned on lets a strategy know the day's range from the first bar. A model whose target is the prior-day high or low is one typo away from this problem.
You can read all three in TradingView's note on strategies that peek into the future. Our post on turning market structure into a testable rule shows how to write swing points so they confirm only after enough bars have printed, which is the same discipline in code form.
The takeaway isn't that the model can't be tested. It can, once the joints are frozen and the data handling is clean. It's that a casual replay of "setups I could see" is not a test. It's a scrapbook.
Silver bullet, unicorn, power of three: variants, not new systems
Search for this model and you'll run into three more names. They look like separate strategies. Most of them are the same sequence with a different rule for timing or entry.
- The silver bullet is the gap-retrace entry restricted to a short clock window. It adds a time filter and nothing else. Our silver bullet checklist turns it into yes/no checks.
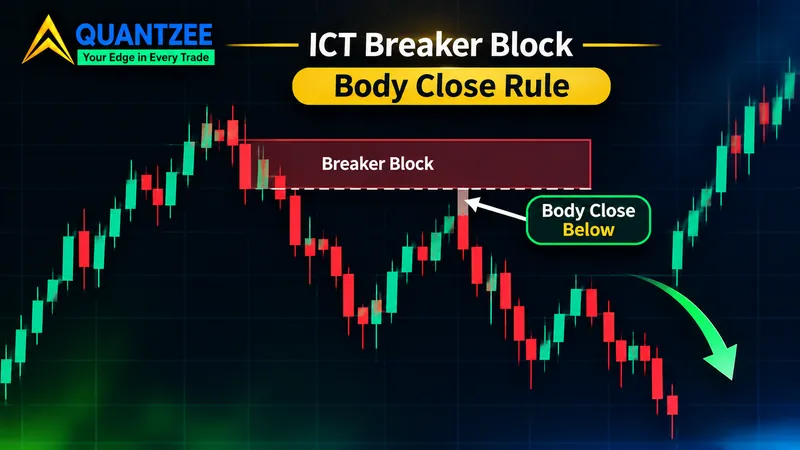
- The unicorn is a variant where the entry zone is the overlap of a gap and a breaker block, a narrower entry rather than a different idea.
- Power of three (accumulate, manipulate, distribute) is a description of the day's shape. The raid is the "manipulate" and the run to the opposing pool is the "distribute".
Each variant adds parameters on top of the same four joints. That means each one needs its own frozen values and its own count. A variant that wins in one window is a new hypothesis, not a confirmation of the old one. If you want to know how often the gap even appears inside the silver bullet window, we counted that in how often the silver bullet gap appears. For the broader question of which smart-money ideas survive when each is turned into a rule, see our audit of smart money concepts.
What a "75% win rate" has to say before it means anything
You'll see a figure like this attached to discretionary versions of the model: a win rate in the seventies, sometimes with a trade count beside it. The figure can be true and still be unusable. A bare percentage with no definition is a headline, not data.
Before anyone should believe a number like that, it has to state five things:
- Instrument. A win rate on one liquid index future says little about a thinly traded pair.
- Date range. A trending quarter and a choppy quarter give different answers. Show the dates.
- The entry condition, in full. All four joints and the session window, written so a stranger could mark the same trades.
- What counted as a win. Hit the target, closed in profit, or just touched 1R first? These produce very different percentages from the same trades.
- The sample count. 120 wins out of 160 and 3 wins out of 4 are both "75%". One of them is a measurement.
A win rate also says nothing without the reward-to-risk behind it. Our worked example showed one setup at 1.53 to 1 and the same chart at 0.41 to 1. At 0.41 to 1, you need to win roughly 71% of the time just to break even before costs (the break-even rate is 1 divided by 1 plus the ratio, so 1 / 1.41). At 1.53 to 1 the break-even rate is about 40%. The same "75%" means opposite things in those two cases.
If anyone wants an honest hit rate for this model, it needs a pre-committed census: the four joints frozen first, every setup logged as it occurs including the ones that fail, and the count reported along with the dates and instrument. We haven't found such a census published, and the LuxAlgo page we quoted says the same about audited records. Until one exists, treat any single figure as an anecdote. For general guidance on weighing performance claims, the investor-education resources at Investor.gov and FINRA are a sensible place to start.
How to use this without fooling yourself
A short routine, in order:
- Copy the frozen-parameter table and fill in your values. Date it.
- Pick one instrument, one timeframe and one session window.
- Log every setup that meets the rules, wins and losses alike, plus the ones you skipped for the reward-to-risk floor.
- Don't edit a parameter until you've reached the sample size you agreed on. Write that number down at the start, for example 50 setups.
- When you do change a parameter, start a new log. A changed rule is a new test.
If you chart on TradingView, a tool that marks the raid, the displacement candle and the gap automatically takes out some of the labelling noise, because the code applies the same rule on every bar. Our SMC Toolkit Pro indicator is built for that job. It marks structure and gaps from stated settings, and the setting values are yours to choose. Paper trade it first, and judge it by whether your logged setups match the rules, not by how clean the chart looks.
Frequently Asked Questions
This article is educational and describes analytical software. It isn't investment advice, a recommendation to trade, or a forecast of results. Trading carries risk of loss.