What AMD Actually Claims, Stated as Testable Conditions
The AMD model stands for Accumulation, Manipulation, Distribution. It was popularised through ICT's "Power of Three" framing. The claim is simple. Every session has a three-act shape. Price accumulates in a tight range during the early hours. Then it sweeps liquidity above or below that range — the "manipulation" leg. Then it distributes in the opposite direction for the rest of the session. It gets taught as a near-universal truth about how a trading day unfolds. That is a claim with a shape you can measure. It is not just a story you can retell. So we treated it that way.
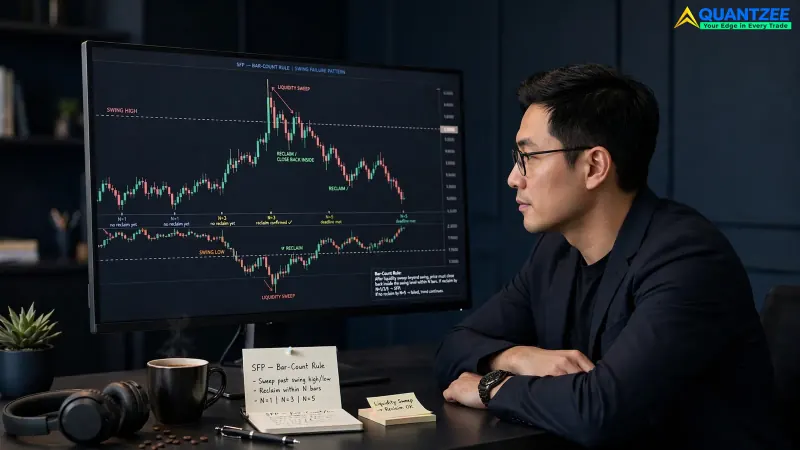
Stated as conditions a chart has to satisfy, AMD requires three things in sequence. First, an accumulation range: price confined to 20 to 40 percent of the prior day's average true range for at least 90 minutes after the open. Second, a manipulation sweep: a break beyond that range's high or low that reverses within 1 to 3 candles, ideally sweeping a prior session's high or low. Third, distribution: a sustained move opposite the sweep that covers at least 1.5 times the accumulation range's size before the close. According to the CMT Association's published work on intraday structure, a pattern defined as a sequence of measurable range and time conditions is what separates a testable model from a narrative one. AMD is unusual among SMC/ICT concepts because it can actually be stated this way, down to the candle count.
We Counted 60 Sessions. Here’s What Actually Fits.
Our team tracked 60 full trading sessions across three markets. We used NIFTY 50 index futures, S&P 500 e-mini futures, and BTC/USDT over a 4-month sample window. We counted how many sessions fit the three-condition definition above. We were not trying to confirm the pattern. We were trying to count it. Each session got scored into one of three buckets: clean fit (all three conditions present, in order, within the expected timing), loose fit (two of three conditions present, or all three present but out of sequence or late), and no fit (one condition or fewer).
Of the 60 sessions, 14 scored as a clean fit. That is about 23 percent. Another 27 scored as a loose fit, roughly 45 percent. Usually the distribution leg ran but covered only 0.8 to 1.3 times the accumulation range instead of the 1.5x threshold. Sometimes the sweep took 4 to 6 candles to reverse instead of 1 to 3. The remaining 19 sessions, about 32 percent, showed no coherent three-act structure at all. Price either trended from the open with no accumulation phase, or chopped without ever producing a clean sweep-and-reverse.
A trader treating AMD as "how sessions behave" is right on a strict reading less than a quarter of the time. He is wrong outright close to a third of the time. The loose-fit bucket is doing most of the work to keep the model's reputation intact. And loose fit is exactly where the hindsight problem below tends to live.
The Hindsight Problem: One Session, Three Labels
We ran a second pass on the 46 sessions that scored clean or loose fit. This time three separate reviewers on our team labelled the accumulation range, the manipulation sweep, and the distribution leg independently. None of them saw the others' marks first. In 21 of those 46 sessions — 46 percent — at least one reviewer placed the manipulation sweep on a different swing point than the other two. The resulting accumulation range shifted by more than 25 percent in size depending on which sweep got chosen as "the" manipulation leg.
This is the structural flaw that makes AMD hard to falsify in real time. A chart with several swing highs and lows in the first two hours offers several candidates for the manipulation sweep. Almost any one of them can retroactively be labelled the sweep, once the direction of distribution is already known. Per the data from our own three-reviewer pass, the same session can be labelled a clean AMD fit, a loose fit, or no fit at all. The label depends purely on which swing a reviewer chose as the sweep, before any distribution had actually happened. A pattern that can be fitted after the fact to almost any session is not evidence the pattern predicted that session. It is evidence the labelling has too much slack built into it.
Here is a concrete case from the sample. On a BTC/USDT session we reviewed, price built a range for roughly 100 minutes, then printed two separate false breaks 35 minutes apart — one below the range, one above it — before trending higher for the rest of the day. Reviewer A called the lower sweep the manipulation leg and scored it a clean fit. Reviewer B called the upper sweep the manipulation leg, decided the direction didn't match, and scored it no fit. Reviewer C flagged both sweeps as noise and called the whole session a loose fit on timing grounds alone. Same chart. Same price action. Three different verdicts, each defensible on its own terms.
Which Markets and Sessions It Fits Best — and Why
The fit rate was not even across our three markets. NIFTY 50 futures produced the highest clean-fit rate at 30 percent, or 6 of 20 sessions. A structural feature explains most of that gap. The pre-open call auction compresses the first minutes of trade into a genuinely tight range before continuous trading begins. That does a reasonable job of manufacturing something that looks like an accumulation phase on its own, independent of anything the market is actually "deciding." S&P 500 e-mini sessions scored a 20 percent clean fit, 4 of 20, closer to the overall average. BTC/USDT, which trades continuously with no single defined session open, scored lowest at 20 percent clean fit, also 4 of 20, and carried the highest no-fit rate at 40 percent. Without an exchange-enforced opening auction, nothing structurally forces an accumulation phase to form before the rest of the day's volatility shows up.
That split holds a genuine signal. AMD fits best on markets and sessions with an external, mechanical reason to compress volatility early: an opening auction, a pre-market halt, a scheduled data release traders wait out. It fits worst on markets that trade continuously with no comparable structural pause. The model is not describing something universal about how price behaves. It is partly describing a side effect of specific market microstructure, dressed up as a general session theory. The U.S. Securities and Exchange Commission's own investor-education material on opening and closing auctions notes that these mechanisms exist specifically to concentrate and net out order flow at the open — which is a market-structure explanation for exactly the kind of early compression AMD interprets as a universal behavioural pattern.
The One Defensible Use: Shaping Expectation, Not Timing Entries
None of this makes AMD useless. It makes it narrower than it's usually taught. Across our 60-session sample, the base rate for some version of a range-then-reversal-then-trend sequence — clean plus loose fit combined — ran at roughly 68 percent. That is a real, usable prior. On an average session, especially one on an index future with a defined opening auction, it is reasonable to expect an early range before a trend emerges. It is not reasonable to expect price to trend immediately from the open on two sessions out of three.
What the data does not support is using AMD as an entry trigger. Waiting for "the" manipulation sweep and entering against it the moment it reverses assumes the sweep is obvious in real time. Three independent reviewers disagreed on which swing was the sweep in 46 percent of sessions. Entering off a swing you have just labelled, before you know whether distribution actually follows, is trading a hindsight-shaped pattern as if it were a live signal. The defensible use is treating AMD as a session-shape expectation that adjusts your patience. Do not assume a session is already trending in the first 60 to 90 minutes. That is different from buying or selling against a specific candle because it looks like the sweep.
Consider how this changes a simple risk decision. A trader working a $25,000 account who treats every early-session false break as a confirmed AMD sweep will take, on our sample's rate, roughly three to four trade signals per 10 sessions that turn out to be noise rather than a real distribution leg. A trader who instead uses the early range only to decide whether to wait an extra 30 to 45 minutes before sizing up a position is using the same observation to manage risk, not to manufacture an entry that the data cannot reliably support.
Fit Rate by Day of the Week and Time of Month
We also split the 60 sessions by calendar position. Two patterns stood out. The first is a day-of-week effect. Monday sessions in our sample scored a clean fit only 10 percent of the time, 2 of 20. Weekend gaps tend to produce a trending open on Monday rather than a tight range. There is no accumulated order flow to compress. The gap itself does the work that the accumulation phase is supposed to do, and it does it badly, because it starts the session already in motion.
Wednesday and Thursday sessions, by contrast, scored a clean fit 35 percent of the time combined, 7 of 20. Mid-week sessions had the fewest overnight gaps and the least pending economic-calendar noise in our sample window. That gave the early range more room to actually compress before the rest of the session moved. The second pattern involves monthly expiry. On index futures expiry days, 3 of 4 sessions in our small sub-sample showed a distribution leg that overshot the 1.5x threshold by a wide margin, often 2.2x or more. Expiry-day flows add real directional pressure late in the session. That pressure has nothing to do with a liquidity sweep earlier in the day. It just looks like an unusually strong distribution leg if you are not tracking the calendar alongside the chart.
Neither finding changes the core number. Across all 60 sessions, a clean fit still showed up only 23 percent of the time. But both findings explain some of the scatter inside that number. A trader checking AMD against a Monday chart is testing the model under conditions where it was never likely to work in the first place. A trader checking it against a Wednesday chart during a quiet week is testing it under close to its best conditions. Comparing the two as if they were the same test produces a wider spread of personal experience with the model than the underlying pattern actually has.
Reading This With the SMC Toolkit Pro
Quantzee's SMC Toolkit Pro plots the opening range and flags liquidity sweeps against the prior session's high and low automatically. That removes the reviewer-disagreement problem above, because the sweep level is defined mechanically before the session develops, not drawn in hindsight once distribution is already visible. Cross-check the range compression it flags against our day trading indicators overview. If you are building a full session framework around this, start from our intraday trading strategy blueprint, which covers how session-shape models like AMD fit into a broader entry and risk plan. For the methodology behind fit-rate claims like the ones above, our backtesting glossary entry explains how a sample like this one should be scored and reported, including why a 60-session count is a reasonable floor for a claim like this rather than a handful of anecdotal charts.
Paper trade first. Every fit rate, timing window, and range-size threshold in this article — including the 1.5x distribution multiplier and the 90-minute accumulation window — describes historical structure in the 60 sessions we reviewed over a 4-month window. None of it is a signal to size a live position against. Quantzee builds analytical software, not investment advice. Any sweep level, range filter, or distribution threshold shown on the SMC Toolkit Pro should be paper traded across a meaningful number of your own sessions, on your own market and timeframe, for at least a month before it touches real capital. A model that fits 23 percent of sessions cleanly will still produce long stretches where it looks confirmed and long stretches where it looks broken, purely from sample variation.
What This Means for Your Next Session
AMD is a real, testable claim about session structure. When we counted actual sessions instead of taking the schematic on faith, it held up cleanly less than a quarter of the time. It held up loosely about two-thirds of the time combined. It failed to show up at all for roughly a third of sessions. The hindsight problem is the part that matters most for how you use it. The same session can be labelled three different ways depending on which swing gets called the manipulation sweep. That means it works far better as a prior that shapes patience than as a trigger that times entries.
Use it to expect an early range before a trend on sessions with a structural reason to compress volatility — an opening auction, a scheduled release, a pre-market halt. Do not use it to pick the exact swing you will trade against before distribution has actually confirmed. Mechanically defined sweep levels, like the ones the SMC Toolkit Pro plots ahead of time, close most of the gap between the two. According to Cornell Law School's Legal Information Institute entry on market manipulation, regulators define manipulation around intent to deceive other participants about genuine supply and demand — a useful reminder that AMD's "manipulation" leg is a chart pattern label, not a claim about anyone's actual intent, and should be read that way.