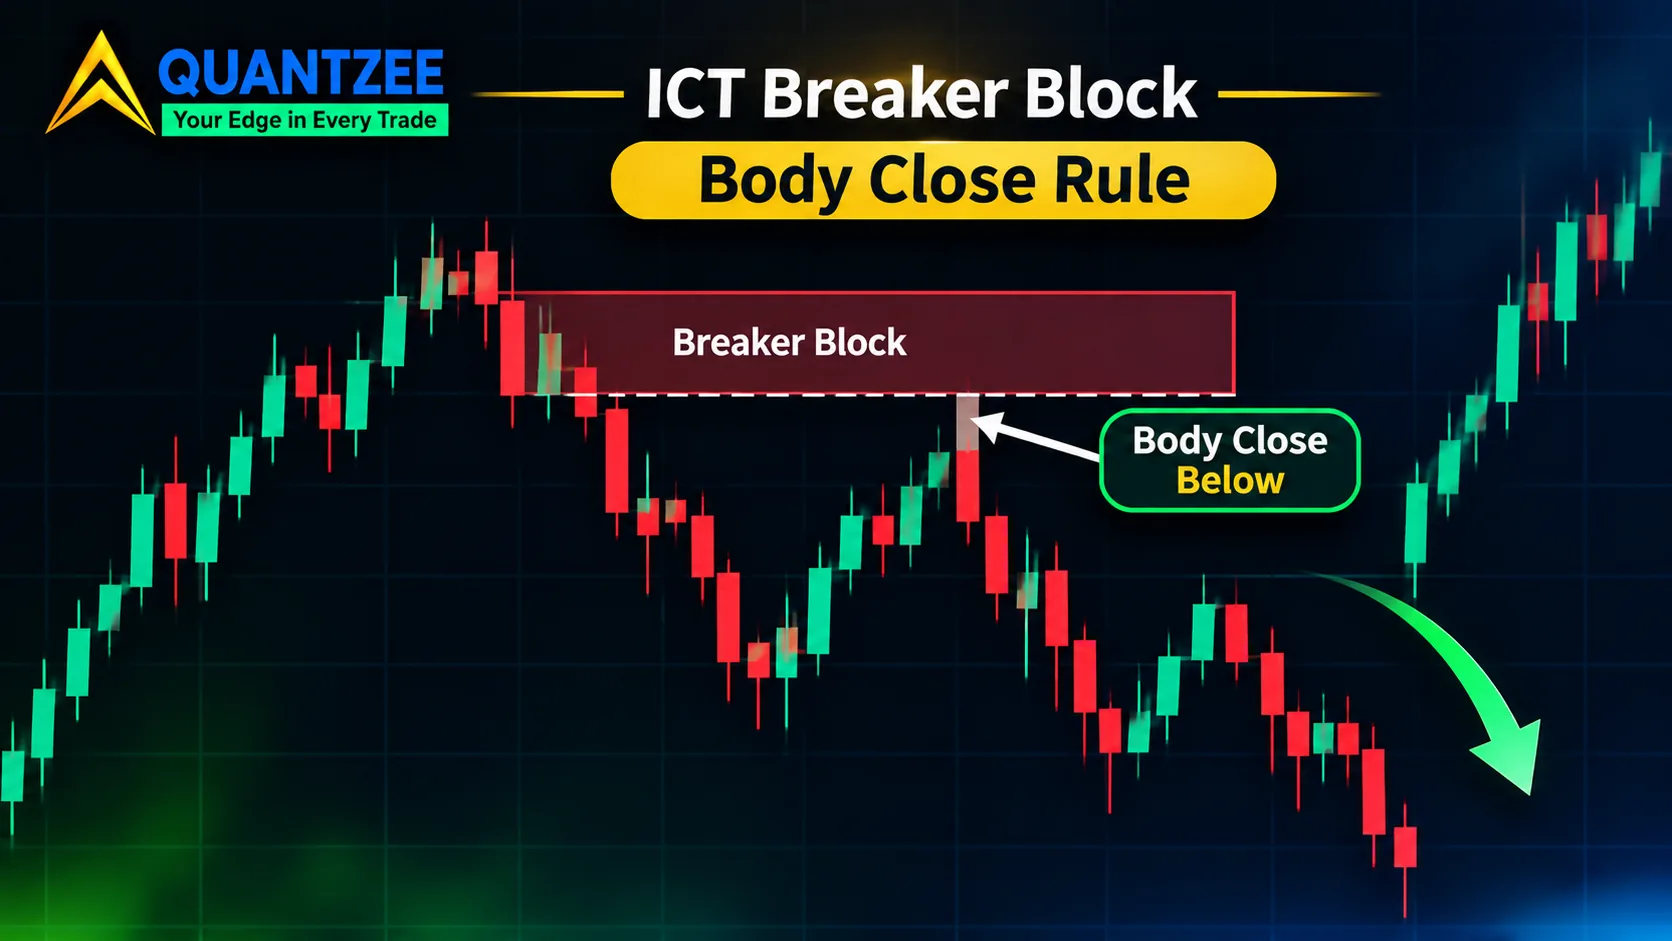
A breaker block is not a separate pattern you go looking for. It is an order block that picked up a failure flag, and the flag is set by one thing only: where a candle body closed relative to the zone. If you take one idea from the ICT breaker block material online, make it that. Most pages describe the flip, a bullish zone turning into resistance, and leave the trigger vague. At Quantzee we think the trigger is the whole definition, so this article builds everything around it.
The plan is simple. First the three ordered conditions that turn an order block into a breaker. Then the body-close test, written so a script could evaluate it. Then the awkward cases: the wick that goes through, the close that lands a hair inside the zone, the timeframe that disagrees with the one below it. After that, how long a breaker stays valid, what the one disclosed sample in this niche really reports, and a qualified breaker that failed anyway. If you want the base concept first, our guide to marking order blocks with a mechanical rule set covers how the zone itself gets drawn.
What a breaker block is, as a state change
Think of an order block as an object with a status. It starts as active. At some point it either holds or it changes state. A breaker block is the name for one particular new state: the zone has been violated and is now being tested from the other side. The shape of the candles tells you nothing here. The sequence does.
For a bullish order block that fails, giving a bearish breaker, the sequence has three ordered conditions:
- The zone exists and is untouched at the start. A valid bullish order block was marked first, with an origin candle, a displacement leg after it, and defined boundaries. If you cannot state the boundaries before the failure, you have no zone to fail.
- Price trades into the zone and a candle body closes beyond its far boundary. For a bullish block, the far boundary is the bottom. One close below it, on the timeframe you committed to, sets the flag. This is the violation. A sweep through the zone that closes back inside or above does not count.
- Price returns and tests the zone from the other side. After the violation, price rallies back up into the old zone from below, and the zone now acts as supply. That retest is what makes it a breaker you can act on rather than a dead order block.
The order matters. Condition 3 can only happen after condition 2, and condition 2 can only happen to a zone that satisfied condition 1. People who label any red box on a chart a breaker are skipping straight to condition 3 and hoping the first two happened.
The mirror case is the same rule with the inequality reversed. A bearish order block fails when a candle body closes above its top boundary, and the retest comes from above, turning the old supply into a bullish breaker. We will write the rule once and flip it, because keeping two separate mental models is how traders end up applying the body-close test to one direction and the wick test to the other.
The body-close test, written as a condition
Here is the test as you would write it for a script. For a zone with a top and a bottom, on a pre-committed decision timeframe:
- Bullish block violated if
close[t] < bottomfor any completed candletafter the zone formed. - Bearish block violated if
close[t] > topfor any completed candletafter the zone formed.
Two details do real work in that sentence. "Completed candle" means you wait for the close, not the tick. A candle that is 3 points below the zone with 40 seconds left has not violated anything yet, and plenty of them close back inside. And "the decision timeframe" means one timeframe, named in advance, a kind of precision that ICT's loosely counted vocabulary rarely offers. We come back to why in a later section.
Notice what the test ignores: the high, the low, how far the wick went, and how many wicks there were. A candle can poke 12 points below the zone, tag the stops sitting there, and close 2 points back inside. By this test, nothing happened to the zone. The ictkillzone.com guide states this rule plainly: per the guide, a candle body must close beyond the order block zone, and a wick through the zone is not a violation. That is the clearest statement of it among the pages we read. The longer ATAS guide, at roughly 4,500 words with nine annotated charts, uses phrasing like "breaks below" without saying whether a wick counts, which leaves the reader exactly where they started.
What "the zone boundary" means depends on how you drew the zone
The test needs a boundary price, and order blocks get drawn two common ways. This is where two traders applying the same rule still disagree.
If you draw the block body-to-body, the boundaries are the origin candle's open and close. For a bullish block, the far boundary is the lower of the two. If you draw it wick-to-wick, the far boundary is the candle's low. Same candle, same close, different verdict. Take an origin candle with an open at 100.00, a close at 99.20 and a low at 98.60. A later candle closes at 99.00. Against the body-to-body zone (bottom 99.20), that is a violation. Against the wick-to-wick zone (bottom 98.60), the zone is still alive.
Our own rule set for order blocks uses the origin candle's open for the near edge and the wick for the far edge, and treats a full-body close beyond the far edge as invalidation. That is a choice, and a defensible one, but the breaker rule should inherit whatever convention you used to draw the block. If you draw with bodies, test with bodies. Mixing conventions mid-trade is how a zone gets declared dead on Monday and alive on Tuesday.
Why a wick through the zone is not a violation
This is the claim people push back on, so it deserves its reasons rather than an assertion.
A wick is a price that traded and was rejected. The market visited, found no acceptance, and left. A close is the price the market was willing to settle at when the period ended. When we say a zone failed, we mean the market accepted prices beyond it, and a close is the only candle feature that measures acceptance. A wick measures an excursion.
There is a practical angle too. Wicks through a zone are usually where resting orders get triggered. Stops cluster just beyond obvious levels, and a quick run through them is a normal feature of how orders get filled. Treating every such run as a failure means discarding zones that did their job. In our order-block write-up, wick-based invalidation threw out about 40% of zones that a close-based rule would have kept, in the 90-day NQ and ES sample described there. That figure comes from that specific sample and that specific marking convention, so read it as an illustration of the size of the effect, not a constant.
For background on how orders actually fill at resting levels, the SEC's investor education pages on order types are a sound neutral reference; see Investor.gov from the SEC's Office of Investor Education and Advocacy. They don't discuss ICT concepts, and we are not suggesting they do. They explain why a price touching a level and an order filling there are different events.
The ambiguous case: the close sits inside the zone by a fraction
Now the uncomfortable one. A bullish zone has a bottom at 5,210.00 and a zone height of 8.50 points. A candle closes at 5,210.75. That is inside the zone by 0.75 points, about 9% of the zone's height. Violated or not?
Under the strict test, no. The close is not beyond the boundary, so the flag is not set. Some traders want a tolerance, such as "closes within 10% of the boundary count." We would resist that, for a reason that has nothing to do with whether 10% is a good number. Once you add a tolerance you have added a parameter, and parameters are where hindsight sneaks in. You will find yourself widening it on the charts where it saves a zone you like. If you want a tolerance, set it before you look at any chart, write it down, and apply it to every zone.
On the chart, the near-miss close looks like a candle with a body that ends just inside the zone and a long lower wick that went well beyond it. The honest label is "not yet a breaker." You leave the status at active, and you let the next candle decide. That is slower than calling it, and it is correct.
One rule, both directions
To keep the model small, here are both directions in a single table. The only thing that changes is which boundary you watch and which way the inequality points.
| Step | Bullish block fails (bearish breaker) | Bearish block fails (bullish breaker) |
|---|---|---|
| Zone before failure | Demand, bottom and top defined | Supply, bottom and top defined |
| Violation | Candle body closes below the bottom | Candle body closes above the top |
| Wick beyond boundary, close back inside | Not a violation | Not a violation |
| Retest | Price rises back into the zone from below | Price falls back into the zone from above |
| Role after failure | Resistance | Support |
If you have read our piece on BOS versus CHoCH, the logic will look familiar. Structure labels there are decided by where a close lands relative to a swing point. The breaker test is the same kind of rule applied to a zone instead of a swing.
Timeframe ownership: the same candles, two verdicts
This is the part most guides skip, and it is where a clean rule turns messy in practice.
Take a 1-hour candle that opens at 5,224.00, trades down to 5,205.50, and closes at 5,211.00. Inside that hour sit four 15-minute candles. Suppose the third one closes at 5,208.25 and the fourth recovers to 5,211.00. Now apply the test to a bullish zone with a bottom at 5,210.00.
- On the 15-minute chart, the third candle closed at 5,208.25, which is below 5,210.00. Violation.
- On the 1-hour chart, the one candle closed at 5,211.00, above the bottom. The low of 5,205.50 is just a wick. No violation.
Same market, same minutes, opposite labels. Neither reading is wrong. They answer different questions. The fix is not to pick the answer you like after the fact. The fix is to commit, before the trade, to the timeframe that owns the zone. If you marked the block on the 1-hour chart, the 1-hour close decides its fate, and 15-minute closes can inform your entry timing but cannot declare the zone dead.
This also gives you a clean answer to the common argument where one trader says "that block is broken" and another says "it held." Often both are right on their own timeframe. Our guide on the ICT framework on one page makes the same point about vocabulary in general: many disputes are two people using one word at two scales.
Expiry: how long does a breaker stay valid?
A breaker that has not been retested is a hypothesis, and hypotheses go stale. If you leave every violated zone on the chart indefinitely, you create a quiet problem: sooner or later price wanders back to one of them, and you remember the hit and forget the 14 other zones it ignored. That is how a chart manufactures hindsight confirmation.
So give each qualified breaker a clock. Here is a workable structure, and we want to be clear that the numbers are a starting convention, not a measured optimum:
- The clock starts at the close of the violating candle.
- Count completed bars on the decision timeframe. A sensible first setting is 20 bars on that timeframe, or the end of the next full session, whichever comes first.
- If price has not retested the zone from the other side by then, mark it expired and remove it from the chart. Do not move it to a "maybe later" layer.
- If price retests and the trade either works or fails, the zone is spent. Retire it.
On a 15-minute chart, 20 bars is 5 hours. On a 1-hour chart it is 20 hours, which crosses sessions, so the session cap matters. Whatever numbers you choose, choose them once, and apply them to the whole sample when you review. If you change the expiry after seeing which zones got hit, you have fitted the rule to the chart, and the results will not carry over.
What the one disclosed sample in this niche reports
Of the pages we reviewed, exactly one publishes figures from a test. The backtrex.com breaker block guide, published in July 2026 and updated on 1 October 2026, reports two samples. On EUR/USD it lists 87 setups with a 54% win rate and a profit factor of 1.62. On NAS100 it lists 64 setups with a 57% win rate and a profit factor of 1.74. Both cover 2022 to 2024, and both were taken under a stated protocol the page calls BOS plus FVG plus breaker return.
That last clause is the one to hold on to. Per the publisher's description, the setups required a break of structure, a fair value gap, and a return to the breaker, all together. The numbers describe that combined filter. They do not describe a breaker taken on its own, and you cannot subtract the other two conditions and keep the win rate.
A few other cautions apply. These are one publisher's results. We have not reproduced them, and we are not presenting them as ours. The two sample sizes are small enough that a handful of trades moves the percentages noticeably: on 64 setups, one trade is worth about 1.6 percentage points. We would not average the two instruments into a single headline number, since each has its own spread, volatility and session behavior. And the page, as we read it, does not walk through a losing trade, show slippage or spread treatment, or include an equity curve, which are the things you would want before leaning on a profit factor.
None of this makes the data useless. It is more than the other pages offer, and the willingness to name a protocol and a date range is the right habit. It just means the honest takeaway is narrow: under one combined protocol, on two instruments, over three years, one publisher reported results in the mid-50s. If you want to know what a breaker block does on your instrument under your rules, you have to run that test. Our walkthrough on which SMC ideas survive a rule-based test explains how we sort ideas into those you can code and test and those you cannot.
A qualified breaker that failed
Every page we reviewed teaches the flip with a winner. So here is the opposite, and a note first: the case below is an illustration we built with round, made-up prices to show the sequence. It is not a live trade, we are not presenting it as a result, and it is described in words because we are not attaching a chart screenshot to it. The point is what was visible at the time.
Setup. On a 30-minute chart of a generic index future, a bullish order block formed with a top at 5,218.50 and a bottom at 5,210.00, a height of 8.50 points. The displacement leg after it was 1.9 times the 20-bar average range, so condition 1 was met.
Violation. Two days later, a 30-minute candle closed at 5,207.25, which is 2.75 points below the bottom. A body close beyond the far boundary: condition 2, on the pre-committed timeframe. The zone is now a bearish breaker with 20 bars on its clock.
Retest. Eleven bars later, price rallied into the zone from below, with a candle high of 5,214.75, inside the 5,210.00 to 5,218.50 range. Condition 3 was met. By every rule above, this is a qualified breaker.
Outcome. The retest candle closed at 5,216.50, still inside the zone. The next candle closed at 5,219.25, above the top boundary, and the one after it at 5,226.00. Price carried straight through. No stall, no rejection wick.
What was visible at the time. This is the useful part, because the failure is easy to explain afterwards. There were three things on the chart before any entry:
- The retest candle's close was in the upper half of the zone, not the lower. In a working supply retest you want closes that fail to hold the upper boundary. A close at 5,216.50, about 76% of the way up an 8.50-point zone, was already a mild warning.
- The rally into the zone was made of larger candles than the sell-off that created the violation. The violating move was one candle. The recovery was four consecutive up-closes. That is the zone being reclaimed, not rejected.
- There was no higher-timeframe agreement. The 4-hour trend was still up. A bearish breaker against a rising 4-hour structure is a counter-trend trade wearing a rule's clothing.
None of those three is a hindsight observation. They were all on the chart when the retest candle closed. A breaker that meets the three conditions is a candidate, not a signal, and the rules above only tell you it exists. Whether you act on it is a separate decision, and your plan should say what extra evidence you require. Our work on the four-bar sequence of a liquidity sweep covers one such check, whether the move into the zone was a sweep that rejected or a real break.
Breaker blocks, order blocks, mitigation blocks and supply/demand zones
The vocabulary in this corner of trading collides constantly, so here is each term pinned to one meaning. Different authors define some of these differently, and where they do we say so.
| Term | What it is | Status test |
|---|---|---|
| Order block | A single origin candle ahead of a displacement leg, with defined boundaries | Active until a body close beyond the far boundary |
| Breaker block | An order block that has been violated by a body close and is being retested from the other side | Needs all three conditions, in order |
| Mitigation block | Used by many authors for a zone from a move that failed to take out a prior swing, then reversed | Definitions vary between authors; check the one you are reading |
| Supply/demand zone | A broader region of prior rejection, often several candles, with looser edges | Judged by reaction, not by a single close rule |
The practical effect: an order block and a breaker block are the same object at different points in its life, which is why the body-close rule is the dividing line. A mitigation block, by most descriptions, is a different story, a failed attempt at a swing rather than a failed zone. If a source uses "mitigation" to mean what we have called a breaker, translate before you compare numbers. The same goes for the fair-value-gap overlap some call a unicorn setup, which is a breaker plus a gap, not a replacement for either.
Turning it into a checklist you can run
Put together, the whole test fits in a short list. Before you call anything a breaker, answer these in order:
- Was the order block marked and its boundaries written down before the violation?
- Which timeframe owns the zone, and was it named in advance?
- Did a completed candle on that timeframe close beyond the far boundary, using the same boundary convention as the drawing?
- Is the close beyond the boundary, not just a wick, and not just a fraction inside?
- Has the expiry clock (bars or sessions) run out? If so, the answer is no.
- Did price retest from the other side?
- What did the retest candle's close and the surrounding candles look like before you entered?
If the first six come back yes, you have a breaker. The seventh is your edge, or your lack of one. Software is good at questions one to six because they have exact answers, and that consistency is why we built the zone logic into the SMC Toolkit Pro indicator. It applies the marking and invalidation rules the same way on every chart. It does not answer question seven for you, it does not make a breaker more likely to work, and you should paper trade any new marking method before real size is involved.
For wider context on volatility and market structure that sits behind concepts like this, the CME Group's public education pages are a reasonable neutral starting point; see CME Group education. The futures regulator's investor material is another: the CFTC. Neither endorses any chart method. Our analysis is software and education, not advice, and nothing here is a recommendation to buy or sell anything.
Common mistakes we would watch for
- Calling the wick. Any breaker "confirmed" by a candle that closed back inside the zone is not confirmed. Wait for the close.
- Switching timeframes after the fact. If 5-minute closes violate the zone and the 1-hour doesn't, you do not get to pick the one that matches your trade.
- Letting zones live forever. A chart with 30 old breakers will always have one that price respects. Expire them.
- Borrowing the win rate. A figure from a combined protocol is not a number for a bare breaker. Treat third-party percentages as context.
- Showing only winners. If your journal has no qualified breakers that failed, it is a highlight reel, not a record.