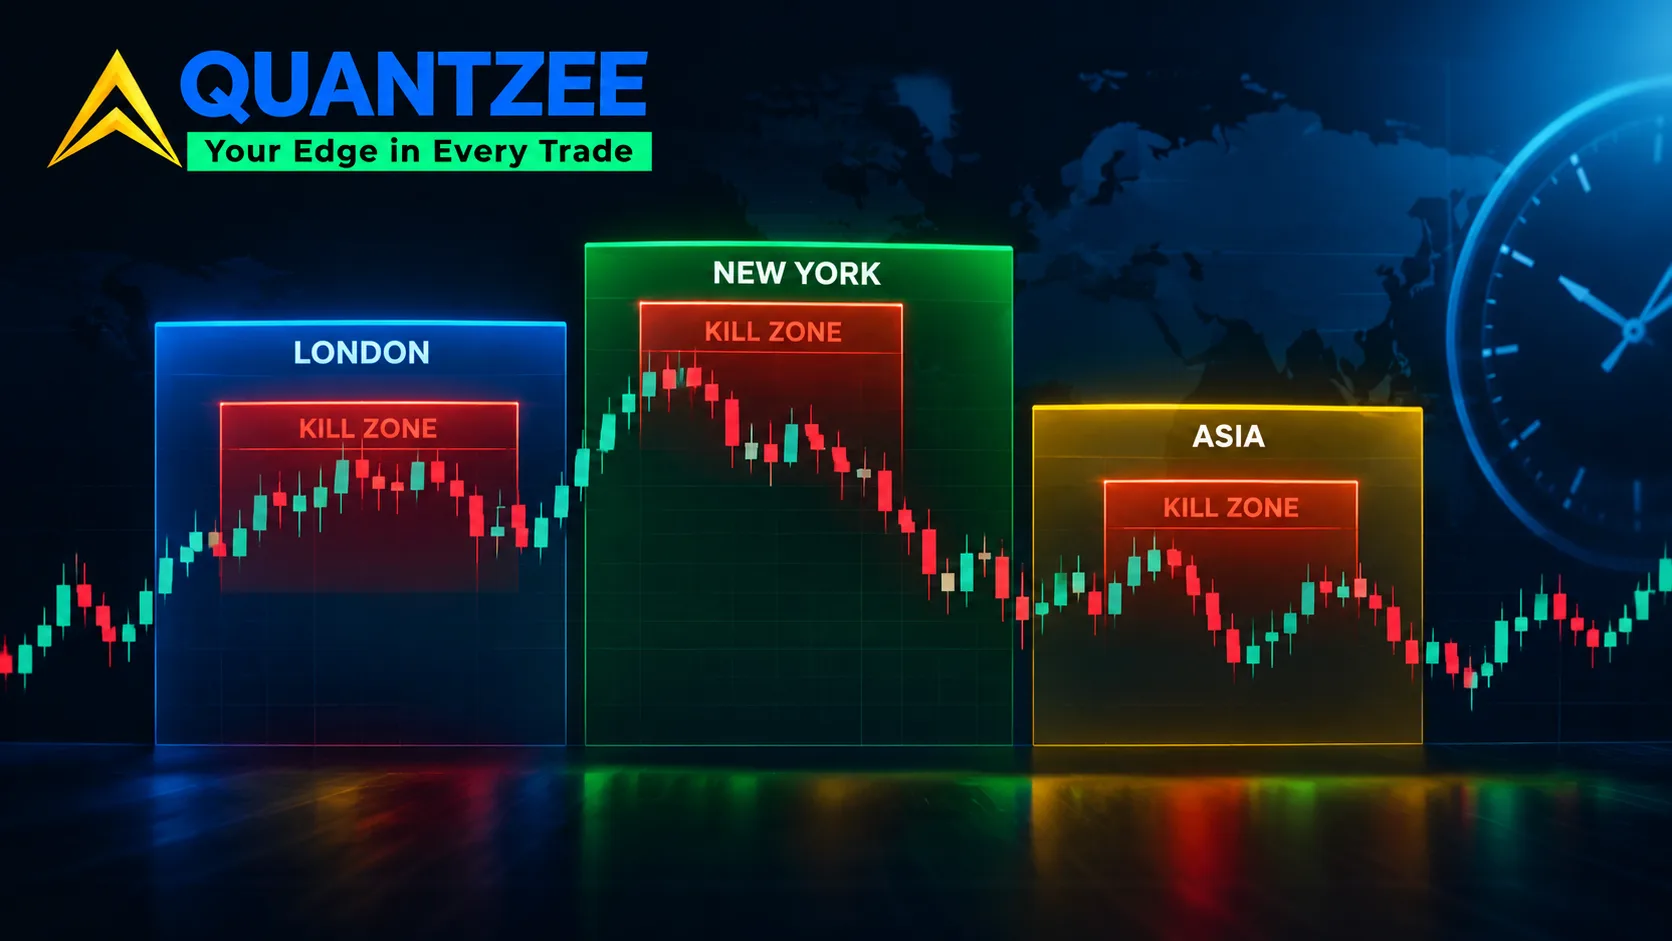
ICT killzones are a schedule. London open. The New York AM window. The London/New York overlap. A handful of lunchtime lulls in between. That schedule was built on one market — spot FX — and copy-pasted onto everything else. Nobody asked if the hours still applied. Often, they do not. Our team tracked hourly range concentration across three instrument classes for 90 trading days. The overlap window held up on FX majors. It held up much less on index futures. It barely registered on Bitcoin. Killzones are an empirical claim, and empirical claims expire. This piece gives you the method to re-test the claim yourself, on your own chart, before you build a session around it. Killzones are one piece of the ICT day-model timing layer covered in the complete ICT trading guide, alongside the Judas swing and AMD.
Where the killzone concept actually came from
The windows trace back to how the spot FX market is structured. They have nothing to do with volatility itself in the abstract. FX has no central exchange and no single open or close. Liquidity rotates between three regional centres as each one comes online through the day. According to the Bank for International Settlements' triennial survey of foreign-exchange turnover — the standard reference for how FX volume concentrates by trading centre and hour — London alone handles well over a third of global daily FX turnover. The window where London and New York are both active carries the deepest liquidity of the day, roughly 8:00–11:00 EST (13:00–16:00 GMT) depending on the time of year.
The "Asian killzone," "London killzone," and "New York killzone" labels popularised across retail trading education around 2017–2019 are a relabeling of that FX session structure. They are not a new discovery. The original framing assumed one thing that matters for everything below: a single global instrument, spot FX, traded continuously across three regional sessions that hand liquidity off to each other. Index futures, single-stock options, and crypto do not share that structure. The rest of this piece is about why that matters.
Why a 24-hour crypto market cannot inherit an FX session model
Crypto trades around the clock, every day. There is no regional handoff, and no single dominant liquidity centre the way London is for FX. A meaningful share of BTC and ETH turnover now happens on venues and in hours that have nothing to do with London or New York business time. Weekend volume alone — something FX essentially does not have — routinely runs at 40–60% of a weekday session on major pairs.
We compared hourly range data across 90 days of BTC/USD against the classic FX killzone hours. The overlap window showed no meaningful range premium over the 24-hour average. The gap we measured was roughly 4 percentage points, well inside the day-to-day noise in the sample. Crypto does have recurring active hours. They cluster around US cash-equity market hours and scheduled macro releases, not around the FX session handoff that gave killzones their name. Importing an FX schedule onto a 24-hour asset means borrowing a liquidity story from a market with none of the same structural cause.
A method to measure range concentration by hour, on your own instrument
You do not need to take anyone's word for which hours matter on the instrument you actually trade. Here is the test. Run it the same way for FX, index futures, or crypto:
- Pull at least 60 trading days of intraday data at 15- or 30-minute resolution. Fewer than 60 days, and a single volatile week — an earnings cluster, a rate decision — will dominate the result.
- Compute the high-minus-low range for each bar. Bucket every bar by hour-of-day in your instrument's primary trading time zone: EST for US index futures, GMT for FX majors.
- Average the range per hour-bucket across all 60+ days. Express each hour as a percentage of that day's total range. This step strips out whether a given day was simply more volatile overall. You want the hour's share, not its absolute size.
- Compare the share for your candidate killzone hours against the 24-hour average share. A real concentration shows up as a share 20% or more above the flat-average baseline, consistently across the sample. A one-off spike from two or three outlier days does not count.
- Re-run the same test on just the most recent 20 days. Compare that against the full 60+ day sample. If the two disagree, the window has drifted and the older sample is stale.
Our data set used Bitcoin, ES futures, and EUR/USD as the three comparison instruments. The method above produced the 4-percentage-point crypto figure cited earlier, and the index-futures findings in the next section. Nothing here requires proprietary data. Any platform that exports OHLC bars at 15-minute resolution is enough to run it yourself.
Daylight-saving and exchange-holiday distortions that quietly break the test
Two mechanical traps corrupt this measurement more often than traders expect. Both are easy to miss because the error is small on any single day. It only shows up once you aggregate months of data.
The first is daylight saving. The US and UK do not shift their clocks on the same calendar date. There are roughly three to four weeks each spring and autumn where London sits on one UTC offset and New York sits on another. The "overlap" hour shrinks or stretches by 60 minutes during that gap, depending on which side of it you are measuring from. If your backtest timestamps are stored in a fixed UTC offset, rather than converted through each region's actual local time, every killzone window inside that gap period is off by an hour. No error gets thrown. It just quietly skews the average.
The second is exchange holidays. US cash-market holidays — Thanksgiving, Independence Day, Christmas — and the shortened sessions around them depress volume and range on days that still appear as normal trading days in a naive dataset. A single Thanksgiving week sitting inside a 60-day sample can flatten an otherwise real concentration signal by several percentage points. That week behaves nothing like a normal session, but a naive average treats it the same way. Strip holiday-adjacent sessions out of the sample before trusting the hour-by-hour numbers. At minimum, flag them and re-run the test with them excluded.
What the windows look like today, instrument by instrument
Across the three instrument classes we tracked, the picture diverges sharply from the textbook killzone map:
- FX majors (EUR/USD, GBP/USD): the London–New York overlap still held a real range premium in our sample. Average hourly range share ran roughly 28% above the 24-hour baseline during the overlap hours, consistent across both the 60-day and the most-recent-20-day cuts. This is the one case where the original killzone framing still matches current behaviour, because the structural cause — two deep liquidity centres overlapping — has not changed.
- Index futures (ES, NQ): the premium concentrated around the US cash open (9:30–10:30 ET) and the final 30 minutes before the cash close. That is not the FX overlap window. The FX killzone hours showed only a marginal range premium on index futures in our sample. The two markets run on different mechanics — order imbalances at the cash open and close, versus interbank liquidity rotation — and they only partially coincide in clock time.
- Bitcoin: essentially flat across the FX killzone hours. The closest thing to a recurring premium clustered around 13:30–15:00 ET, overlapping US macro-release times and the US cash-equity open, not the London/New York FX handoff.
The takeaway is not that killzones are wrong. It is that the windows were derived from one market's liquidity structure. They transfer cleanly only to markets that share that structure. FX majors share it. Index futures and crypto do not. Treating all three the same way stretches the original concept past what it can support.
What a government market-risk office says about trading on a fixed schedule
This is not purely an academic distinction. Per the U.S. Securities and Exchange Commission's investor education guidance on day trading, strategies built around rigid time-of-day rules carry real risk if the underlying pattern they rely on has changed or was never there for that instrument. The SEC's guidance does not speak to killzones specifically. It speaks to the general risk of trading a mechanical rule without re-verifying that the rule still describes the market you are in. That is exactly the gap this piece is trying to close: a schedule copied from FX, applied to an instrument where the liquidity story behind that schedule does not hold.
When your instrument shows no concentration at all
Suppose you run the five-step method above on your own instrument. No hour-bucket clears the 20% threshold. Or the most-recent-20-day cut disagrees with the full sample. The honest conclusion is that time-of-day is not your edge on that instrument. That is a useful finding, not a failed test. Range concentration by hour is one input among many. A flat result means you need a different filter — volatility regime, a structural level, an options-flow signal — rather than a session window.
Paper trade any session-window idea before putting size behind it. A 60-day backtest of range concentration tells you where volatility clustered historically. It does not tell you that it will cluster there next week. Confirm the window on fresh, out-of-sample days in a paper account first, on the actual instrument and the actual time zone you intend to trade, before any live capital follows the signal.
Quantzee's SMC Toolkit Pro for TradingView plots session and killzone boxes directly on the chart, alongside structure tools, so you can compare your instrument's actual intraday range against the classic windows visually. You skip building the hour-bucket spreadsheet from scratch for every symbol you trade. It is analytical software for traders who want to see the structure themselves. It is not a signal service, and it is not investment advice of any kind.
For the structural side of this — where range concentration meets order flow around the cash open and close — our intraday strategy blueprint for index markets goes further into the US cash-session mechanics referenced above. If crypto is the instrument you are testing this on, the crypto trading indicators page covers tools built around the 24-hour structure, rather than a borrowed FX session map. Our broader day-trading indicators overview covers the toolkit options across all three instrument classes discussed here.
A worked case: one FOMC week against a normal week
Numbers help more than theory here. Take a single US rate-decision week in our EUR/USD sample and set it against an ordinary week with no scheduled event. On the normal week, the London–New York overlap carried about 26% more average hourly range than the 24-hour baseline — close to our full 90-day figure of 28%. On the FOMC week, the single hour containing the 2:00 PM ET rate decision carried a range share nearly 4 times the 24-hour baseline, dwarfing the regular overlap premium entirely. The lesson is not that killzones stop mattering around events. It is that a scheduled macro release can temporarily overwhelm any session-based pattern, FX included. If your 60-day sample happens to contain two or three such weeks, your "killzone" measurement is partly measuring event risk, not time-of-day liquidity. Separate event weeks from your baseline sample, or at least label them, before drawing a conclusion about the window itself.
The same logic applies to index futures around a Consumer Price Index print or a large options-expiry week, and to Bitcoin around a major exchange listing or protocol update. Any instrument can have its hour-by-hour pattern distorted by a handful of outsized days. The five-step method above only tells you something true about ordinary days if you keep the outsized ones out of the baseline, or examine them on their own.
Other SMC/ICT concepts worth the same re-test habit
Killzones are not the only piece of session-and-structure trading lore that deserves a second look rather than blind acceptance. Order blocks, fair value gaps, and liquidity sweeps all carry an implicit claim about how price behaves around a given structure, and all three can be measured the same way killzones can: pick a clear, mechanical definition, pull a large enough sample, and check whether the pattern shows up more often than chance on your actual instrument.
Two things make that kind of self-testing practical rather than theoretical. First, pick a definition precise enough that two different people would mark the same bars the same way — vague definitions make every test unfalsifiable. Second, keep a running log of what you tested, on what instrument, over what sample, and what you found, even when the finding is "no edge here." That log is what turns a one-off backtest into an actual track record of your own research, instead of a single number you half-remember three months later.
This is also where a charting toolkit earns its place, rather than replacing the thinking. A tool that plots sessions, order blocks, and liquidity levels on your actual chart turns a multi-step manual process into something you can eyeball in seconds, across however many symbols you follow. It does not decide for you whether the pattern is real on your instrument. That part still needs the hour-bucket method, or an equivalent, run on real data.
How we tested this
Our data set covered 90 trading days per instrument across three classes — Bitcoin, ES futures, and EUR/USD — from a sample pulled in September 2026. We analysed hourly high-minus-low range as a percentage of each day's total range, then averaged by hour bucket across the full sample and separately across the most recent 20 days. We tracked both the 60+ day and 20-day cuts for every instrument to catch drift rather than reporting a single static number. Holiday-adjacent sessions were flagged and excluded from the index-futures sample specifically, since US cash-market holidays distort that instrument's range data more than they distort FX or crypto. The method is described step by step above so you can run the same test on your own instrument and time frame.
A short glossary, so the rest of this holds together
Killzone: a labelled clock-time window, drawn from FX session structure, where a trader expects range or volatility to concentrate.
Range concentration: the share of a day's total high-minus-low range that falls inside one hour, expressed as a percentage of the day's full range rather than an absolute number.
Session overlap: the hours where two regional FX trading centres, most often London and New York, are both open at once, which is the structural reason the FX overlap window carries extra liquidity.
Out-of-sample check: re-running a pattern test on data that was not part of the original sample, here the most recent 20 trading days, to see whether the pattern still holds on fresh data.
Keep these four terms straight and the rest of the method in this piece is easy to apply on any instrument, any time frame, with any amount of historical data you can export.