The ICT Silver Bullet is sold as a mechanical model. You wait for a one-hour window, you take the first fair value gap that forms, you place a stop and a target, and you're done. Every page that ranks for "ict silver bullet" teaches it that way. Not one of them tells you how many windows actually hand you a gap to trade.
That's the missing number, and it's the one this article is about. The clock is the only fixed input in the model. Whether a setup appears inside the clock is up to the market, and nobody publishes the frequency. So before you argue about entries, stops or targets, count. This post gives you the sequence in plain terms, shows where the ranking pages disagree, and then hands you a counting protocol you can run on your own chart, the same way we handled turtle soup by fixing a penetration depth and a bar-count limit first.
One thing up front, because it matters for how much you should trust anything below: our team has not run this count at scale and published a result. What follows is a method, not a finding. Where a number appears, it's either a calendar fact or a clearly labelled illustration.
What the ICT Silver Bullet Is, and Where the Ranking Pages Disagree
The ICT Silver Bullet is a time-boxed intraday pattern from the Inner Circle Trader material. It lives inside a one-hour window, and it needs a specific order of events inside that hour. If you want the full six-condition checklist, we wrote it up separately in our Silver Bullet requirements checklist. This article skips the explainer and goes at the part the explainers leave out.
Start with how the three pages we read describe it, because they don't agree.
- According to LuxAlgo's article (dated July 2025, roughly 3,600 words), the model has three windows in New York time: 03:00 to 04:00, 10:00 to 11:00, and 14:00 to 15:00. It adds entry, stop and target guidance, and it's the only page of the three that says plainly that no audited statistics exist.
- Per the FluxCharts article (about 1,200 words, undated), the same three windows apply, quoted in EST. It gives two stop and target variants and a 1:2 risk-to-reward default, and it mentions a backtesting dashboard inside its own indicator without printing a result.
- The Stay At Home Trader page (about 2,000 words, undated) narrows everything to the 10:00 hour on index futures, with a hard close at 16:00 New York time. It has sections titled "Results and Testing" and "Analyzing the Win Rate" that contain no number, no sample size and no date range.
So one source teaches three windows and another trades one. That's not a small difference. It's a factor of three in how many chances a day you're supposed to have, and none of the three pages says which version produced whatever win rate they imply. You can't evaluate "the Silver Bullet" until you decide which one you mean.
The Three ICT Silver Bullet Time Windows, and the Daylight-Saving Trap
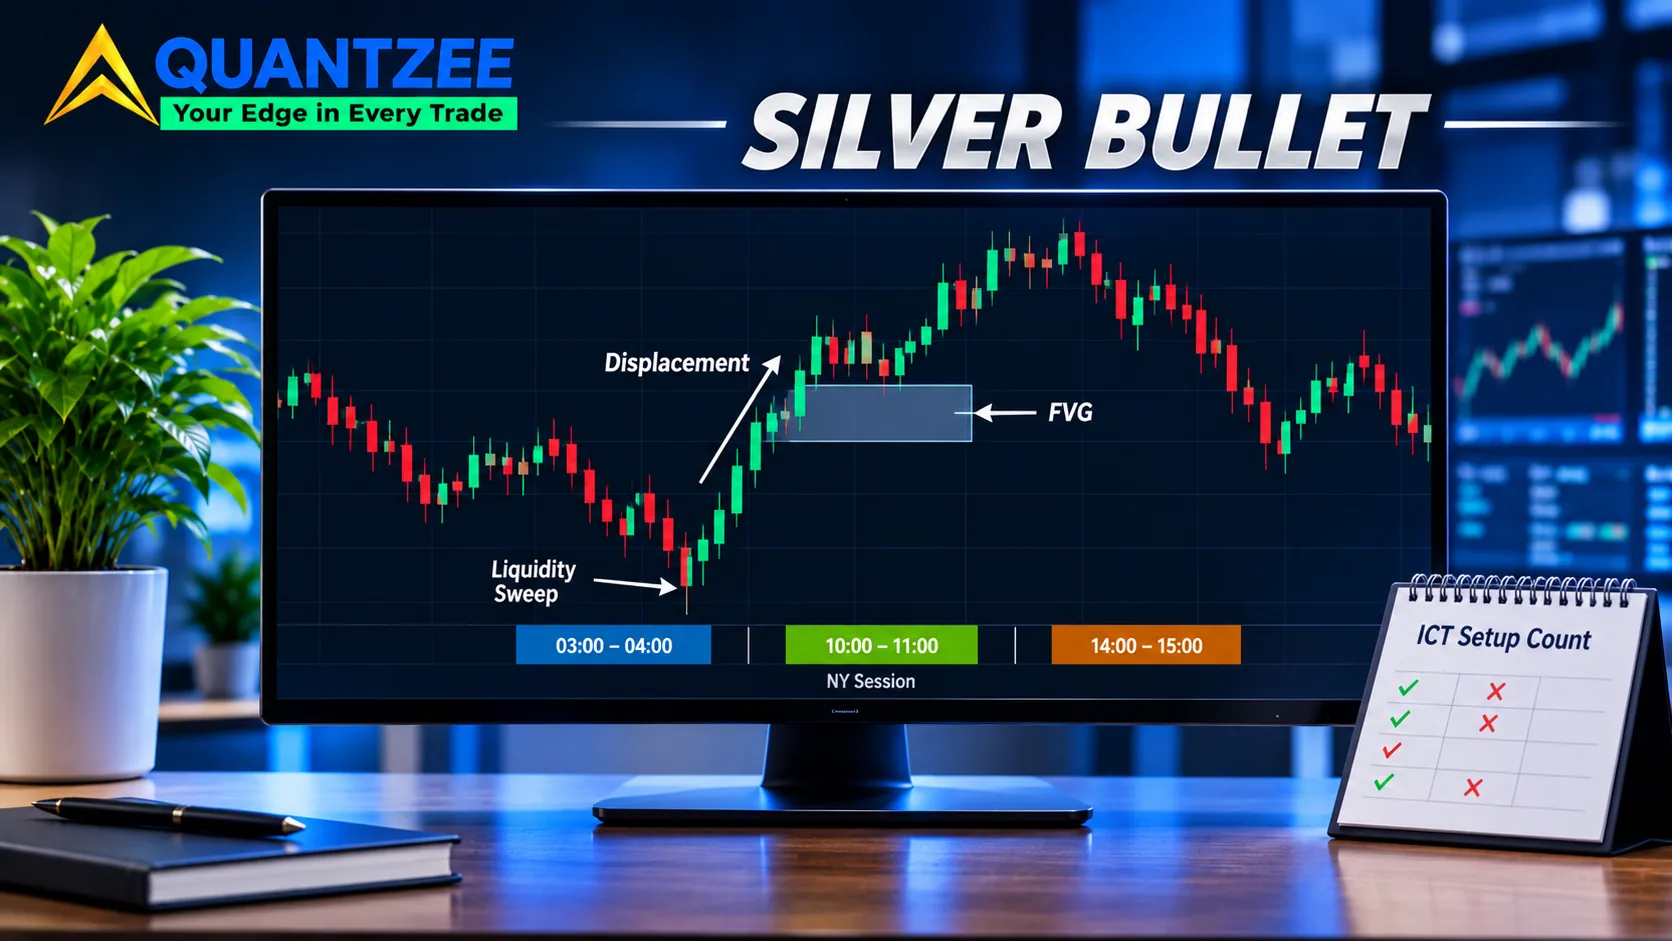
This is the ict silver bullet time window list as the two multi-window pages give it, in New York time:
- 03:00 to 04:00 (the London-open hour)
- 10:00 to 11:00 (the New York morning hour)
- 14:00 to 15:00 (the New York afternoon hour)
If you trade from Europe, there's a trap in those numbers. The windows are defined in New York clock time, and New York and Europe don't change their clocks on the same dates. In 2026 the US moved to daylight time on March 8 and goes back on November 1. The EU moved on March 29 and went back on October 25. For most of the year, 10:00 in New York is 16:00 in Frankfurt. But between March 8 and March 29, and again between October 25 and November 1, the gap shrinks by an hour, and 10:00 in New York is 15:00 in Frankfurt.
Miss that and you trade the wrong hour for about four weeks a year, with a chart that looks completely normal. Set your platform's session clock to America/New_York and stop converting in your head. The National Institute of Standards and Technology publishes the official US time reference if you want to check what the clock says right now.
The disagreement over windows matters here too. If your platform is on New York time and you adopt the single-window version, you're watching a hundred percent of 10:00 to 11:00 and nothing else. If you adopt the three-window version, you're committing to a 03:00 start, which is 09:00 in Frankfurt on a normal week. Pick one definition, write it down, and keep it for the whole count.
The Sequence That Has to Happen Inside the Window
Strip away the branding and the model needs three events in order. Order matters. A gap with no event before it is just a gap.
First, a run on resting liquidity. Price trades through an obvious prior high or low, the kind of level where stop orders pile up. We broke down what that looks like bar by bar in the four-bar liquidity sweep sequence.
Second, displacement the other way. After the run, price reverses hard, in a few large-bodied candles with little overlap. "Hard" is the word everyone leaves undefined, so we put numbers on it in our displacement measurement post, which compares an ATR multiple, a body-to-range ratio and close location.
Third, the gap the displacement leaves behind. A fair value gap is a three-candle imbalance. The first candle's high sits below the third candle's low (for a bullish gap), and the middle candle's range is never revisited by its neighbours. When we marked 500 of these across ES, BTC and EURUSD, the thing that stood out was how unevenly they appear; the fill-rate numbers are in that study.
Now notice what the clock does and doesn't control. It decides when you're allowed to look. It does nothing to make a sweep happen, make the reversal violent, or make the candles leave a gap. Those are the market's decision, hour by hour. That's why the gap, not the clock, is the binding condition.
Two Ways a Window Closes Without a Setup
Every window you watch ends in one of three states: setup, or one of two kinds of nothing. The two kinds of nothing are different, and your log should keep them apart.
The quiet hour. Price drifts. It might not take out any obvious level, or it takes one out and then just keeps going with no reversal. There's no sweep-then-displacement, so there's nothing to look for a gap in. The model never starts.
The overlapping hour. The sweep happens and price reverses, and it even looks decisive on a zoomed-out chart. But zoom in and the candles overlap. Candle one's high is above candle three's low, so there's no imbalance, no gap, no entry. The model started and then failed at the last condition. This is the one traders argue about, because a loose reading of "gap" will find something in almost any reversal.
You'll also hit a third, messier case, where a gap does form, but at 11:04. That's outside the window under any version of the rule. Log it as no setup, with the reason "late", and resist the urge to count it.
A Counting Protocol for the ICT Silver Bullet Strategy
Here's the part no competing page has. It's an ict silver bullet strategy test that asks one question before any profit question: on how many sessions does the pattern even appear? The method is deliberately boring.
Fix four things before you look at a single chart.
- Instrument. One. ES or NQ futures, or one major pair like EURUSD. Not a basket.
- Timeframe. One. Many traders use the 1-minute or 5-minute chart for the gap itself. At 5 minutes, a one-hour window holds 12 bars; at 1 minute, it holds 60. Pick it now and never change it mid-count.
- Window. One definition. Either the three NY windows or the single 10:00 hour. If you want to compare, run two separate counts, not one blended one.
- Number of sessions. Decide your stopping point in advance. 60 trading sessions is roughly three months, and that's the minimum we'd call a first read.
Then write one line per window per day. No screenshots, no commentary, no trade. Just the verdict and the reason. A counting sheet looks like this:
| Date | Window (NY) | Result | Reason |
|---|---|---|---|
| Day 1 | 10:00–11:00 | No setup | Quiet hour, no sweep |
| Day 2 | 10:00–11:00 | Setup | Sweep of prior high, 3 displacement candles, gap at 10:25 |
| Day 3 | 10:00–11:00 | No setup | Sweep and reversal, candles overlap, no gap |
| Day 4 | 10:00–11:00 | No setup | Gap formed at 11:04, outside window |
Three rules keep the sheet honest. Decide the gap definition first, for example a minimum size as a multiple of ATR, and don't loosen it when a count looks thin. Record the verdict before you look at what price did afterward. And never delete a "no setup" line. The no-setup days are the whole point; they're the denominator.
What the result tells you. At the end you have a frequency per window: setup days divided by sessions watched. Here's a made-up example to show the arithmetic, not a result anyone has measured. Suppose that over 60 sessions the 10:00 window showed a valid setup on 24 days. That's 40%. With a sample of 60, the rough 95% margin on that figure is about 12 percentage points either side, so the honest reading is "somewhere between about 28% and 52%," not "40%." That margin is the reason we say 60 sessions is a first read, not a conclusion. Count 240 sessions and it tightens to roughly 6 points.
If the same sheet shows the quiet hour is most of the "no setup" days, the model is mostly a question of whether the market sweeps anything. If the overlapping hour dominates, the model is mostly a question of how strict your gap definition is. Those lead to different next steps, and you'd never know which applies without the reason column.
Entry, Stop and Target Variants Come After the Count
Only once you know how often the setup appears does it make sense to look at the trade mechanics, and even then it helps to treat the ranking pages' rules as variants with different evidence behind them, not one settled rule.
The FluxCharts page offers two stop and target variants and defaults to 1:2 risk-to-reward. LuxAlgo includes its own entry, stop and target guidance. Stay At Home Trader uses the 10:00 hour on index futures with a 16:00 close. Those aren't three versions of one answer. They're three different rule sets, and each would need its own count and its own results before you could say which holds up.
The practical consequence is about sample size, not preference. Say you pick the single-window version, and your count shows a valid setup on around a third of sessions. Over 60 sessions that's about 20 trades to evaluate a stop placement on. Split those across two stop variants and you're comparing groups of 10. That's too thin to pick between them, and it's the reason to test one variant at a time and hold the rest fixed. The three-window version triples the chances per day, but only if all three windows really produce setups, and that is exactly what the count is for.
Why a Hard Time Stop Makes the Model Reviewable
The one design feature we like about the Silver Bullet, whatever you think of the entry, is that it's time-boxed. The window has a start and an end, and the Stay At Home Trader version adds a hard close at 16:00 New York time. That's a rule you can audit.
Compare that with an open-ended setup, where a trade can be held until it works or the account stops it. With no end time you can't say what a "session" of the strategy was, because there's no fixed unit to count. With a fixed hour and a fixed close, every session has the same shape: one window, one verdict, one outcome by a known time. That's what lets you build a table of 60 rows and mean something by it. A time stop isn't only risk control. It's what makes the dataset comparable day to day.
Which Instruments Fit the ICT Silver Bullet
The windows are in New York time for a reason: the model was built around the cadence of the US session and the London to New York handover. That makes it a natural fit for index futures like ES and NQ and for major currency pairs such as EURUSD and GBPUSD, where those hours carry real flow.
It's a poor fit for an instrument with no New York cadence. A crypto pair trades around the clock, so 10:00 New York time isn't special to it, and a thinly traded stock or a regional index may be nearly asleep in the 03:00 hour. We looked at this question more broadly in which ICT session windows still hold by market. For this model the count itself will tell you: an instrument with no cadence will show a frequency that's flat across the day, or a reason column full of quiet hours.
For the wider map of how the Silver Bullet sits against order blocks, killzones and the other pieces, see the ICT framework in one page.
What an Unaudited Win Rate Claim Is Worth
Most Silver Bullet content ends with a confident line about win rate. Treat it the way you'd treat any performance claim with nothing underneath it. The FINRA day trading risk guidance is blunt about how rare consistent short-term trading profit is, and a bare percentage from a vendor page doesn't change that.
Wording to distrust:
- A win rate with no sample size ("up to 80%").
- A win rate with no date range, so you can't tell if it's one good month.
- A win rate with no instrument or window named.
- "High probability" with no definition of the probability or the denominator.
- Any figure that doesn't say whether costs and slippage are in it.
And one more, which is the point of this whole article: a win rate with no frequency. A 70% win rate on a setup that appears twice a quarter is a different thing from 70% on a setup that appears most days. Frequency is the denominator the win rate sits on. Two of the three pages we read have headings that promise results and then print none. LuxAlgo, to its credit, says no audited statistics exist.
Quantzee's SMC Toolkit Pro can mark sweeps, displacement and gaps on a chart, which speeds up the logging. It's analytical software, not advice, and it doesn't tell you whether a setup is worth taking. Paper trade first, count first, and decide after.
Frequently Asked Questions
Changelog: Published 5 November 2026. Window times and source descriptions reflect the LuxAlgo, FluxCharts and Stay At Home Trader pages as read on that date. This article describes a counting method; no setup-frequency result has been measured or published by Quantzee.