Every support and resistance indicator on TradingView makes the same bet: that you'll judge it by how tidy the chart looks. Clean horizontal lines, a few shaded zones, a "no repaint" badge in the title. None of that tells you how the tool decided a level existed, or when it found out.
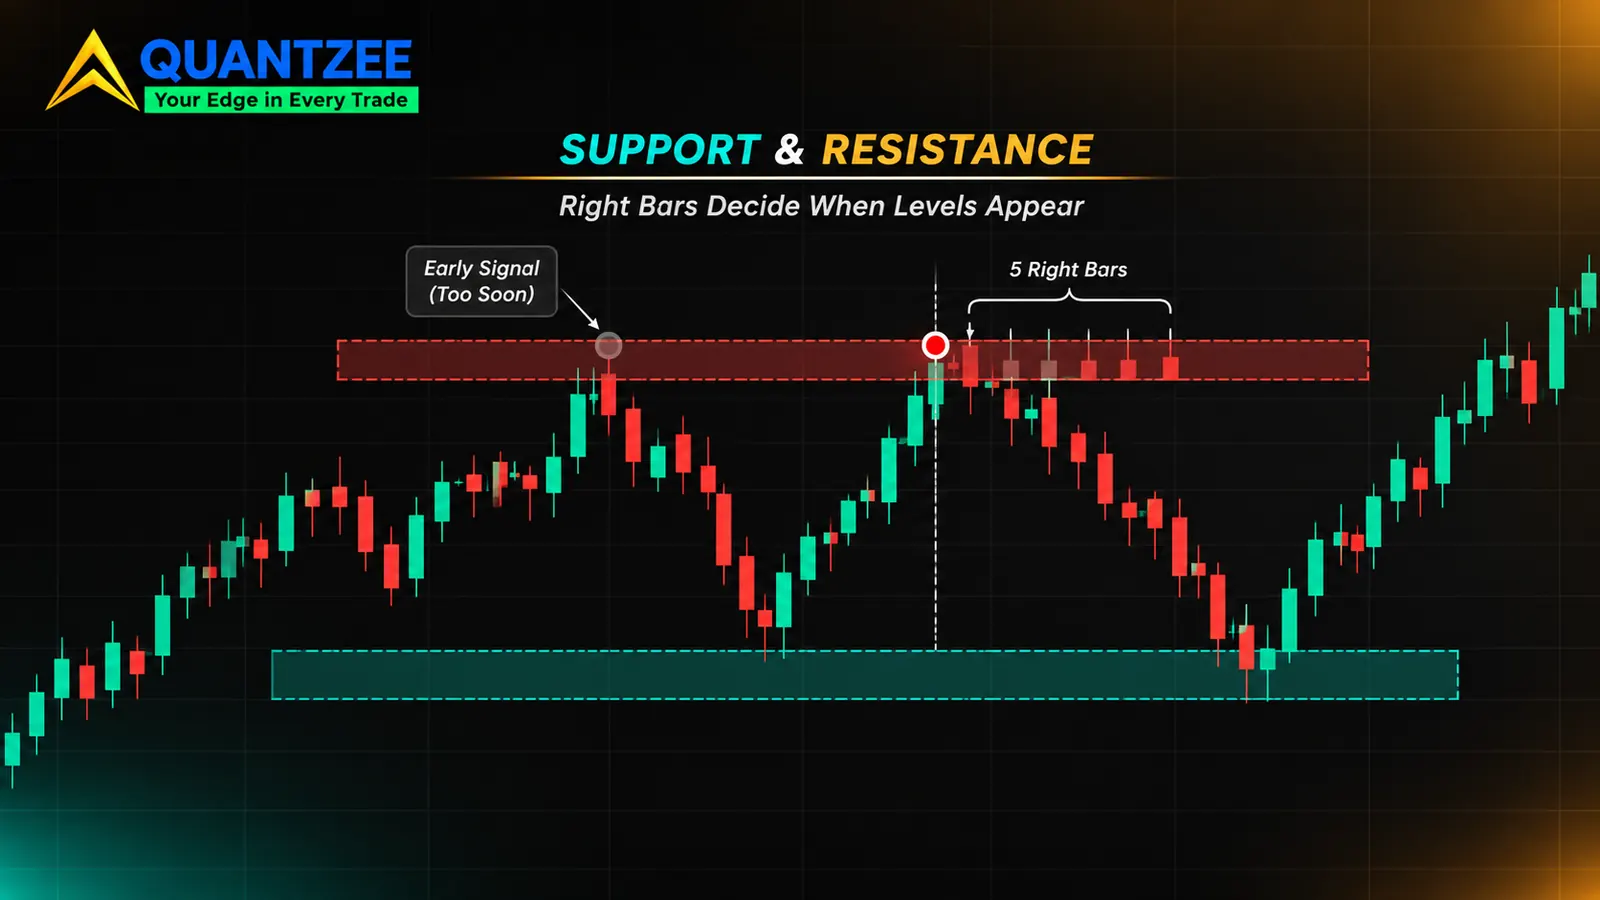
This post is about the second question, because it's the one that costs people money. An automatic support and resistance indicator on TradingView does two things under the hood: it finds pivots, then it groups nearby pivots into levels. The pivot step needs a number of bars to the right of a high before it will call that high a high. That single number, the right-bars setting, decides whether a level shows up as it forms or several bars late. It's also what the "no repaint" claim is really about.
We're not ranking scripts here. Nobody, including us, has measured the accuracy of the scripts on the library page, so any ranking would be an opinion dressed as data. What follows is a way to read any of them: the detection rule, the confirmation lag, the merge tolerance, and a replay test you can run yourself.
What does an automatic support and resistance indicator actually do?
Strip the branding off and two steps remain.
Step one: pivot detection. A pivot high is a bar whose high is above the highs of the bars on either side of it. A pivot low is the mirror image. "Either side" is defined by two settings, left bars and right bars. Per the Pine Script reference, the built-in ta.pivothigh and ta.pivotlow functions take exactly those two counts, and a pivot is only reported once the right-hand bars have printed.
Step two: clustering. Raw pivots are scattered. Fifty pivot highs on a chart would be fifty lines, which is useless, so the script merges pivots that sit close together into one level or one zone. The merge distance is the second hidden setting, and it's the one most listings don't state.
That's the entire mechanism for most of the "auto" tools. Some add volume weighting or a strength score, but the skeleton is pivot, then cluster. Once you know that, a vendor's feature list becomes a set of answerable questions: how many bars on each side, how wide is the merge band, and what happens to a level after it's drawn?
How the right-bars setting creates lag: a worked count
Here's a constructed series of bar highs. These are illustrative numbers for the arithmetic, not market data. With left bars = 5 and right bars = 5, bar 6 is a pivot high only if its high beats the five bars before it and the five after it.
| Bar | 1 | 2 | 3 | 4 | 5 | 6 | 7 | 8 | 9 | 10 | 11 |
|---|---|---|---|---|---|---|---|---|---|---|---|
| High | 101.2 | 101.8 | 102.4 | 103.1 | 103.9 | 104.6 | 104.0 | 103.5 | 103.2 | 102.7 | 102.9 |
Bar 6 at 104.6 is above everything on its left. But the script can't know that it's a pivot until bars 7 through 11 have all closed lower. Bar 11 is the fifth closed bar after the high. So the level at 104.6 first appears when bar 11 closes, five bars after the price actually peaked.
Turn that into clock time and the lag stops being abstract:
- On a 5-minute chart, 5 right bars = 25 minutes of waiting.
- On a 15-minute chart, 5 right bars = 75 minutes.
- On a 1-hour chart, 5 right bars = 5 hours.
- On a daily chart, 5 right bars = 5 trading days, a full week.
Drop right bars to 1 and the lag shrinks to a single bar, but you pay for it in noise: with one bar of confirmation, nearly every small wiggle qualifies as a pivot. Raise it to 10 and you'll get far fewer, more meaningful levels, which arrive twice as late. There's no free setting. A short right-bars count buys speed with false pivots, and a long one buys cleanliness with delay.
Now the part vendors skip. When the script finally confirms the pivot on bar 11, it draws the level back at bar 6, at 104.6. On your screen that looks like the line was there all along. If you scroll back through history, the line is sitting neatly under the peak, as though the tool called it in real time. It didn't. It called it five bars later and drew backwards. Any backtest or visual review of that chart flatters the tool by exactly the confirmation lag.
What does "repainting" mean for a support and resistance level?
The word gets used for two different behaviours, and mixing them up is how bad scripts survive.
A level drawn late. This is the confirmation lag above. The level appears after the pivot bar, then stays put. It's honest in the sense that nothing changes once it's there, but a chart screenshot will show it earlier than you could have seen it live.
A level that moves or vanishes after it was drawn. This is true repainting. It happens when the script recalculates on the live bar, uses a pivot window that includes unclosed bars, or pulls in higher-timeframe data in a way that rewrites history. The level you saw at 10:15 isn't where it sits at 11:00.
So what does a "no repaint" badge on a listing promise? In practice it's a statement about the pivot rule: pivots are only evaluated on closed bars, and once a pivot is confirmed it never changes. That can be perfectly true and the level can still be late. A script can be non-repainting and have a 20-bar confirmation delay. The badge says nothing about the delay unless the listing states the right-bars value. The Pine Script documentation has a dedicated page on repainting, linked in the sources below, and it's worth reading once so you know the vocabulary the script authors are using.
If you want the broader version of this argument for any indicator, not just levels, our guide to non-repainting TradingView indicators covers what "non-repainting" can and can't mean, and the step-by-step repainting test for a TradingView indicator covers the general checks. This post narrows that down to levels specifically.
A replay test you can run on any level indicator
Status: this is a protocol. We have not run it on any third-party script, and nothing below is a result. It's written so you can run it and decide for yourself.
The methodology is simple: watch the chart in replay mode and write down when each level first appears, then compare to where it sits now.
- Pick a test setup and freeze it. One instrument, one timeframe, one bar range. Write down the indicator version and every setting. A 300-bar window is enough to produce a dozen or so levels.
- Open Bar Replay at the start of the window and step forward one bar at a time.
- Log each level the first time it appears. Record the bar number it showed up on, its price, and the bar number of the pivot it claims to mark. The gap between those two bar numbers is the observed confirmation lag.
- Keep stepping. After every new bar, check whether any logged level moved, disappeared, or changed from line to zone. Any change is a repaint, in the strict sense.
- Finish the window, then load the same range live with no replay. Compare the final chart to your log. Levels that exist on the final chart but never showed up in your log at the time you'd have needed them are the ones drawn backwards.
Three numbers come out of this: the typical lag in bars, the count of levels that moved or vanished, and the count of levels that only exist in hindsight. If the second number is above zero, the "no repaint" claim doesn't hold for your settings. If the first number is bigger than the listing implied, you've found the real cost of using it.
One caution on replay itself. Replay is not a perfect model of a live feed, and a script that behaves one way in replay may behave differently on a real-time bar. Treat replay as the first filter, then watch the same script live for a few sessions before you trust it.
Clustering tolerance: how close is "the same level"?
Pivots almost never land on exactly the same price. Two highs at 103.0 and 103.2 are the same ceiling to anyone watching, but a script needs a rule. The usual rule is a tolerance band: if a new pivot lands within the band of an existing level, it joins that level instead of starting a new one.
Watch what the band does to the level count. Take eight pivot highs, sorted: 100.0, 100.3, 101.1, 101.4, 102.9, 103.0, 103.2, 105.0. Anchor each group to its first member and merge any pivot within the tolerance of that anchor:
| Tolerance | Levels produced | Count |
|---|---|---|
| 0.2 | 100.0 · 100.3 · 101.1 · 101.4 · (102.9, 103.0) · 103.2 · 105.0 | 7 |
| 0.5 | (100.0, 100.3) · (101.1, 101.4) · (102.9, 103.0, 103.2) · 105.0 | 4 |
| 1.5 | (100.0 to 101.4) · (102.9, 103.0, 103.2) · 105.0 | 3 |
| 3.0 | (100.0 to 103.0) · (103.2, 105.0) | 2 |
The same eight pivots become seven levels or two, depending on one number. A band that's too tight gives you a cluttered chart of near-duplicates. A band that's too wide collapses distinct ceilings into one thick zone, and at 3.0 the 100.0 low-end pivot and the 103.0 pivot are "the same level" despite being three full points apart. That zone is so fat that price is inside it half the time, which makes it look like a level that "always works" when it's really just a big rectangle.
Where a script anchors the group matters too. Anchoring to the first pivot, to a running average, or to the nearest member each give different results on the same data, and chaining (each pivot joins if it's near any member) can snowball a long run of small steps into one enormous zone.
Why the tolerance should scale with volatility
A fixed tolerance of, say, 0.5 points is sensible on one instrument at one moment and absurd on another. If the average bar range doubles, price wanders twice as far around a "single" level, and a fixed band starts splitting one level into two. The fix is to size the band from a volatility measure such as average true range. The average true range is the common choice, and a band of a fraction of ATR keeps the same proportional meaning across instruments and across calm and wild sessions.
So when a listing offers a "sensitivity" slider and nothing else, ask what it's controlling. If it's a fixed price distance or a fixed percentage, the tool will behave differently on a quiet day than on a news day. If it's an ATR multiple, the setting travels. Neither is wrong, but you should know which one you're running.
Touch count: strength, or just traffic?
Many tools display a touch count next to each level, and traders read a high number as a strong level. It's a reasonable idea with a hole in it. A count of touches treats two very different events as the same thing:
- Price reaches the level and gets rejected. The bar closes back on the original side. The level held.
- Price reaches the level, closes through it, and then drifts back and forth around it for a dozen bars. Each bar that overlaps the band adds to the count, but nothing held.
A level with 9 touches can be one that rejected price three times and was then sliced through, or one that rejected price nine times. Both show "9". The number alone can't separate a level that held from a level that price simply visited.
If you're evaluating a tool, or building your own check, record two counts per level instead of one: rejections (touches where the close finished back on the starting side) and closes-through (bars that closed beyond the band). A level with many rejections and zero closes-through is telling you something. A level with a high total and several closes-through is telling you about traffic. The support and resistance glossary entry goes through the basic ideas of breakout, retest and rejection that these two counts map onto.
It also pays to ask whether touches are counted before or after the level was confirmed. A touch that happened between the pivot bar and the confirmation bar was invisible to you live. A tool that includes those in its count is again flattering itself with hindsight.
The timeframe problem: where was the level detected, and where are you looking?
Plenty of level indicators let you detect on one timeframe and display on another. That's useful: a daily level drawn on a 15-minute chart is a genuine point of interest. But it adds a question that listings rarely answer: which timeframe did the pivot rule use?
The right-bars count is in bars of the detection timeframe. Five right bars on a daily detection is five trading days of lag, even if you're staring at a 5-minute chart. The level may pop onto your intraday chart looking instant, when the daily bar it describes closed days ago. The reverse trap is a higher-timeframe value that appears on historical lower-timeframe bars before that higher-timeframe bar had actually closed. Historical bars then show a level that wasn't knowable at that time, a form of repainting that only shows up when you compare history to live behaviour. The Pine Script documentation on repainting discusses this class of problem for higher-timeframe data.
The practical check is in your replay log: for any multi-timeframe level, record when it first appeared and compare that to the close of the higher-timeframe bar that produced it. If it showed up earlier, the history on your screen is telling you something the live feed never did.
The built-in pivot tool is the baseline any paid script has to beat
TradingView ships its own pivot detection. The ta.pivothigh and ta.pivotlow functions are the primitive nearly every script builds on, and there's a built-in Pivot Points High Low indicator that draws them with your chosen left and right bars. It's free, its rule is public, and its lag is exactly the right-bars number you typed in.
That makes it the honest comparison point. A paid or closed-source level script is making a claim that its levels are better than "pivots with a lookback, merged by some tolerance". To beat that baseline it would have to show, on the same instrument, timeframe and bar range:
- the same or shorter confirmation lag with fewer false pivots, or
- a merge rule that produces fewer duplicate levels without fattening zones into rectangles, or
- a strength measure that separates rejections from closes-through instead of counting visits.
And it would have to show that with the numbers laid out: lag in bars, level count, how many levels moved. A prettier chart doesn't count. Neither does a feature list. We haven't run that comparison on anyone's script, and per the evidence we could find, none of the pages currently ranking for this phrase have published one either. One of them, a guide from Pineify, goes as far as telling readers to pick a mechanism they can explain and measure, which is the right instinct. It stops before explaining how the lookback changes repainting, which is the gap this post fills.
Where this leaves a structure-based toolkit
Our own indicators work on closed bars, and the SMC Toolkit Pro overlay describes itself as non-repainting on confirmed bars. Read that the way this post tells you to read any such line: it's a statement about the rule, so look for the confirmation settings in the docs and run the replay protocol above before you rely on it. The same applies to any structure or zone tool you add to a chart. If you draw levels by hand instead, the habits in drawing trend lines the same way twice serve the same purpose from the other direction: write the rule down first, then apply it.
Quantzee's tools are analytical software for studying price structure. Nothing here is a trading recommendation, and a level on a chart is a reference point for your own analysis, not a forecast. Paper trade any setup first, and test it on your own instruments before putting capital behind it.
If you trade Bank Nifty options, our guide to Bank Nifty support and resistance shows how to confirm these price levels against put and call open interest.
Frequently Asked Questions
Sources and changelog
- Pine Script documentation on repainting: tradingview.com/pine-script-docs/concepts/repainting, link checked 6 November 2026.
- Support and resistance background: Wikipedia, Support and resistance, link checked 6 November 2026.
- Average true range: Wikipedia, Average true range, link checked 6 November 2026.
- Competitor read: Pineify's support and resistance guide (dated February 2026).
Changelog. 6 November 2026: first published. The pivot and clustering examples are constructed arithmetic, not market data. The replay test is a protocol that has not been run on any third-party script. We'll add dated results here if and when it is.