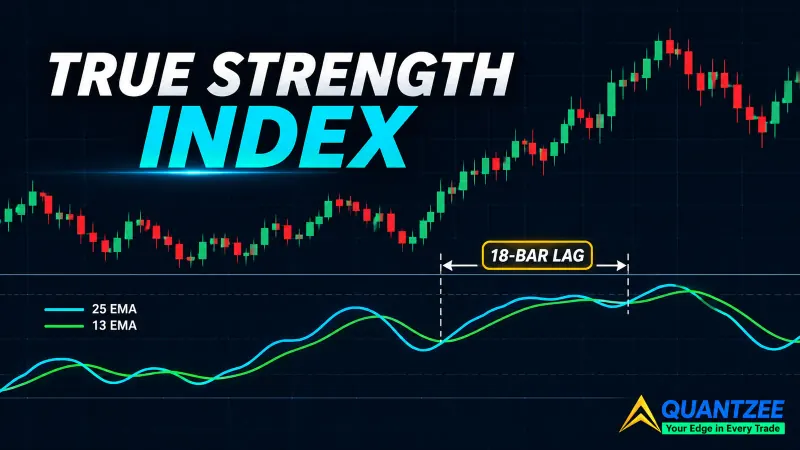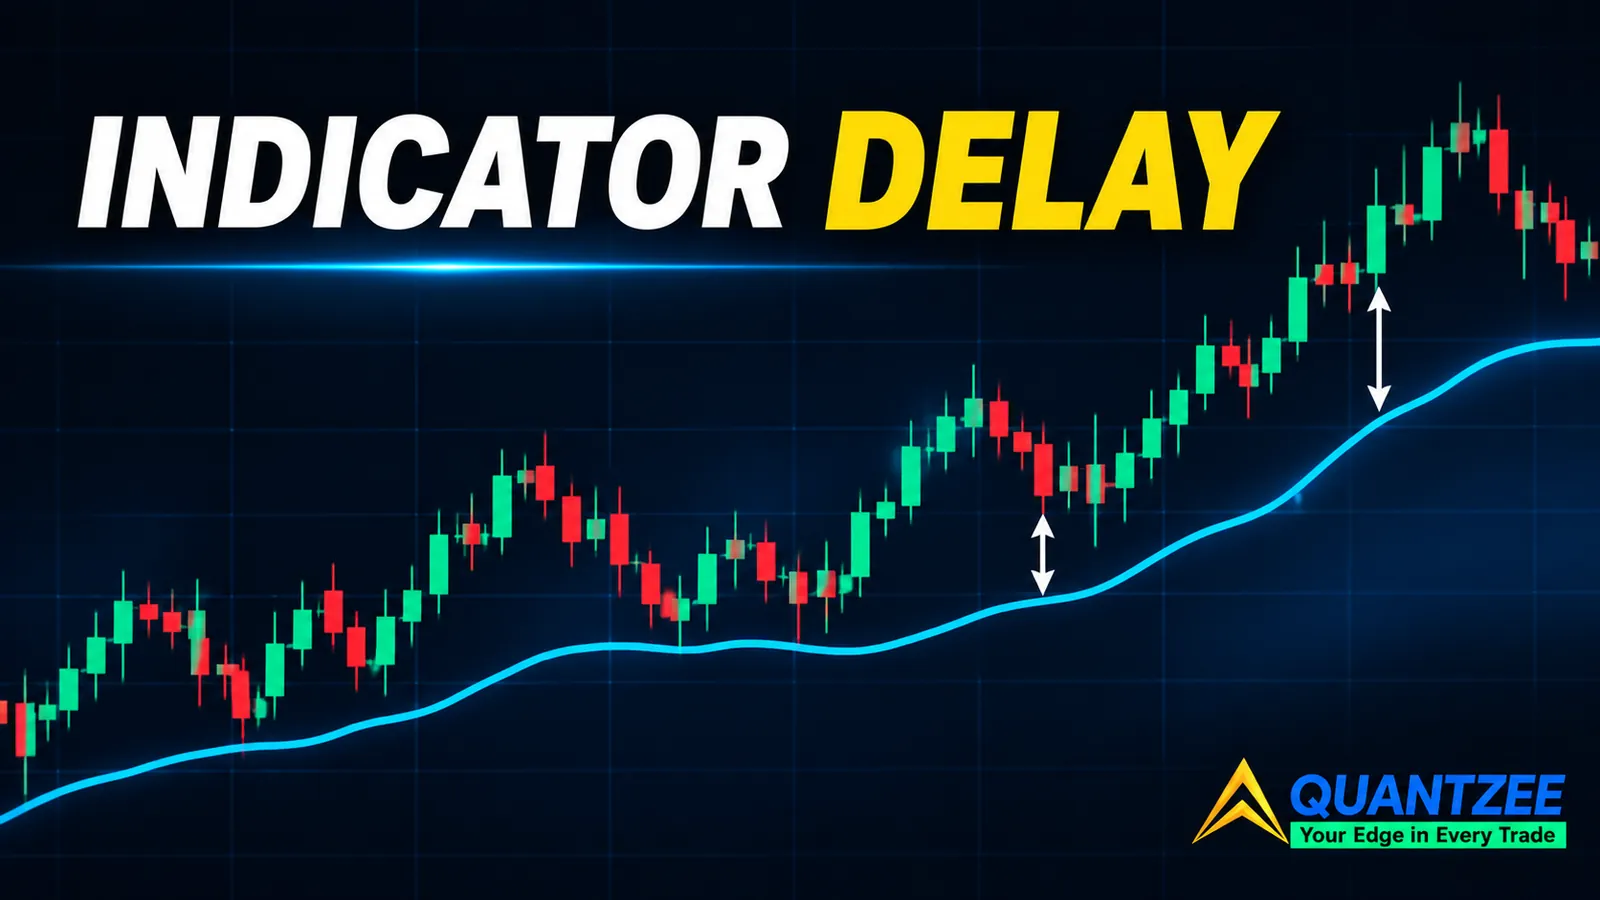
Almost every guide to indicators in technical analysis sorts them into "leading" and "lagging" and stops there. That vocabulary hides the useful part. An indicator is a weighted sum of past bars. Nothing in it comes from the future, so "leading" can only mean the weights sit nearer the present. The real question is how far back the weight sits, and that number falls straight out of the settings you already typed in. This post computes it, in bars, for the indicators most traders run.
The arithmetic is short enough to do by hand. We built every table below from the published definitions of each indicator, and the working is shown so you can check it against your own chart. None of it is a backtest, and none of it says a faster indicator makes more money. It tells you how old the information in your indicator is, which is a different and more checkable thing.
What indicators in technical analysis actually are
Strip away the families and the names and you get one machine: take recent prices (or volume, or range), multiply each bar by a weight, add the results. A simple moving average does it with equal weights. An exponential average does it with weights that shrink as bars get older. RSI, MACD, ATR and Stochastics are all built from those averages plus a bit of division or subtraction.
The usual taxonomy still has a job. Trend overlays such as moving averages describe direction. Momentum oscillators such as RSI describe the speed of recent moves. Volatility measures such as ATR describe the size of bars. Volume measures describe participation. If you want the full tour, the Quantzee guide to trading indicators and signals covers each family. For the rest of this post the families matter only because we will put one of each in a single table.
The one number behind every indicator: average age in bars
Pick any indicator that is a weighted sum. Multiply each bar's age (0 for the current bar, 1 for the one before, and so on) by its weight and add. The result is the average age of the information inside the number you are looking at. Call it the delay.
For a simple moving average of length N, every weight is 1/N and the ages run from 0 to N-1. The average age is (N-1)/2. Take an SMA(20): ages 0 through 19 average 9.5. When the SMA(20) prints a value, it is describing the market as it was about 9.5 bars ago. The SMA(50) sits 24.5 bars back, and the SMA(200) sits 99.5 bars back.
That is the whole mechanism. A "20-bar average" is not a 20-bar-old average, and it is not a current one. It is centred a bit under half its length behind the close.
The exponential case people get wrong
The common belief is that an EMA is "faster" than an SMA of the same length because it weights recent bars more. Faster at the front, yes. Shorter overall, no. Per the standard definition of exponential smoothing in the NIST/SEMATECH e-Handbook of Statistical Methods, each new value is a blend of the latest observation and the previous smoothed value, with a smoothing factor a. The EMA convention used on charts sets a = 2/(N+1), so a 20-period EMA uses a = 2/21, about 0.0952.
The weight on a bar that is k bars old is a times (1-a) to the power k. Sum k times that weight over all k and you get the average age: (1-a)/a. Put in a = 2/(N+1) and it simplifies to (N-1)/2. That is the same figure as the SMA. An EMA(20) is centred 9.5 bars behind, exactly like an SMA(20).
So what changes? The shape. We computed the weights for both averages at several depths:
| Bars back | SMA(20) weight | EMA(20) weight |
|---|---|---|
| 0 (current bar) | 5.00% | 9.52% |
| 5 | 5.00% | 5.77% |
| 10 | 5.00% | 3.50% |
| 19 | 5.00% | 1.42% |
| 20 | 0.00% | 1.29% |
| 50 | 0.00% | 0.064% |
| 100 | 0.00% | 0.0004% |
The EMA puts nearly double the weight on today's bar and about half as much on the bars from 10 to 19 back. It also keeps a tail. The newest 7 bars carry just over half of an EMA(20)'s weight, but bars older than 20 still carry 13.5% of it. The SMA drops a bar to zero the moment it leaves the window. That is why an EMA turns a little sooner after a sharp reversal and also why it keeps remembering a spike long after the SMA has forgotten it. Same centre of mass, different distribution around it.
Why a "length" is not a lookback
A trader who sets an EMA to 20 usually thinks of it as "looking at the last 20 bars". It isn't. The weights never reach zero. Using the numbers above, an EMA(20) still gives 0.064% of its value to the bar from 50 bars ago, and a little under 0.0004% to the bar from 100 bars ago. Those are small, but they are not nothing, and they matter in one situation: a huge bar. One extreme candle 50 bars back still nudges the average.
Lengthen the setting and the tail gets heavier. An EMA(50) puts 0.53% of its weight on the bar from 50 back and 0.072% on the bar from 100 back. Here is a useful fact: for any EMA length, about 13.5% of the total weight sits beyond N bars. We found that figure came out at 13.4% for N=10, 13.5% for N=20 and 13.5% for N=50. It is the same because (1-a) raised to the N is close to e to the minus 2 whenever N is more than a handful. The setting changes how many bars that 13.5% is spread over, not the share.
Stacked smoothing: why the MACD signal cross is the slowest thing on the panel
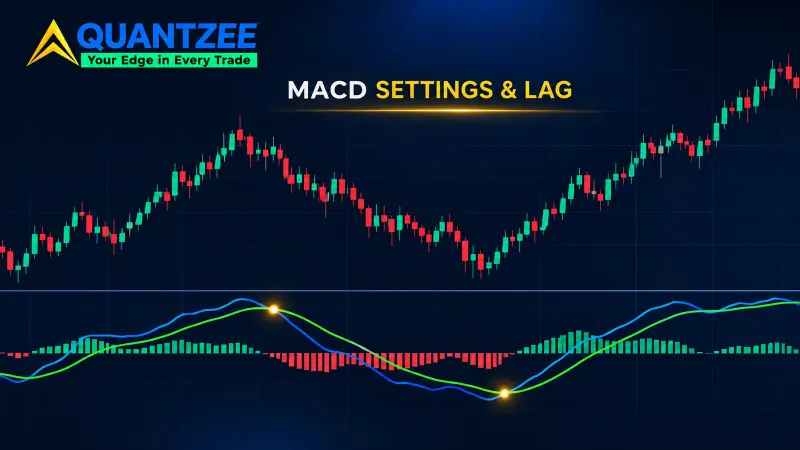
Delays add when you chain smoothers. MACD is the difference of two EMAs, and its signal line is an EMA of that difference. Take the default 12/26/9 settings.
- EMA(12): average age (12-1)/2 = 5.5 bars.
- EMA(26): average age (26-1)/2 = 12.5 bars.
- Signal line, EMA(9): adds (9-1)/2 = 4 more bars on top of whatever it is smoothing.
The MACD line is EMA(12) minus EMA(26), so it contains a fast leg at 5.5 bars and a slow leg at 12.5. Run it through the signal line and those become 9.5 and 16.5. A signal-line cross compares the MACD line to a copy of itself that is about 4 bars older, and the slow leg inside that copy is 16.5 bars behind the close.
It is not fair to say the cross "happens 16.5 bars late", because MACD is a difference and the delays partly cancel in the line itself. In a steady trend the MACD line is roughly 7 bars times the price slope (12.5 minus 5.5). What you can say is that the signal-line cross is built from the oldest information on the panel, and it needs the line to turn before it can cross its own lagged copy. Nothing else on a standard MACD pane is slower. If you act on the zero-line cross instead, you drop the signal line's 4 bars. The moving averages glossary entry has the definitions if you want to follow along.
One indicator from each family, in bars
Here is the table the post has been heading toward. Each figure is the average age of the information in the indicator at its common default, assuming the formula is applied exactly as published.
| Family | Indicator and setting | Smoothing | Average age (bars) |
|---|---|---|---|
| Trend overlay | SMA(20) | Equal weights, window 20 | 9.5 |
| Trend overlay | EMA(20) | a = 2/21 | 9.5 |
| Trend overlay | SMA(200) | Equal weights, window 200 | 99.5 |
| Momentum | RSI(14), each of average gain and average loss | Wilder, a = 1/14 | 13 |
| Volatility | ATR(14) | Wilder, a = 1/14 | 13 |
| Volume | Rolling volume-weighted average, window 20, flat volume | Weights proportional to volume | 9.5 |
| Volume | Session VWAP, 120 one-minute bars into the day, flat volume | Cumulative from the open | 59.5 |
| Chained | MACD(12,26,9) signal line, slow leg | EMA(26) then EMA(9) | 16.5 |
A few notes on how these were worked out.
Wilder's smoothing, used by RSI and ATR, is an EMA with a = 1/N instead of 2/(N+1). So Wilder 14 behaves like an EMA of length 27. Average age is (1-a)/a, which for a = 1/14 is 13 bars. Per the NIST handbook's overview of moving average and smoothing techniques, the general idea of smoothing by weighted past values is standard statistics, not trader folklore, and Wilder's version is a special case of it. About 35% of a Wilder-14 average's weight sits on bars older than 14 and about 2.5% on bars older than 50.
RSI is a ratio of two smoothed series, so its timing is not exactly 13 bars. Each input has that age. What you can rely on is that RSI(14) is a slower read than a 14-bar window suggests. ATR is a measure of range, not direction, so its delay shows up differently: a volatility expansion registers in ATR late, and a calm stretch after a spike is still reported as volatile for a while.
The volume row needs a caveat. If volume is flat across bars, a volume-weighted window behaves like an SMA. If one bar trades five times its usual volume, that bar gets five times the weight and drags the average toward its own age. So the 9.5 and 59.5 here are baselines, not constants. VWAP is the one on the table whose delay grows through the session, because the window keeps widening.
The families in one short paragraph
You do not need ten pages of taxonomy to use any of this. Trend overlays smooth price to show direction. Momentum oscillators smooth price changes to show speed. Volatility measures smooth bar ranges to show size. Volume measures weight price by activity. All four are the same weighted sum with different inputs, which is why one table could hold them. When three indicators on a chart agree, check whether they share inputs and smoothing before counting them as three confirmations. Often they are one reading, delayed three slightly different ways.
Delay is not error: filter versus trigger
It would be easy to read the table as "slow indicators are bad". That is the wrong conclusion. Delay is a cost only when you use the indicator to time an entry or exit. For a different job, it is the feature you wanted.
A 200-bar average at 99.5 bars of delay is a poor trigger and a good regime filter. You are asking a slow question ("is the market above or below its long-run level?") and you want a slow answer that doesn't flip on every swing. A 20-bar EMA at 9.5 bars is a poor regime filter on a noisy chart and a more reasonable timing aid. Mixing up the two uses is the mistake. A trader who reads a long-length average as a trigger buys late and sells late and blames the indicator. The indicator did exactly what its arithmetic said.
So before you add any indicator, write down the job in one line: filter or trigger. Then compare the delay to the job. A filter can afford 50 bars. A trigger usually can't.
What this means for choosing settings
Here is the practical consequence. Suppose the setup you are trading has an edge that fades within a certain number of bars after the event. An opening-range break that works for ten bars, say, and then mean-reverts. If the indicator you use to detect the setup has an average delay longer than that, no threshold on it can capture the edge. By the time the reading crosses your level, the move you wanted has been priced in. Tuning the threshold only changes which stale moment you act on.
The fix is a different indicator or a shorter setting, not a different threshold. That is a statement about arithmetic, not about profit: it says what the indicator can see, not what the setup pays.
We are not claiming a measured link between implied delay and returns. That would take a study we have not run. The nearest thing Quantzee has published on how settings change outcomes is the SuperTrend backtest results, where the ATR period and multiplier are swept and the outcomes compared. Read it as an example of settings mattering, not as proof of the delay argument. For another place where hidden smoothing changes what you see, see Heikin Ashi's hidden lag, and the ATR glossary entry for the volatility side.
How to compute the delay for your own settings
You can do this in under a minute for any smoother.
- Find the smoothing factor. For an SMA it is 1/N for N bars. For an EMA use 2/(N+1). For Wilder smoothing use 1/N.
- For an SMA, the average age is (N-1)/2. For an exponential smoother with factor a, it is (1-a)/a.
- If indicators are chained, add the delays of each stage.
- Compare the total with how many bars your setup stays valid, and with the job (filter or trigger) the indicator is doing.
This is analytical software territory, not advice: the numbers describe an indicator's construction and say nothing about future prices or about any trade. Quantzee builds charting indicators, and this is a way to ask a better question of an indicator, not a way to make one profitable.
Frequently Asked Questions
Further reading on the arithmetic of smoothing: single exponential smoothing at NIST.