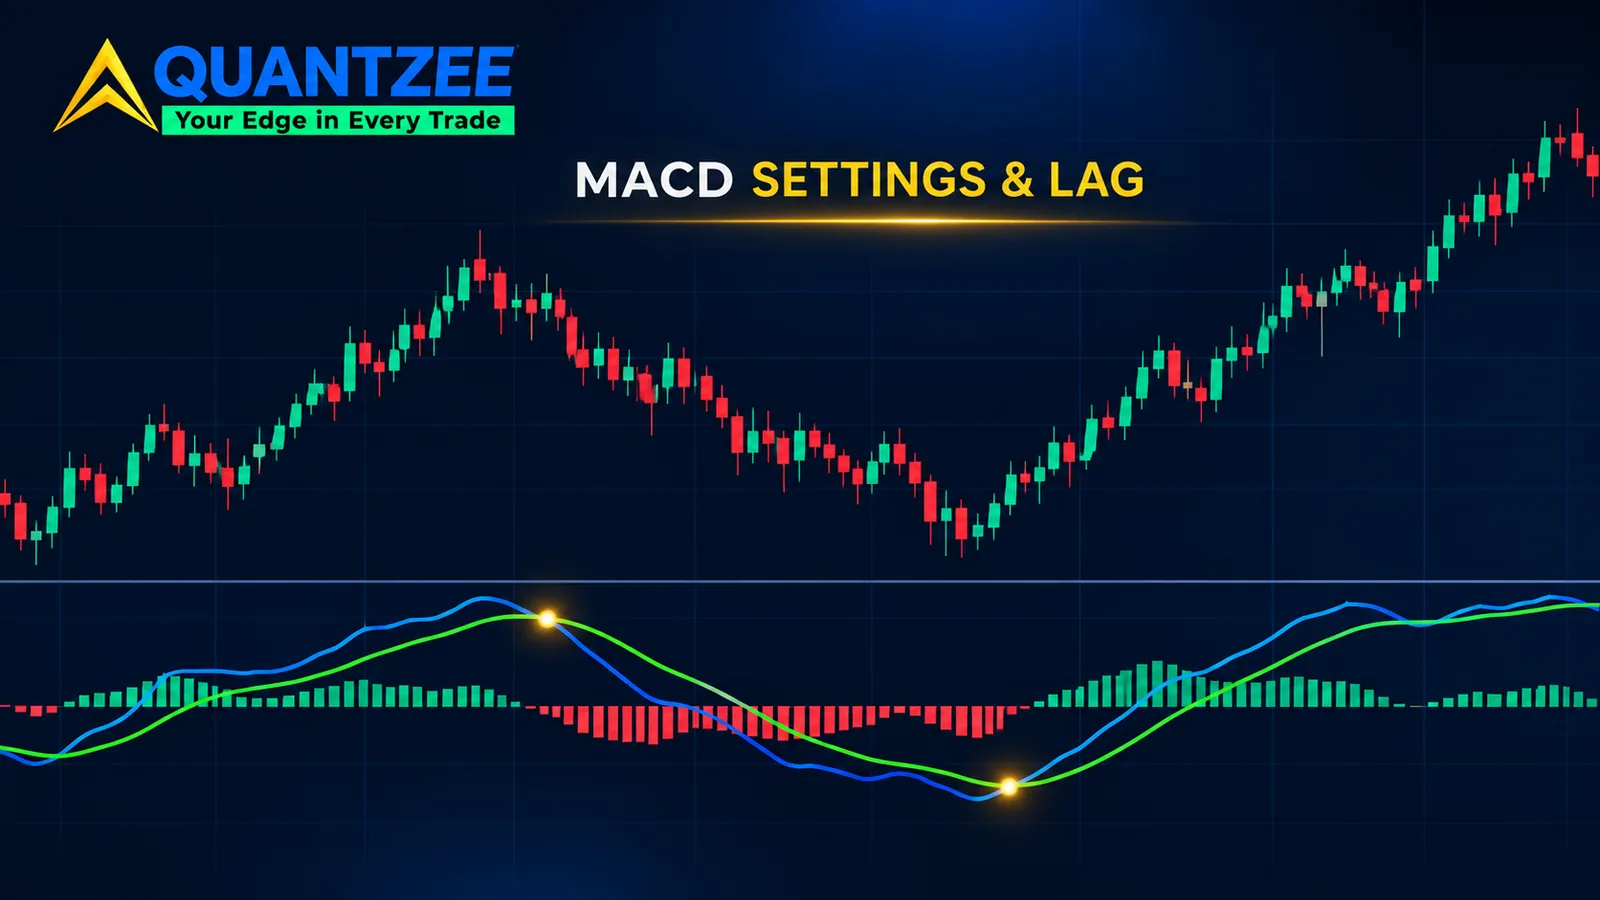
The MACD indicator is two exponential moving averages subtracted from each other, then smoothed once more. That's the whole machine. Every guide on page one tells you MACD lags. Not one of them tells you by how much, and that number is the only thing that should decide which settings you use. This guide works it out from the formula, in bars, for the 12/26/9 default and for faster and slower sets, so you can price any settings on any timeframe yourself.
Last updated: 14 November 2026. Every figure below is arithmetic or a measurement on a synthetic price path we built for this post. None of it is a backtest on real market data, and Quantzee publishes no win rate for any MACD signal.
MACD explained: three lines, one formula
Gerald Appel introduced the moving average convergence divergence in the late 1970s, and the 1979 formulation is still the one every platform ships. According to the standard reference entry on MACD, the construction is the one you'll find below. If you only need the short definition, our MACD glossary entry covers it in a minute. This post goes past the definition into what the numbers cost you.
- MACD line = EMA(close, 12) − EMA(close, 26)
- Signal line = EMA(MACD line, 9)
- Histogram = MACD line − signal line
An exponential moving average puts the most weight on the newest bar and lets older bars fade geometrically. The weight on the newest bar is the smoothing factor α = 2 / (N + 1). For a 12-period EMA that's 2/13, or about 15.4%. For a 26-period EMA it's 2/27, about 7.4%. For the 9-period signal line it's 2/10, exactly 20%. If moving averages themselves are fuzzy, start with our moving averages explainer and come back.
Read the histogram as the gap between the two lines. When it's positive and growing, the MACD line is pulling away above its own average. When it shrinks, the gap is closing, even if both lines are still rising.
How much does MACD lag? The centre-of-mass formula
Here's the part the ranking pages skip. Every moving average has a centre of mass: the average age, in bars, of the data it's built from. For an EMA you can derive it exactly. The weight on a bar k bars old is α(1 − α)^k, and the weighted average of k works out to:
EMA lag (centre of mass) = (1 − α) / α = (N − 1) / 2 bars
Engineers use the same weighting in quality control. Per the NIST engineering statistics handbook on EWMA charts, it is described with a weighting parameter λ that plays the role of α here. Same maths, different job.
Plug in the default lengths and you get three lag figures:
- EMA 12: (12 − 1) / 2 = 5.5 bars
- EMA 26: (26 − 1) / 2 = 12.5 bars
- Signal EMA 9: (9 − 1) / 2 = 4 bars, stacked on top of whatever lag the MACD line already carries
That gap of 12.5 − 5.5 = 7 bars is what the MACD line actually measures. In a steady trend that rises by s points per bar, the fast EMA trails price by 5.5s and the slow EMA by 12.5s, so the MACD line settles at 7s. Put differently, the MACD line is a smoothed slope, scaled by 7. We built a synthetic series rising exactly 1 point per bar and the 12/26 MACD line settled at 7.00, as the formula says it should.
So when someone says "MACD is a trend indicator", it's more precise to say it's a momentum indicator: it reports how fast price is moving, not where it is. That's also why it can turn before price on a smooth, rounded top. More on that below.
MACD settings compared: 12/26/9 vs 8/21/5 vs slower sets
Settings debates usually happen without numbers. Here are the numbers. We compared four settings with the same formula, then measured each on two synthetic price shapes. Test setup: a sharp V-top (price rises 1 point per bar for 200 bars, then falls 1 point per bar) and a smooth sine-wave cycle 40 bars long. No noise, no real data. The point is to isolate the delay the settings themselves build in.
| Settings | Fast EMA lag | Slow EMA lag | Signal lag | Steady MACD per 1 pt/bar trend | Zero-line cross after a V-top | Signal cross after a 40-bar cycle peak |
|---|---|---|---|---|---|---|
| 8 / 21 / 5 | 3.5 bars | 10 bars | 2 bars | 6.5 | 12 bars | 2 bars |
| 12 / 26 / 9 (default) | 5.5 bars | 12.5 bars | 4 bars | 7.0 | 15 bars | 6 bars |
| 19 / 39 / 9 | 9 bars | 19 bars | 4 bars | 10.0 | 24 bars | 8 bars |
| 24 / 52 / 18 | 11.5 bars | 25.5 bars | 8.5 bars | 14.0 | 31 bars | 11 bars |
Read the zero-line column carefully. On a sharp reversal, the default MACD line doesn't cross below zero until 15 bars after the top. Price has already given back 15 bars' worth of move by then. Going to 8/21/5 saves you 3 bars. Doubling everything to 24/52/18 costs you 16 more.
What you buy with slower settings is fewer crossings. A longer EMA averages over more bars, so short wiggles barely move it, and the MACD line crosses its signal line less often in choppy conditions. What you pay is a later read on every real turn. There's no setting that gets both. The trade is a straight line between responsiveness and noise, and you choose where to sit on it.
The 8/21/5 set gets a lot of attention online as a "faster" default. The arithmetic agrees it's faster, by 2 bars on the fast EMA and 2.5 on the slow one. It also means a 5-bar signal line, which is twitchy enough that the histogram will flip back and forth inside an ordinary pullback.
Same bars, different clocks: why settings arguments are timeframe arguments
A bar count means nothing until you attach a clock to it. The default's 15-bar zero-line delay on a V-top is:
- 75 minutes on a 5-minute chart
- 15 hours on a 1-hour chart, a bit more than 2 full US stock sessions of 6.5 hours
- 15 trading days on a daily chart, three trading weeks
- 15 weeks on a weekly chart, nearly 4 months
Two traders can argue for a year about 12/26/9 versus 8/21/5 and both be right, because one trades 5-minute bars and the other trades weekly bars. The setting that's "too slow" on a weekly chart can be perfectly usable on a 15-minute chart for the same person's holding period.
The practical rule: decide how many minutes, hours or days of delay you can tolerate on your holding period, divide by your bar length, and pick the setting whose lag fits. If you hold trades for about two days on hourly bars, a 15-hour delay eats most of your trade. That's a mismatch no amount of indicator tuning fixes; it's a timeframe problem. Our guide to day trading indicators walks through matching tools to holding periods.
How to set up MACD on TradingView
On a TradingView chart, open the Indicators menu (the forward-slash key also opens it), type MACD, and pick the built-in "MACD" entry. It loads in its own pane under the price chart with 12/26/9 already set.
Click the gear icon on the indicator's label to open Settings. The Inputs tab holds what matters:
- Fast Length (default 12) sets the fast EMA. Lower it and the MACD line reacts sooner and wiggles more.
- Slow Length (default 26) sets the slow EMA. Raise it and the gap between the EMAs gets wider, so the MACD line swings further for the same price move.
- Source (default close) is the price fed in. Switching to hl2 or hlc3 smooths the input a little and changes every value on the chart.
- Signal Smoothing (default 9) sets the signal EMA. This one controls how many crossovers you'll see more than any other input.
- Oscillator MA Type and Signal Line MA Type let you swap EMA for a simple moving average. An SMA of length N has the same (N − 1) / 2 centre of mass, but it drops old bars off a cliff instead of fading them, so it jumps when a big bar leaves the window.
The Style tab only changes colours and the four histogram shades. Leave it alone unless the defaults hurt your eyes. One habit worth keeping: write your settings on the chart or in the indicator name, because a MACD at 8/21/5 looks identical to one at 12/26/9 until a signal fires at a different bar.
Signal-line crossover vs zero-line crossover: two events, two delays
Most guides list these side by side as if they were interchangeable. They aren't. They measure different things and arrive at different times.
A signal-line crossover fires when the MACD line crosses its own 9-period average. That's a change in the direction of momentum: the smoothed slope stopped speeding up and started slowing down. On a smooth 40-bar cycle we measured the default's bearish signal cross 6 bars after the price peak. On a 100-bar cycle it actually fired 4 bars before the price peak, because momentum fades before price tops on a rounded turn.
A zero-line crossover fires when the MACD line itself crosses zero, meaning the fast EMA has crossed the slow EMA. That's a change in the sign of momentum: the smoothed slope is now pointing down. On the same 100-bar cycle the default's zero cross came 17 bars after the peak. On the V-top, 15 bars.
So the signal-line cross is the early, noisy read and the zero-line cross is the late, cleaner one. A strategy that enters on the first and exits on the second is mixing a fast clock with a slow one, and that's worth knowing before you test it.
MACD trading strategy: what the bare crossover can and can't do
The classic MACD trading strategy is the crossover: go long when the MACD line crosses above the signal line, exit or reverse when it crosses below. Here is the mechanism problem with using it alone. The signal line is built from the MACD line, so the crossover is the MACD line crossing a 4-bar-lagged copy of itself. In a range, momentum flips sign every few bars, and the crossover flips with it. Each flip costs a spread and a commission. Nothing in the formula knows whether the market is trending or chopping.
That's why the filters that get discussed most all try to answer one question first: is there a trend worth trading?
- Trade only in the direction of the zero line. Take bullish signal crosses only while the MACD line is above zero. You give up early entries and drop the crosses that happen against the larger move.
- Add a trend-strength gate. ADX is the usual choice, and it measures something MACD doesn't. Our piece on why ADX and DMI are not the same tool explains which part of that indicator does the gating.
- Use a higher-timeframe bias. Read MACD on a chart 4 to 6 times slower than your trading chart and only take entries that agree with it.
Be careful stacking more momentum tools on top. RSI, stochastics and MACD all come from recent price changes, so three of them agreeing is often one opinion counted three times. We wrote about that trap in confluence or correlation.
On backtest results: we haven't published a MACD backtest, so this guide gives you mechanism and arithmetic, not a win rate. If you want a number for your own instrument, run this on at least 5 years of data: the bare crossover, then the same rules with a zero-line filter, then with an ADX filter. Include real costs per trade. Compare the number of trades, the average result per trade after costs, and the worst drawdown. If the filtered version doesn't beat the bare one after costs, the filter isn't helping on that market.
MACD divergence: later than it looks on the chart
Bearish divergence is price making a higher high while the MACD line or histogram makes a lower high. On a finished chart it looks like an early warning. In real time it isn't quite that early.
You can't know the second swing high is a swing high until price has dropped away from it. If your pivot rule needs 5 bars on each side, the divergence becomes confirmable 5 bars after the high, at the soonest. Add the MACD line's own delay and the "early warning" frequently arrives after a decent slice of the drop. Divergence can also keep building: price makes a third and fourth higher high while momentum keeps fading, and each one would have been a losing short.
Treat divergence as a note that momentum is weakening, not as a timing tool. It tells you the trend is spending more effort for less distance. It doesn't tell you when that stops.
Does MACD repaint?
Short answer: no, not after a bar closes. The value on a closed bar is computed from closes that can't change any more, so it's fixed. While a bar is still forming, though, the MACD value moves with every tick, because the current close is the live price. A crossover can appear mid-bar and disappear by the close. If your alert fires on "once per bar" instead of "once per bar close", that's the repaint people think they're seeing.
Two other sources of shifting values are worth knowing. First, the EMA has to start somewhere. On TradingView the first values depend on how much history the chart loaded. The starting value's weight decays by (1 − α) each bar, so for the 26 EMA it's (25/27)^100 ≈ 0.05% after 100 bars. Ignore the first 100 or so bars and the values match anywhere. Second, if you pull MACD from a higher timeframe with a security call that doesn't wait for the higher bar to close, the higher-timeframe value can change for hours of lower-timeframe bars. That's a real repaint, and it's a coding choice, not a MACD property.
In our experience, most "MACD repaints" complaints trace back to intrabar alerts. Set alerts to fire on bar close and the problem goes away.
Where MACD Pro+ fits
Our team built MACD Pro+ around the problems above. It keeps the classic MACD calculation and grades each reading Strong or Weak using an adaptive chop zone, offers a normalized mode so the scale reads the same across instruments, splits the histogram into 4 phases, and adds a divergence engine. It doesn't remove the lag, because no MACD can; the lag comes from the formula. What it adds is context about whether a given signal is happening in a trend or in chop. It's analytical software, not trading advice.