The true strength index indicator is momentum that has been smoothed twice and then divided by the same double smoothing applied to the size of each move. That division is the clever part. The two smoothings are the expensive part. Most pages on this indicator list five signals and the 25/13/7 defaults, and none of them puts a number on what the double smoothing costs in bars. This one does, and it shows the arithmetic so you can reproduce it in a spreadsheet.
Short version for people who already run MACD: the TSI is a close relative of it. Adding the TSI buys you a bounded, comparable scale. It doesn't buy a second, independent timing signal. Whether that's worth a pane on your chart depends on the job, and we'll get to the job at the end.
What the True Strength Index Indicator Calculates
William Blau introduced the idea in an early-1990s article in Technical Analysis of Stocks & Commodities and expanded it in his 1995 book on momentum, direction and divergence. Everything below about the formula follows from that definition. Nothing here claims more than the definition supports.
The calculation runs in three stages.
- Momentum. Take today's close minus yesterday's close. Call that m. Keep a second series with the absolute value, |m|.
- Double smoothing. Run an exponential moving average (EMA) with the long length (25 by default) over m. Run an EMA with the short length (13 by default) over that result. Do exactly the same to |m|.
- The ratio. TSI = 100 × (double-smoothed m) ÷ (double-smoothed |m|). A signal line, usually a 7-period EMA of the TSI, sits on top.
Per the NIST engineering statistics handbook, an exponential smoothing weight is 2 ÷ (N + 1) for an EMA of length N, which is the form used here: 2/26 for the 25-bar EMA and 2/14 for the 13-bar one.
A Ten-Close Worked Example You Can Check by Hand
Methodology: we built the table below in a spreadsheet-style calculation from ten made-up closes. The prices are illustrative, not market data, and the table is there so you can check your own implementation, nothing more. Each EMA is seeded with its first value, which is the common shortcut when a series has just begun. Nine momentum readings come out of ten closes.
| Bar | Close | m | |m| | EMA25(m) | EMA13 of that | EMA25(|m|) | EMA13 of that | TSI |
|---|---|---|---|---|---|---|---|---|
| 1 | 101.20 | 1.2 | 1.2 | 1.2000 | 1.2000 | 1.2000 | 1.2000 | 100.0 |
| 2 | 100.60 | -0.6 | 0.6 | 1.0615 | 1.1802 | 1.1538 | 1.1934 | 98.9 |
| 3 | 102.40 | 1.8 | 1.8 | 1.1183 | 1.1714 | 1.2036 | 1.1949 | 98.0 |
| 4 | 103.10 | 0.7 | 0.7 | 1.0862 | 1.1592 | 1.1648 | 1.1906 | 97.4 |
| 5 | 102.30 | -0.8 | 0.8 | 0.9411 | 1.1280 | 1.1368 | 1.1829 | 95.4 |
| 6 | 104.00 | 1.7 | 1.7 | 0.9995 | 1.1097 | 1.1801 | 1.1825 | 93.8 |
| 7 | 105.20 | 1.2 | 1.2 | 1.0149 | 1.0961 | 1.1816 | 1.1824 | 92.7 |
| 8 | 104.50 | -0.7 | 0.7 | 0.8830 | 1.0657 | 1.1446 | 1.1770 | 90.5 |
| 9 | 106.30 | 1.8 | 1.8 | 0.9535 | 1.0497 | 1.1950 | 1.1795 | 89.0 |
The close of bar zero, not shown, was 100.00. Two things stand out. First, the TSI starts at exactly 100 on bar 1, because with one observation the smoothed momentum and the smoothed absolute momentum are the same number. That's a seeding artefact, and it fades slowly: nine bars in, the reading is still 89 on a series that went up in six of nine bars and down in three. We found that a slow EMA needs far more than ten bars before the seed stops mattering, so any TSI reading in the first couple of hundred bars of a chart deserves suspicion.
Second, look at the last column. It never leaves the 89 to 100 range even though three of the nine bars were down. The directional share of movement is high, and the long smoothing hides the dips. Holding that thought, because it leads straight into the lag.
Why the Divisor Is the Whole Point
Strip the denominator away and the numerator is the smoothed momentum, which is in price units. A momentum reading of 0.9 means something on a twenty-dollar equity and almost nothing on a currency pair quoted near 1.08. You can't line the two up.
The denominator fixes that. The ratio is the share of recent movement that was directional. If every bar in the window closed higher by the same amount, the numerator and denominator are identical and the TSI is +100. If up bars and down bars cancel, the numerator goes to zero while the denominator stays positive, so the TSI sits near zero. The output is bounded between −100 and +100 and unitless. A +40 on the equity and a +40 on the currency pair describe the same thing: about the same fraction of smoothed movement went one way.
MACD can't do that. It stays in price units, so a MACD of 0.3 is meaningless until you know the instrument and its recent range. For a deeper definition of what MACD measures, see the Quantzee MACD glossary entry. This scale-free property is the one thing the TSI does that a plain MACD line doesn't, and it's worth keeping the rest of the article honest against it.
The Lag, Stated as Arithmetic
Everyone calls this indicator "lagging". That's not a number. Here's one.
An EMA of length N has a phase lag of about (N − 1) ÷ 2 bars. That's the delay between a turn in the input and the same turn showing up in the output, for a steady trend. It follows from the weights in an exponential average, and the Wikipedia moving average article lays out the same weighting. Two EMAs in series add their lags.
- 25-bar EMA: (25 − 1) ÷ 2 = 12 bars
- 13-bar EMA: (13 − 1) ÷ 2 = 6 bars
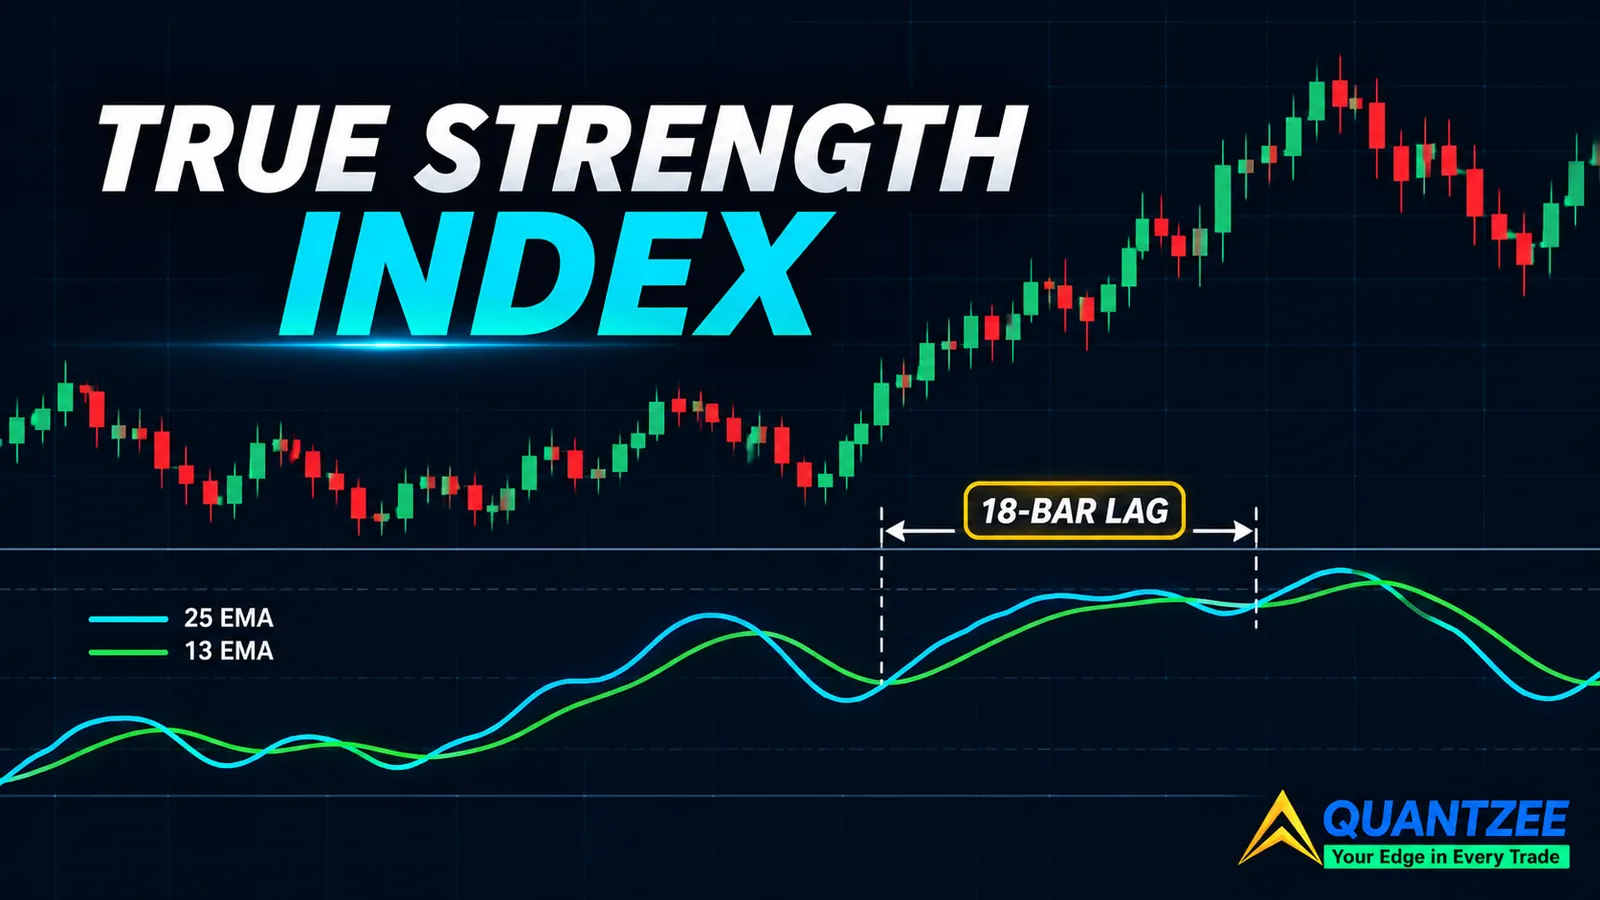
- Total on the stock defaults: about 18 bars
So the numerator of a default TSI is roughly eighteen bars late relative to raw momentum. On a daily chart that's most of a month. On a five-minute chart it's an hour and a half. Now ask yourself whether an eighteen-bar-old momentum reading helps your decision. For a swing trader holding for weeks, it can. For someone looking for a turn this afternoon, the oscillator has been telling them about the morning.
The shorter settings shift this predictably. A 13/7 configuration gives 6 + 3 = 9 bars. A 5/3 configuration gives 2 + 1 = 3 bars. You can compute the delay for any pair before you ever put it on a chart, which is more than most indicator pages let you do.
Shortening has a price too. When we ran the same ten closes through 5/3 smoothing, the TSI on bar 9 came out at 60.5 instead of 89, and it bounced between 54 and 82 across the nine bars where the 25/13 version only drifted between 89 and 100. Less lag means more noise, which means more crossings of whatever line you're watching. There's no free setting, only a trade between delay and false turns.
TSI Versus MACD: Same Family, Different Scale
This is the part the ranking pages avoid. MACD takes two EMAs of price, one fast and one slow, and subtracts them. The TSI takes the difference in price first and then smooths it in series. The two are not algebraically identical, and the smoothing kernels differ in shape. But both are smoothed momentum, both are built from EMA lengths in the same range, and both react to the same underlying price change. The MACD overview on Wikipedia shows the construction if you want to compare it line by line.
The practical consequence: their turning points land close together, and what you can actually see differently is the scale. Run both on one chart and you'll read the same story twice, with the TSI telling it on a bounded axis. We haven't run a measured crossing-count comparison between the two on a single instrument, so there is no hit rate or win rate in this article and you shouldn't infer one. The argument is structural: shared inputs, similar smoothing, similar timing.
If you already trade with the MACD, the Quantzee MACD Pro+ indicator covers that ground, and adding a TSI on top is closer to changing the units on a ruler than adding a second ruler. The same logic is in our piece on why three indicators often say one thing: tools built from the same input agree because they share a source, not because they independently confirm each other.
The Plus and Minus 25 Thresholds
Almost every guide to the true strength index indicator says to treat readings above +25 as strong upward momentum and below −25 as strong downward momentum. The numbers are asserted, rarely justified. Think about what a bounded ratio does.
The TSI's level depends on how directional the instrument has been over the smoothing window. In a clean trend, most smoothed movement is one-sided, so the ratio sits high for a long time, well past +25, and stays there. That isn't "overbought". It's the indicator describing a trend. In a range, up and down bars cancel and the ratio hovers near zero, often never reaching ±25 at all on slow settings.
So a fixed ±25 line behaves differently on two stretches of the same instrument. On a trending stretch it gets crossed once and then ignored for weeks. On a ranging stretch with short settings it gets crossed repeatedly by noise. A threshold that means "strong" in one regime and "random" in the other isn't a threshold in any useful sense. If you want to use a level, measure how often it was crossed on a trending and a ranging window of your own instrument first, and set it from that, not from the default text.
Signal-Line Crossovers Against Zero-Line Crossovers
The two crossover signals fire at different times, and the order matters.
The signal line is an EMA of the TSI itself, 7 bars by default, so about 3 more bars of lag on top. The TSI crosses its own signal line when it turns, which is when its slope changes. It crosses the zero line only when the double-smoothed momentum actually changes sign, which comes later. So in a reversal the signal-line cross shows up first and the zero-line cross confirms it after the move has already given up a good part of its run.
Which should you use? Each one is a function of the same series, one for the turn and one for the sign. They are two readings of one thing, in sequence. Waiting for the zero-line cross after a signal-line cross isn't independent confirmation. It's the same event, observed late. Treating both as "two signals agreeing" counts one signal twice. If you want a confirmation, take it from a different input, such as volume or volatility, and not from a second look at momentum.
The Divergence Limit
Divergence is the favourite TSI signal: price makes a lower low, the oscillator makes a higher low. The trouble is that a bounded, double-smoothed oscillator will print some kind of divergence on nearly every extended move. Smoothing flattens the oscillator's swings while price still wiggles, so pairs of lows that "disagree" are everywhere. A divergence count with no confirmation attached tells you almost nothing.
The fix is a deadline. Define, before you look, how many bars price has to follow through after the second oscillator low, and discard the setup if it doesn't. Five bars is a reasonable place to start examining, and the right number depends on your timeframe and on the lag you computed above. A divergence that needs eighteen bars of oscillator history to form, and then gets no follow-through within five bars of price action, is noise you've now labelled. Without the deadline, you will find a divergence after every move, because the arithmetic guarantees one.
Settings: What Changing 25/13/7 Actually Does
The 25/13/7 set comes from Blau's original work. There's nothing sacred about it, and you can reason about alternatives from the formula alone.
- 25/13/7: about 18 bars of numerator lag, a signal line 3 bars behind that. Few crossings, big delay.
- 13/7/4: about 9 bars of lag. More crossings, readings swing wider, and the first hundred bars are dominated less by the seed.
- 5/3/3: about 3 bars of lag. Close to raw momentum, and the "bounded and smooth" advantage mostly disappears.
Pick the lag you can live with first, then check the crossing frequency on your own history. Choosing the settings from a screenshot on a vendor blog gets it backwards.
Where the TSI Earns Its Place: Ranking, Not Timing
Given all of the above, the honest answer to "what is the true strength index indicator good for" is a comparison job. Because the ratio is bounded and unitless, it can rank a watchlist. Put thirty instruments, equities, a few currency pairs and an index, side by side, and the TSI lets you sort them by how one-sided their recent movement has been. RSI offers a bounded scale too, but it is built from average gains and losses in a different way; see the RSI glossary entry for how that differs. MACD can't be sorted across instruments at all without extra normalising.
That's a screening job. It isn't a timing job. As a timing tool, an eighteen-bar-late reading that mostly echoes MACD is a hard sell. As a way to sort a long list so you can look at the top and bottom of it, it does something your other momentum tools don't.
If you'd like a bounded oscillator built to run on the same −100 to +100 axis but blending in close position within the recent range and flow, the Adaptive AI Oscillation Engine is the Quantzee take on that idea. It's a different construction from the TSI, not a port of it, and it's analytical software, not a source of trading advice. If you try any of this on a chart, paper trade first.
How We Would Use It Without Fooling Ourselves
If you keep a TSI on a chart, a few habits keep it honest.
Print the lag for your settings and write it somewhere you'll see it. Treat any reading in the first few hundred bars of a chart as seed-polluted. Don't read ±25 as a promise. Don't count a signal-line cross and a zero-line cross as two votes. Put a bar-count deadline on divergence. And if the same turn is showing on a MACD already, remember you're looking at one view in two units, a point also made in our look at money flow indicators that look alike.
Past results of any indicator don't predict future results, and nothing in this article is a recommendation to buy or sell anything. The aim is to understand what the number on the screen is made of.