Educational content about testing methodology. It is analytical software commentary, not investment advice, and nothing here is a recommendation to buy or sell any currency pair. Leveraged forex carries a high risk of loss, and backtested results do not predict future results.
Forex backtesting looks like equities backtesting with different tickers. It isn't. Currency trading has no central exchange, no single closing bell and no consolidated volume, and a test that ignores those facts produces a number that a second person on a different feed cannot reproduce. That is the real failure of most FX backtests. It isn't that the equity curve is too pretty. It's that nobody else can get the same curve.
Two things are already well covered elsewhere, so this piece treats them briskly: spread is the cost, and it is not constant. The rest of the post is about four items that are structural to currency markets, not cost assumptions: the clock your daily candle rolls on, the venue-local volume column, the weekend where a stop does not exist, and the sample size needed before a win rate means anything. We'll also cover pip and lot arithmetic so your output is money rather than pips, and what each class of testing tool silently leaves out.
Key Takeaways
- Spread, not commission, is the main FX cost. Put it on its own line, and test against the worst spread seen for that hour on your feed, not the average.
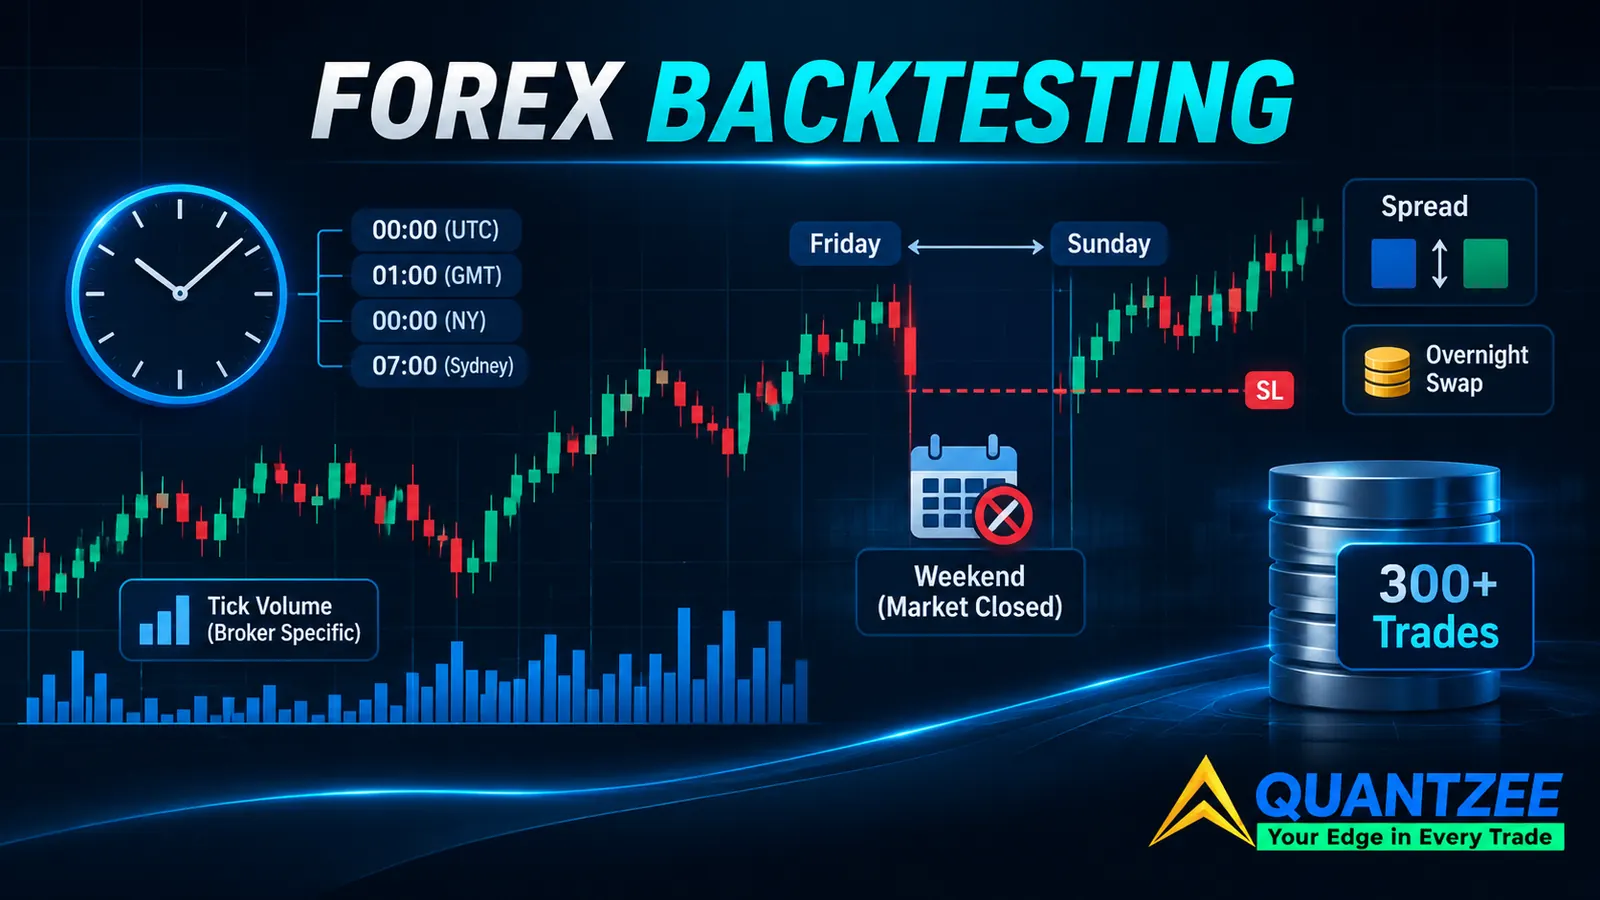
- There is no single FX session close. A daily candle on a New York-afternoon feed is a different candle from one on a midnight-UTC feed, so record the feed timezone next to every result.
- The volume column in spot FX is one broker's tick count. Any volume filter is being tested against a single venue.
- The market is shut from the Friday close to the Sunday reopen. A stop does not exist across that window, so model the gap.
- Thirty to fifty trades cannot tell a 45% win rate from a 60% one. Aim for several hundred.
Why forex backtesting is a different problem
According to the Bank for International Settlements Triennial Survey, over-the-counter FX turnover reached $7.5 trillion per day in April 2022. None of that trades on one exchange. It runs through dealers, ECNs and brokers, each with its own prices, its own spread and its own server clock. The data your backtester reads is therefore one venue's view of the market, never the market itself.
That has a plain consequence. In an equity test, "the close" is a fact, and every vendor reports about the same one. In an FX test, "the close" is a choice somebody made when they built the feed. Every item below follows from that.
If you want the general reasons backtests drift away from live results (repainting, look-ahead bias, overfitting), we cover them in why your backtest doesn't match live trading and won't re-argue them here. This post is only about what changes when the instrument is a currency pair.
Settled ground: spread is the cost, and it moves
Two method-led pages already handle the cost side of forex backtesting properly, so we'll credit them and keep this short. The core point is that retail FX is mostly priced through the spread. A commission line may exist on an ECN-style account, but the spread is what you cross on every entry and every exit.
Give it its own line in the test rather than burying it in the fill price. Here is the arithmetic, labelled illustrative. Assume a 1.2-pip spread on a major pair and a standard lot of 100,000 units, where one pip is worth about $10. The round trip costs about $12 per lot. If your strategy's average winner is 15 pips, the spread has already taken 1.2 of them, which is 8% of the gross edge on every winning trade. On a 5-pip scalp target, the same spread takes 24%.
The less obvious point is that the spread is not a constant. It widens into the daily rollover, at the Sunday reopen, and around scheduled data releases. A strategy that trades those windows looks better against an average spread than it will ever act in practice. So don't use the average. Test each entry against the worst spread observed for that hour on that feed. It's a harsher test, and it's the one that tells you whether the edge survives the moments you were actually filled. Our slippage glossary entry covers the general mechanics.
When we scored a 1,080-combination SuperTrend grid at zero cost and at an assumed real cost, as written up in that cost comparison, the gap between the two columns was the finding. That dataset covers BTC, gold and silver, not currency pairs, and its costs are stated assumptions rather than measured fills, so it is evidence about the principle and nothing more. Cost sensitivity is the same idea here: a thin edge disappears first.
Financing: the cost of holding through the roll
Spot FX positions settle two business days out. Brokers avoid physical delivery by rolling the position forward each day, and the price of that roll is the swap: you pay or earn the interest differential between the two currencies. Most brokers apply the roll at a fixed time in the New York late afternoon, around 5 p.m. Eastern.
Two details matter for a test. First, the swap can be a credit or a debit depending on the direction of the trade and the rate gap, and it changes as central banks change rates. A rate that applied in 2022 is not the rate that applies now. Second, one day a week the roll is charged at triple rate, usually Wednesday, because the value date jumps over the weekend. Three days of financing are booked in one night.
A strategy that holds overnight and ignores this is being tested against a different instrument from the one it will trade. For a day trader who is flat before the roll, financing is zero and the point is moot. For a swing system holding four days, the financing line can move the result by several pips per trade. Don't guess it. Your broker publishes a contract specification for each pair, with the swap rates and the roll time. Read that page for your account, record the rates and the date you read them, and apply them per night held. Rates differ by broker and change often, so we have not printed any here.
Item 1: which clock does the day roll on?
Stocks have one close. Spot FX does not, because it trades around the clock from the Sunday reopen to the Friday close. So a "daily" candle is whatever window the data vendor decided to cut. Some feeds roll the day at 5 p.m. New York time, which keeps each trading week to five daily bars. Others roll at midnight UTC. Some use the broker server's local time, which may sit at UTC+2 or UTC+3 and shift with daylight saving.
The consequence is easy to state and easy to miss. The same rules, on the same pair, over the same calendar dates, produce different daily results on different feeds. A daily high on the New York-roll feed can include a London-session spike that falls into the previous day on the midnight-UTC feed. An "inside day" on one feed is an outside day on the other. Any rule built on a daily open, daily close, prior-day high or daily pivot is affected, and so is any rule that counts candles from the daily open.
Daylight saving adds a second layer. A server clock that follows New York time shifts relative to UTC twice a year, and the US and Europe change on different dates. For a few weeks each spring and autumn, a "London open" filter set to a fixed server-clock hour sits an hour away from the real open. Intraday tests built on session hours should be defined in UTC or in a named exchange timezone, not in raw server time.
The fix is not complicated. It just has to be done:
- Write the feed's timezone and its daily roll time next to the result, as a column in the test record.
- If you compare two feeds, rebuild the daily bars from one common intraday series rather than trusting each vendor's own daily file.
- Define session filters in UTC and convert, so daylight saving cannot move your rule.
Without that record, a colleague who reruns your test on another platform gets a different answer and has no way to find out why. That is the practical meaning of "not reproducible". Our global forex indicator guide raises the same trap for daily pivots, where the server-day cutoff decides where the levels land.
Item 2: the volume column belongs to one venue
With no central exchange, no one publishes a consolidated volume figure for a currency pair. What a chart labels "volume" is almost always tick volume, the number of price updates one broker's feed produced in the bar. It correlates loosely with activity, which is why it isn't worthless. But it is a count of that broker's updates, and a different broker's feed produces a different count for the same minute.
For a backtest, the rule is simple. Any entry filter that reads volume (a volume spike, a volume-weighted average, a relative-volume threshold) is being tested against one venue only. Either declare the filter broker-specific, and say which broker, or drop it. A result built on "volume above its 20-bar average" cannot be transferred to another feed, and a live account on a different broker is, in effect, trading a different filter.
We covered the underlying problem in the volume section of our forex indicators guide, so this is a pointer rather than a rerun. If you take one rule from it: treat FX volume as a property of the feed, and record the feed.
Item 3: the weekend, where a stop does not exist
The FX market closes on Friday afternoon, New York time, and reopens on Sunday evening. In between, no orders fill. A stop-loss placed on a pair does not sit in the market over those hours. It sits with your broker, and it can only execute at the first available price after the reopen.
Most backtest engines don't model this. They look at each bar, see that the low crossed the stop level, and fill at the stop. On Monday's first bar that is wrong whenever price opened beyond the stop. The honest fill is the open of that first bar, not the stop level.
Take an illustrative case with assumed numbers. A long position on a major pair has a 30-pip stop. Over the weekend, a geopolitical headline moves the Sunday reopen 80 pips against the position. The engine that fills at the stop records a 30-pip loss. The account records an 80-pip loss, about 2.7 times what the test said. At 10 standard lots, with a pip worth about $10 per lot, that's $8,000 against the $3,000 the backtest booked.
Weekend gaps in liquid majors are usually small, and many weeks have none worth the name. That is exactly why the test needs them modelled: rare, large and one-directional. A strategy that holds from Friday to Monday should have each gap at the reopen priced at the actual first bar open. Holiday closures do the same thing on a smaller scale. Pull the actual gap series from your own data before deciding how much it matters to your system.
If your strategy is flat before Friday's close every week, the weekend item drops out, and that is itself a design choice worth recording in the test.
Pip and lot arithmetic: get to money, not pips
A pip is the standard fourth-decimal move on most pairs and the second decimal on yen-quoted pairs. The value of a pip in your account currency depends on the quote currency, not on a universal figure.
- Quote currency is USD (EUR/USD, GBP/USD): one pip on a 100,000-unit lot is 100,000 x 0.0001 = $10.
- Quote currency is JPY (USD/JPY): one pip is 0.01 yen, so 100,000 x 0.01 = 1,000 yen. At a rate of 150 yen per dollar that is about $6.67.
- Quote currency is neither (EUR/GBP): the pip is paid in pounds and converts at the current GBP/USD rate, so the dollar value moves with another pair.
A flat "$10 a pip" assumption breaks on yen crosses and on any pair that doesn't quote in your account currency. The error is about 33% on USD/JPY at 150, which can rank a yen strategy above a dollar one on pips alone, then reverse the order once both are measured in money. So run the test in pips, but convert each trade to account currency at the rate prevailing when it closed, and report the result in money.
Position size matters here too. A fixed-pip stop with a fixed-lot size means the risk per trade in money changes whenever the pair's pip value changes. If your rule says "risk 1% per trade", compute the lot size from the stop distance and the pip value at entry, not from a constant.
Item 4: sample size, said plainly
One competitor FAQ recommends thirty to fifty historical trades for a backtest. That is far too few to read a win rate from, and the arithmetic shows why. The 95% margin of error on an observed win rate is roughly 1.96 x the square root of p(1-p)/n.
- 40 trades, observed 50% win rate: margin about +/- 15.5 points. The true rate could be anywhere from 34% to 66%.
- 100 trades: about +/- 9.8 points, so 40% to 60%.
- 400 trades: about +/- 4.9 points, so 45% to 55%.
- 1,000 trades: about +/- 3.1 points.
So a sample of forty trades cannot tell a 45% strategy from a 60% one. It cannot tell a winning system from a coin flip. Win rate is also only half the story: average win and average loss carry just as much uncertainty, and the expectancy combines both.
A usable target is 300 or more trades, and more if the strategy's edge is small. If the system trades once a week, that is about six years of data, which is the honest answer to "how much history do I need?" When the trade count is below that, say so in the result and call it a pilot, not a finding. Better to publish "112 trades, margin about +/- 9 points" than a bare percentage. We went through the cost-and-sample side of this in how to backtest a TradingView indicator, and the backtesting glossary entry defines the basic terms.
What each class of tool models, and what it leaves out
We aren't ranking platforms here. Rankings go stale, and the useful question is which of the points above each class of tool handles. This is a description of how the categories generally work. Check your own tool's documentation, because versions differ.
| Tool class | Usually handles | Commonly leaves out |
|---|---|---|
| Broker-native strategy testers | Your broker's own history and spread, often tick-level | Other feeds' clocks. Variable spread is often replaced by one fixed value. Swap handling varies. |
| Browser charting testers | Fast iteration on candle data, bar-close logic | Weekend gap fills at the stop level, venue-specific volume, spread as a separate line unless you add it by hand |
| Manual replay journals | Discretionary practice, real-time feel | Sample size, because sessions are slow. Cost assumptions depend on the tester, and results are hard to reproduce |
| Code frameworks | Whatever you write, including custom spread, swap and gap logic | Nothing by design, but every omission is yours: default fills, bar timezone and slippage settings are easy to leave as defaults |
The pattern is the same across all four. Spread is usually the easiest item to add. The four structural items (clock, volume, weekend, sample size) are the ones a default setting won't give you. Our piece on the five assumptions behind backtesting software covers the general version of this audit, and a currency test needs the four items here on top of it.
A reproducibility checklist for an FX backtest
Before you trust a number, check that each of these is written down next to it:
- Data source, pair, date range, and the feed's timezone and daily roll time.
- Spread assumption, and whether it is fixed, hourly worst-case or measured.
- Swap rates applied, the date you read them, and the nights counted.
- Whether volume is used, and if so, that it is broker-specific tick volume.
- How weekend and holiday gaps are filled: at the stop, or at the reopen price.
- Pip value conversion and position-size rule.
- Trade count, with the margin of error beside the win rate.
This is the methodology section that should accompany any result, and it is the standard we hold Quantzee's own backtest write-ups to. A test that carries all seven lines can be rerun by someone else. A test that carries none is a screenshot.
If you are choosing indicators to put through a test like this, start with our guide to forex indicators for global traders, then run each candidate through the checklist above before it earns a place on a chart. Regulators also publish plain-language material on leveraged currency trading, for example NFA's forex resources, which is worth reading before any live account.