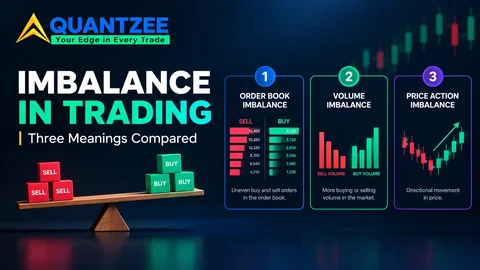
What is imbalances? Depends who's drawing it. On a plain candlestick chart, an imbalance is a stretch of price the market crossed without trading both ways. On a footprint chart, it's a lopsided ratio of buyers to sellers at neighbouring prices. In an exchange notice, it's a published count of buy or sell orders waiting for an auction. Same word, three measurements, three kinds of data.
Most people hit this wall the same way. They watch a course that says "price always returns to the imbalance," then open a footprint tool whose imbalance is a coloured cell, then read a market-data page about closing-auction imbalance. Nothing lines up, and nobody says why. This guide is the triage we wish we'd had: a two-minute way to work out which meaning is on your screen, a plain definition of each, and a decoder table for the neighbouring vocabulary. If you only want the side-by-side comparison of the three, our three meanings compared piece covers that ground. This one is for the moment before that, when you're staring at a chart and need to know what the word is pointing at.
Start with the data you actually have
Before any definition, ask what your screen is built from. The answer decides which imbalance you can possibly be looking at.
Four kinds of display, four kinds of imbalance:
- Candles only. Open, high, low, close per bar. The only imbalance you can measure is a price one.
- Footprint or cluster bars. Each bar is split into bid and ask volume at every price. A volume-ratio imbalance becomes possible.
- Depth of market (the order book ladder). You see resting orders that haven't traded yet. A mismatch between the two sides of the book is the imbalance here.
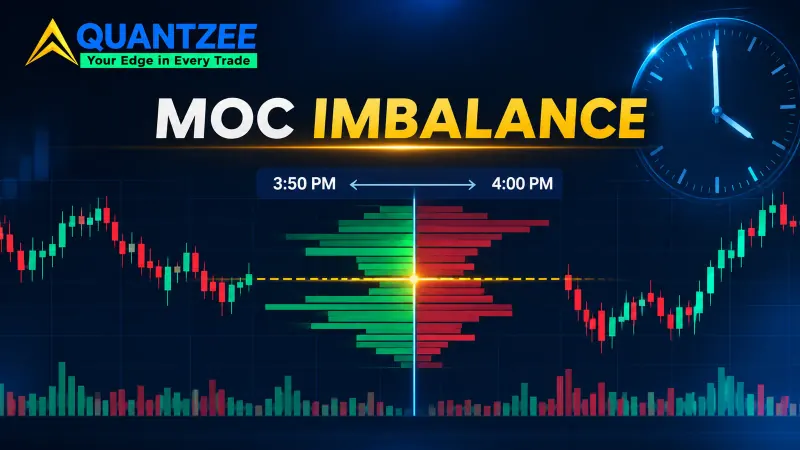
- Exchange auction notices. Published ahead of an opening or closing cross. A real count of matched versus unmatched orders.
None of these substitutes for another. A candle chart can't show you bid-ask skew, however clever the indicator. A footprint can't show you resting orders. And an auction notice says nothing about the middle of the session. So when someone says "the imbalance," the first useful question isn't "is it bullish?" It's "measured from what?"
Sense one: price imbalance, the one most courses mean
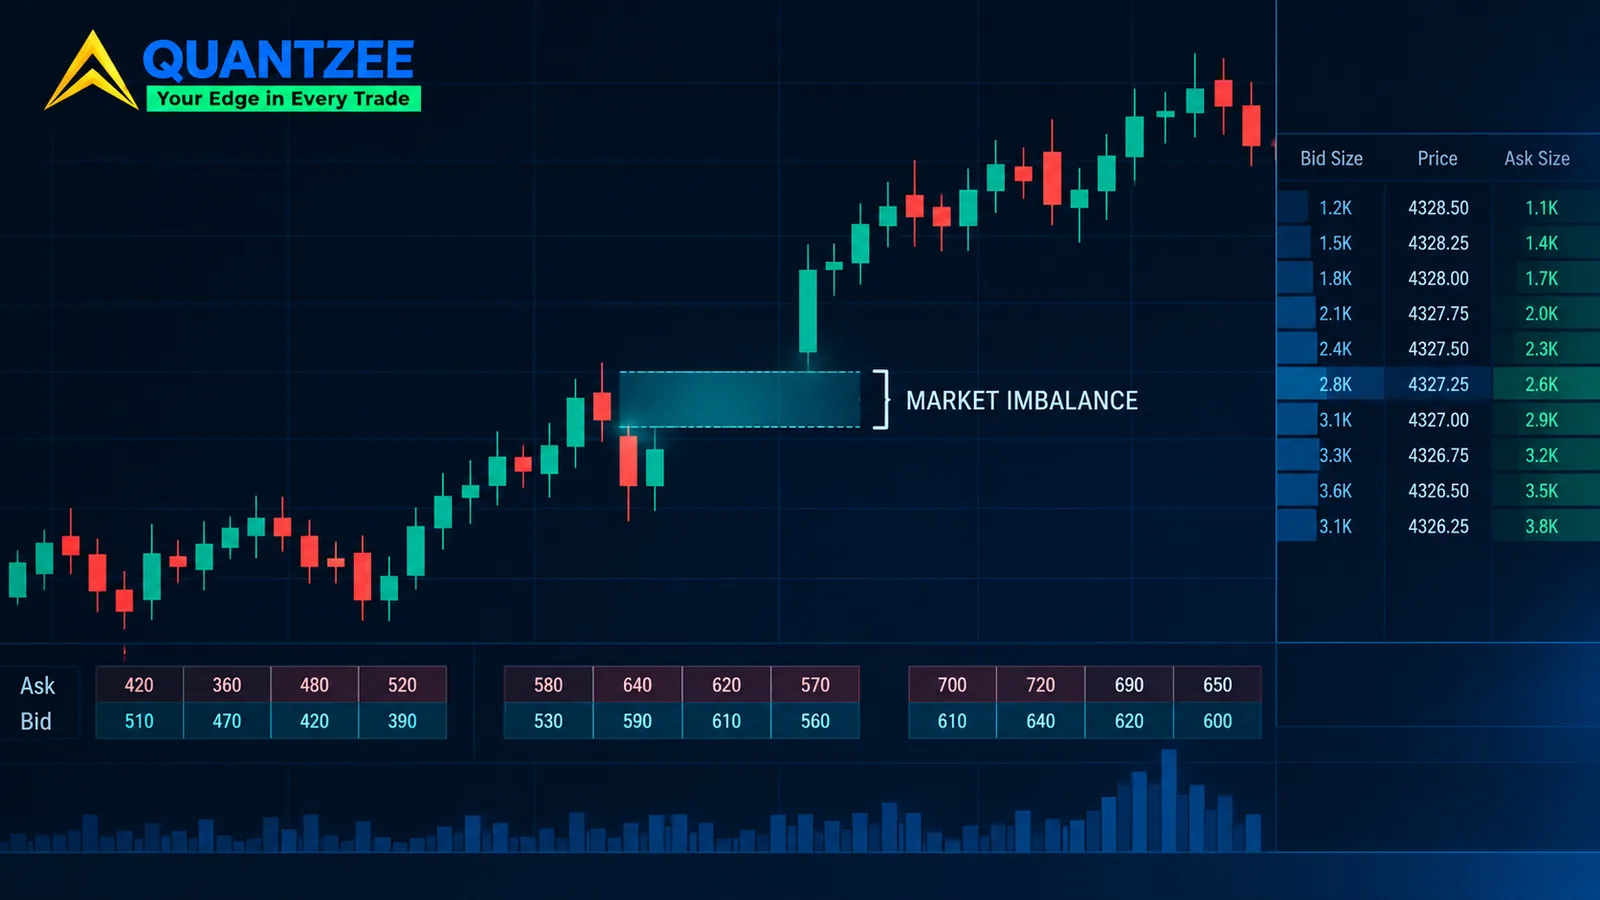
Take three consecutive candles. If the wick of the first and the wick of the third don't overlap, and the middle candle ran through the space between them, that space is a price imbalance. On the way up, candle one's high sits below candle three's low. On the way down, it's mirrored. Fair value gap, or FVG, is the usual smart-money name for exactly this shape.
What it measures is narrow and honest: a range where price moved through without trading back and forth. It doesn't tell you who was aggressive. It doesn't tell you volume was lopsided. It tells you the candles didn't overlap. Everything else, including the idea that the market "wants" to come back, is an interpretation laid on top.
That interpretation can be put to a test, and we did. We marked a sample of 500 gaps across ES futures, BTC/USDT and EURUSD on the 15-minute chart, using the strict three-candle rule, and tracked each for up to 20 sessions. A gap counted as filled the moment price traded into any part of it, even by a single tick. According to our data, the any-touch fill rate was 84% on ES, 76% on BTC/USDT and 88% on EURUSD, with full fills at 61%, 52% and 67%. Fill rates also moved with size: gaps under 0.3× ATR filled on any touch 91% of the time, while gaps over 0.7× ATR did so 68% of the time. The full write-up, with the method and every table, is in the 500-gap fill-rate study.
Two cautions travel with those numbers. First, they're a structural census, not a win rate. A gap that fills tells you price came back. It says nothing about whether trading it would have made money. Second, they belong to the price sense alone. Change the fill rule from "any touch" to "full close," or stretch the window from 20 sessions to forever, and the headline moves by double digits. A percentage with no stated fill rule and no tracking window isn't a number you can use.
Sense two: footprint imbalance, a ratio you set yourself
Switch to a footprint chart and the word changes meaning. Each price level in a bar carries two counts: contracts traded at the ask (buyers lifting) and contracts traded at the bid (sellers hitting). A footprint imbalance compares one level's ask volume against the bid volume one level below, diagonally, and flags the cell when the ratio crosses a threshold. A ratio of 3:1 is a common default. Some people run 2:1, some 4:1 or higher.
Why diagonal? Because at any instant the bid and the ask sit one tick apart, so comparing across that step is how you tell whether buyers were pushing through while sellers at the lower price barely showed up. The mechanics are covered in our footprint chart guide, and the broader category it belongs to is in the order flow glossary entry.
The part beginners miss: the threshold is a setting, not a fact. There isn't a ratio at which an imbalance becomes real. A 3:1 flag on a thin overnight bar and a 3:1 flag in the first minutes of a busy session describe very different amounts of money. We found that the same chart can look nearly empty at 5:1 and covered in flags at 2:1, with identical underlying trades. Treat the colour as a filter you chose, not as a finding the software made.
Data matters here too. A footprint needs trades tagged with which side was aggressive. Exchange-traded futures and listed stocks tend to supply that cleanly. Spot forex has no single tape, and crypto splits across venues, so a footprint on one exchange reflects only that exchange's flow.
Sense three: auction order imbalance, the only actual count
Exchanges that run opening and closing auctions publish how many orders are waiting on each side before the cross happens. If more shares are offered to buy than to sell at the indicative price, that's a buy-side imbalance, and the figure is stated in shares. The NYSE explains what it publishes and when on its trading information page. Timing differs by venue and by session, so read the venue's own documentation instead of trusting a summary, including this one.
It's worth noticing how different this is. Senses one and two are inferences from trades that already happened. The auction number is a count of orders still queued. That's why it's the only one of the three that deserves the word "actual." It's also why it's the narrowest: it appears only around a cross, only on venues that run one, and it says nothing about what happens at 11:20 on a quiet Tuesday. Reading it as a trade signal is a separate skill we won't pretend to teach here. For background on how order books and matching work, the SEC's investor glossary entry on the order book is a clean primer, and FINRA's investor education on stocks covers how orders reach the market.
A fourth thing people call imbalance: the order book mismatch
Depth-of-market users often mean something else again. If the ladder shows 4,000 contracts resting on the bid and 900 on the offer, they call the book imbalanced. It's a real reading, but with a catch that makes it the least trustworthy of the lot: resting orders can be cancelled. Traders pull and re-place liquidity constantly. So a lopsided book is a statement about intention at one moment, not about trades done. We group it with the footprint sense when we explain things to newcomers because both deal in buyers versus sellers, but they use different feeds and fail in different ways.
The case that confuses everyone
Here's a situation that shows why the senses can't be swapped. A news candle blasts through 20 points on the 5-minute chart. The next two candles continue, and the three-candle rule is met cleanly. By the price definition, a textbook imbalance.
Now open the footprint for that middle candle. Picture the footprint for that middle candle with roughly even volume at the bid and the ask across the whole range, nothing near a 3:1 ratio. Plenty of trading happened on both sides while price travelled. By the footprint definition, there’s no imbalance at all.
Both readings are right, because they answer different questions. The price sense says the range wasn't revisited by the neighbouring candles. The footprint sense says nobody was lopsided inside the bar. When a course says "this candle left an imbalance" and a footprint tool shows nothing, the tools haven't disagreed. The word has. We're describing this as a case rather than showing a screenshot, because the exact picture depends on the instrument and the data feed, and it can happen on any of them.
What each sense can and can't tell you
None of the three is a signal by itself. That's a statement about all of them, not modesty.
The price sense tells you a displacement happened and where. It can't tell you whether price will return, only how often it has, under a fixed rule, in a given sample. The footprint sense tells you who was aggressive at a price. It can't tell you whether that aggression was the start of a move or the end of one, since absorption and exhaustion both show up as heavy one-sided volume. The auction sense tells you what was queued before a cross. It can't tell you what the market does an hour later.
If you want to put any of these to work, define your rule first: the data, the threshold, the window. Then count how it behaved before you attach a feeling to it. And paper trade whatever you build before any real money touches it.
Vocabulary decoder: which word maps to which sense
Half the confusion is that the same idea has five names. Here's a working map. Course authors aren't always consistent, so treat it as a starting point and check each author's own definition.
| Term you'll see | Usually means | Data you need |
|---|---|---|
| Imbalance (in SMC/ICT content) | Price sense, a three-candle gap | Candles |
| Fair value gap (FVG) | Price sense, with direction (bullish or bearish) | Candles |
| Inefficiency | Price sense, framed as "one-sided delivery" | Candles |
| Liquidity void | Price sense, often a larger, faster move | Candles |
| Stacked imbalances | Footprint sense, several flagged cells in a row | Footprint / cluster data |
| Bid-ask imbalance, diagonal imbalance | Footprint sense | Footprint / cluster data |
| Order book imbalance | Resting-order mismatch | Depth of market |
| Order imbalance, closing imbalance | Auction sense, a published count | Exchange auction feed |
When a gap later trades through and flips role, that's a separate topic with its own states. We walk through it in the inverse fair value gap guide, and the wider map of how these ideas fit into one framework lives in the ICT one-page map.
Three questions to put to any imbalance claim
Once you can name the sense, a claim becomes testable. Ask three things before you trust it.
What's the rule? For the price sense, that means wick-to-wick or body-to-body, and whether there's a minimum size. For the footprint, it means the ratio and whether it's diagonal or horizontal. In the 500-gap sample we recorded size as a variable instead of screening small gaps out, and that single choice changed the picture: 178 gaps fell under 0.3× ATR, 221 sat in the middle, and 101 were over 0.7×. Screen the small ones out and the headline fill rate drops, because the small ones fill fastest, with a median of 4 bars against 14 for the large bucket.
What's the window? "It fills eventually" is unfalsifiable. Everything fills eventually on a long enough clock. A fixed horizon such as 20 sessions forces a number that someone else can reproduce, and it makes the unfilled share visible too: 9% of ES gaps, 17% of BTC/USDT gaps and 7% of EURUSD gaps were still open when the window closed.
What's the timeframe and market? A gap on a 15-minute ES chart and a gap on a daily BTC chart are different animals. Where it formed matters as well: in the same sample, gaps printed in the first 45 minutes of a session touched on 90% of occasions, while overnight ones touched on 71%. A claim that doesn't say where and when is a claim you can't check.
The same habit applies to footprint claims. Ask which instrument, which feed, which ratio, and how many occurrences. Heavy one-sided volume at a level can precede a push or mark the last gasp of one, and a small count of examples can't separate the two. A handful of cherry-picked screenshots can't either. That's why we keep returning to counting: it's dull, it's repeatable, and it's the only thing that turns a definition into evidence.
A two-minute triage you can run on any chart
Run these four checks in order the next time you meet the word.
First, look at what the chart is made of. If it's candles only, the word can only mean the price sense, so apply the three-candle rule and check the author's fill rule. Second, if you see bid-by-ask numbers inside bars, you're in footprint territory, so find the ratio setting before reading any colour. Third, if the context is a pre-open or pre-close notice with a share count, it's the auction sense, and you read the venue's documentation. Fourth, if there's a ladder with resting sizes, it's the book. That's the whole method.
If you use an indicator that draws zones automatically, check which sense it computes. Our own SMC Toolkit Pro works from candle structure, which makes it a price-sense tool. It doesn't read bid-ask volume, and it would be misleading to say otherwise. Whatever you use, paper trade the setup first and judge it on a sample of at least a few dozen occurrences, not three screenshots.
Why the triage saves real time
We've seen the cost of skipping it. Someone learns the price definition, buys a footprint tool, sees blank cells where they expected zones, and decides the tool is broken. Or they take a fill-rate figure from a candle-based study and expect it to describe footprint flags. In our experience those mix-ups account for most "it doesn't work" complaints about imbalance tools. The software is usually doing exactly what its definition says. The trader's definition was different.
There's a quieter benefit too. Once you can name the sense, you can ask sharper questions of anything you read. What's the fill rule? What's the window? What ratio? Which venue? A claim that survives those questions is worth keeping. One that can't answer is a slogan.