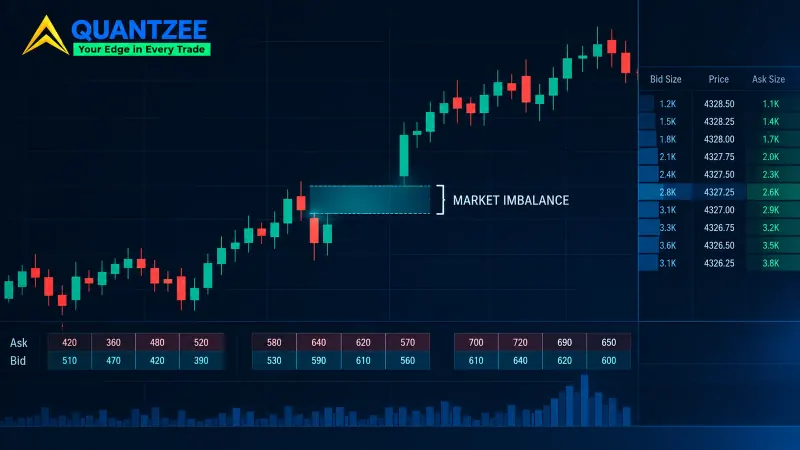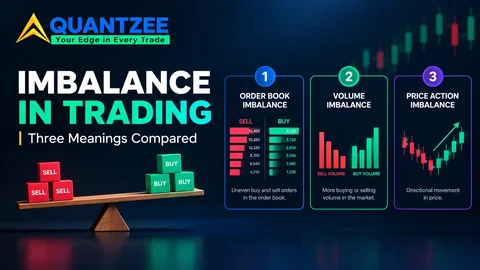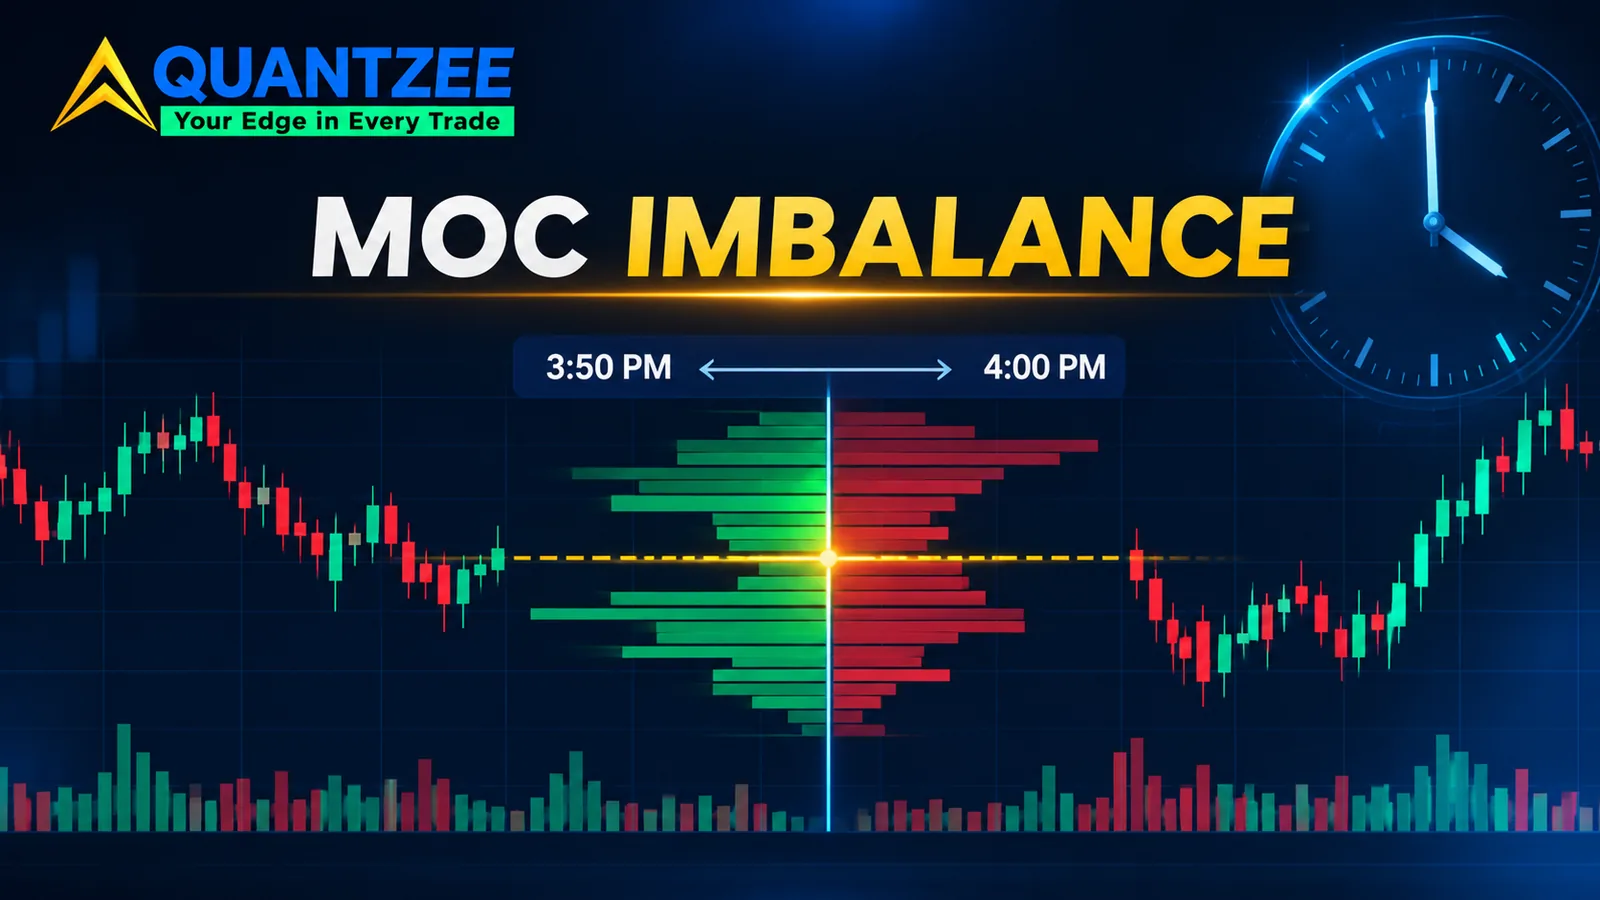
An MOC imbalance is the gap between the buy and sell orders queued for a stock's closing auction. Exchanges publish it every second from 3:50 p.m. Eastern until the 4:00 p.m. cross. Almost every article on the topic tells you to watch it. Very few mention that it ships in a paid exchange data feed that a standard retail chart does not carry. This piece names those feeds, sets out the timetable from the exchanges' own pages, and then spends its second half on the question that actually matters if you don't have the feed: what can you still work out from the price and volume you can see?
One note before we start. Our team has not run a closing-auction study, and we hold no auction data of our own. Nothing below is a hit rate or a trading signal. It is exchange documentation, one piece of exchange research, and the mechanics that follow from them.
What an MOC imbalance actually measures
Forget the sentiment framing for a minute. A closing auction is a single calculation. The exchange gathers every order that asked to trade at the close and looks for one price that matches the most shares. Everything trades at that price, in one print.
The imbalance is what's left over. At the current reference price, if 900,000 shares want to buy on the close and 600,000 want to sell, 600,000 shares are paired and 300,000 shares of buying are unmatched. That 300,000 is the imbalance, and the side it sits on is the side that still needs someone to take the other end.
That's why MOC imbalances get so much attention. They tell you which side of the auction is short of liquidity right now. They do not tell you who is right about the stock. A pension fund rebalancing, an index fund tracking a weight change and an options desk hedging can all sit on the same side for reasons that have nothing to do with tomorrow's price.
According to the NYSE's own description of its closing auction, each imbalance message carries a few core fields:
- Reference price: the price at which the imbalance is calculated.
- Paired quantity: shares that match at that reference price.
- Total imbalance: the unmatched shares and the side they sit on.
- Indicative match price: the price that would clear the most shares if the auction ran now.
The last two move together, but not one for one. A big imbalance can shift the indicative price a little or a lot, depending on how much offsetting interest is resting nearby.
The closing auction timetable, venue by venue
The cut-off times matter more than any other detail here, and secondary articles often merge them. So here they are separately, as we read them on each exchange's site on 15 November 2026. When we compared Nasdaq's page with NYSE's, the windows matched for primary listings but not for Arca. Rules change. Check the source pages before you rely on a minute.
NYSE (Tape A listings)
Per the NYSE's closing-auction guide, 3:50 p.m. is the cut-off for entering market-on-close (MOC) and limit-on-close (LOC) orders. After 3:50, new MOC and LOC orders are accepted only if they offset a significant published imbalance. Requests to cancel MOC, LOC and Closing Offset orders are rejected after 3:50. Imbalance publication starts at 3:50 p.m. and runs every 1 second until the auction completes. Closing D Orders, the floor broker order type, can be entered or modified until 3:59:50 p.m. The NYSE trading-information page lists 3:50 to 4:00 p.m. as the closing imbalance period, with the auction at 4:00.
Nasdaq
Nasdaq calls its version the Closing Cross and its imbalance message the Net Order Imbalance Indicator, or NOII. Per Nasdaq's open-and-close page, dissemination of closing imbalance information runs from 3:50 to 4:00 p.m. The opening equivalent runs from 9:25 to 9:30 a.m. ahead of the Opening Cross.
NYSE Arca, NYSE American and NYSE Texas
These don't share one clock. The NYSE guide says NYSE Arca and NYSE Texas begin imbalance publication much earlier, at 3:00 p.m., with a closing imbalance freeze period from 3:59 to 4:00 p.m. NYSE American lists a 3:50 to 4:00 p.m. freeze period. If you trade ETFs, which often list on Arca, the 3:50 rule you read about in most blog posts is the wrong one.
European venues run their own closing call auctions with their own schedules and rules. This piece sticks to US listings.
Which feed carries the number
This is the part most pages skip. The imbalance isn't a hidden indicator you can add to a chart. It's an exchange data product, and you get it through a market data entitlement.
On Nasdaq, the NOII is available by subscription via Nasdaq TotalView, Nasdaq DataStore, market data distributors and service bureaus, according to Nasdaq's own page. On NYSE, imbalance messages ship as a dedicated imbalance feed, listed in the exchange's data-product catalog under Imbalances.
Both are priced as exchange data, with separate fees for professional and non-professional users, plus whatever your platform or vendor charges to redistribute it. We haven't quoted a dollar figure because the fee schedules change and depend on your user status. Pull the current schedule from the exchange before deciding whether it's worth paying for. Some direct-access brokers bundle an imbalance window into their higher tiers. A typical charting package with consolidated last-sale data does not.
So when a guide says "watch the MOC imbalance at 3:50," the honest version is: if you subscribe to the right exchange feed, or your broker passes it through, you can watch it. Otherwise you can't.
The order types that take part, and the one that must be priced
Three order types matter most at the close:
Market-on-close (MOC). Trade at whatever the closing price turns out to be. No price limit. These are the orders that create most of the visible imbalance, because index funds and benchmark-tracking desks need the official close, not a better price. The SEC's investor site at Investor.gov gives a plain summary of how market and limit orders differ, which is the same trade-off scaled down to a single print.
Limit-on-close (LOC). Trade at the close only if the closing price is at or better than your limit. LOC orders can add to the imbalance or offset it, depending on where the indicative price sits against their limits.
Imbalance-only orders. On Nasdaq these are Imbalance Only (IO) orders. They exist purely to offset on-close orders. Nasdaq's rule is blunt: IO orders "must be priced (limit), no market IO orders," and an IO buy or sell only executes at or above or below the 4:00 p.m. bid or ask. NYSE's offsetting machinery, including Closing Offset orders and floor D Orders, follows a similar logic with its own rules.
Because offsetting liquidity has to name a price, a late imbalance isn't simply soaked up at the last trade. Someone has to be willing to stand on the other side at a stated level. If nobody is close, the indicative match price walks until enough offsetting interest appears. That walk is what people describe when they say the close "got pushed."
What the exchange's own research says about impact
Most secondary pages throw around basis-point figures with no source. There's a better reference. In August 2023 the NYSE published "Closing Auction: Immediate market impact, price drift and transaction cost of trading" by Choey Li, its quantitative research lead. The paper discloses its methodology: NYSE auction imbalance data for 2023 year-to-date, the 3:55 to 4:00 p.m. window when all eligible order types count toward the imbalance, and the reference price move over the next 10 imbalance updates, roughly one per second.
The research found that, for Russell 1000 names between 3:55 and 3:56 p.m., imbalance changes averaging 2.4% of CADV (the paper's average-daily-volume yardstick) moved the reference price by about 0.34 times the daily average spread straight away. Only 52% of updates in that minute showed any immediate impact at all. Across size buckets, the immediate move for Russell 1000 stocks ran from 0.2X to 0.39X the daily spread, and the drift to the close from 0.6X to 1.7X.
Two findings are worth holding onto. First, timing matters: for orders around 2.4% of CADV, impact was 0.3X at 3:55 and 0.4X in the final minute. Immediate impact rises as the auction nears, while further drift shrinks. Second, the paper found size thresholds beyond which impact became large and persistent in the last three minutes: about 0.47%, 0.86% and 1.18% of CADV.
Read that carefully. It measures how a change in the published imbalance moves the auction's own reference price within seconds. It does not say anything about the next day's open, or about whether a retail trader acting on the number makes money. Nobody on page one has shown that, and we haven't either.
Why the imbalance doesn't give you direction
A buy imbalance at 3:51 means buyers need sellers at the current reference price. That's it. Three things stop it from being a clean signal.
The number keeps changing. It's republished every second, and offsetting orders, LOC orders crossing their limits and late entries all reshape it before 4:00. A 3:50 headline figure is a first draft.
The imbalance is often the point, not a forecast. Index funds buy on the close because the index says so. When the auction absorbs that demand, the reason for the pressure is gone by the next morning.
The other side is professional. Market makers and imbalance traders see the same feed at the same second, with faster connections. If an imbalance looked like free money, they'd already be offsetting it. That's literally what IO and offset orders are for.
An independent December 2025 write-up on the opening and closing auctions, published on Substack, reports that closing auctions grew from about 3.1% of consolidated volume in 2010 to a record near 9.4% in the second quarter of 2024, citing named sources. The close is getting bigger. That makes it more important to understand, not easier to front-run.
What you can infer without the feed
Here's the honest part. Without the imbalance feed you cannot see the number. You can see the results of the auction and a few things that predict when auctions will be heavy. The list is short and each item has limits.
A volume spike in the final ten minutes. On a 1-minute chart, a sharp jump in volume from 3:50 onward, followed by a large closing print, tells you the auction was busy. It doesn't tell you which side was short during the build. By the time you see the closing print, the auction is done. Pair it with a session VWAP and you can at least judge whether the close landed far from where most of the day's volume traded.
A closing print well away from the last trade. If a stock trades at $48.20 at 3:59 and the official close prints at $48.55, the auction cleared above the continuous market. That's after-the-fact evidence of unmatched buying. Useful for review. Useless for an entry at 3:55.
Footprint and bid-ask volume in the last minutes. Aggressive buying or selling in the continuous book often lines up with a lopsided auction, since traders hedge or pre-position. A footprint chart of bid and ask volume shows that aggression bar by bar. It's indirect. Continuous-book flow and auction interest are separate pools, and they can disagree.
Known calendar dates. This is the one input with real value, because it's published ahead of time. More on it below.
What you can't do without the feed: see the size, side or change of the imbalance before 4:00, or know whether offsetting interest is building. Anyone selling a retail indicator that claims to show live MOC imbalances from ordinary chart data is estimating, not reading. Ask what feed it uses.
If you want the broader version of this skill, reading pressure from what the tape does show, our guide on how to read order flow covers aggressive versus passive volume, absorption and delta in the continuous session. It's the closest substitute for auction data that a non-subscriber has. The order flow glossary entry is the short version if you just need the terms.
Two dates when auction effects are visible to everyone
You don't need a feed to know when the close will be heavy. Two kinds of event are published well in advance.
Index rebalances. S&P Dow Jones Indices runs quarterly rebalances that take effect after the close on the third Friday of March, June, September and December, and it announces additions and deletions days before. FTSE Russell's reconstitution has historically been an annual June event, and the provider has announced a move to a twice-yearly schedule. On those days, index funds must trade at the close, and closing volume often jumps to several times a normal day.
Quarterly expiries. Stock options, index options and index futures all expire on the third Friday of the quarter-end months, the day traders call triple witching. Hedges unwind and positions roll into the close.
On those days you can study the 1-minute volume from 3:50 to 4:00, the gap between the last trade and the official close, and how the next session opens. You can do that for free, from data you already have, across 4 quarterly dates a year. It won't tell you the imbalance. It will show you what heavy closes look like on the names you trade, which is more than most imbalance explainers give you.
How this fits a Quantzee workflow
Quantzee doesn't carry exchange imbalance data and doesn't publish a closing-auction model. Where our tools help is the inferable side: session volume structure, VWAP context, and order-flow reads during the continuous session. Many traders find those useful in the last hour, when the auction is building and the tape starts to lean. If you're choosing what to put on a chart for that window, our rundown of day trading indicators covers what each one does and doesn't measure. The related piece on the three meanings of "imbalance" explains why an auction imbalance and a footprint imbalance are different things that share a name.
Software like ours is analytical. It doesn't tell you what to trade at 3:55, and nothing here is a recommendation.