Search for TradingView strategies and most of page one is the platform's own script library, a code repository and a few help pages. That makes sense. Most people typing that phrase want to find a script, not read an essay. This post is for the slice that's left over: you already have something on your chart, a favourite indicator or a script you picked up from the library, and you want to know whether it can be tested at all, and what the test will really tell you.
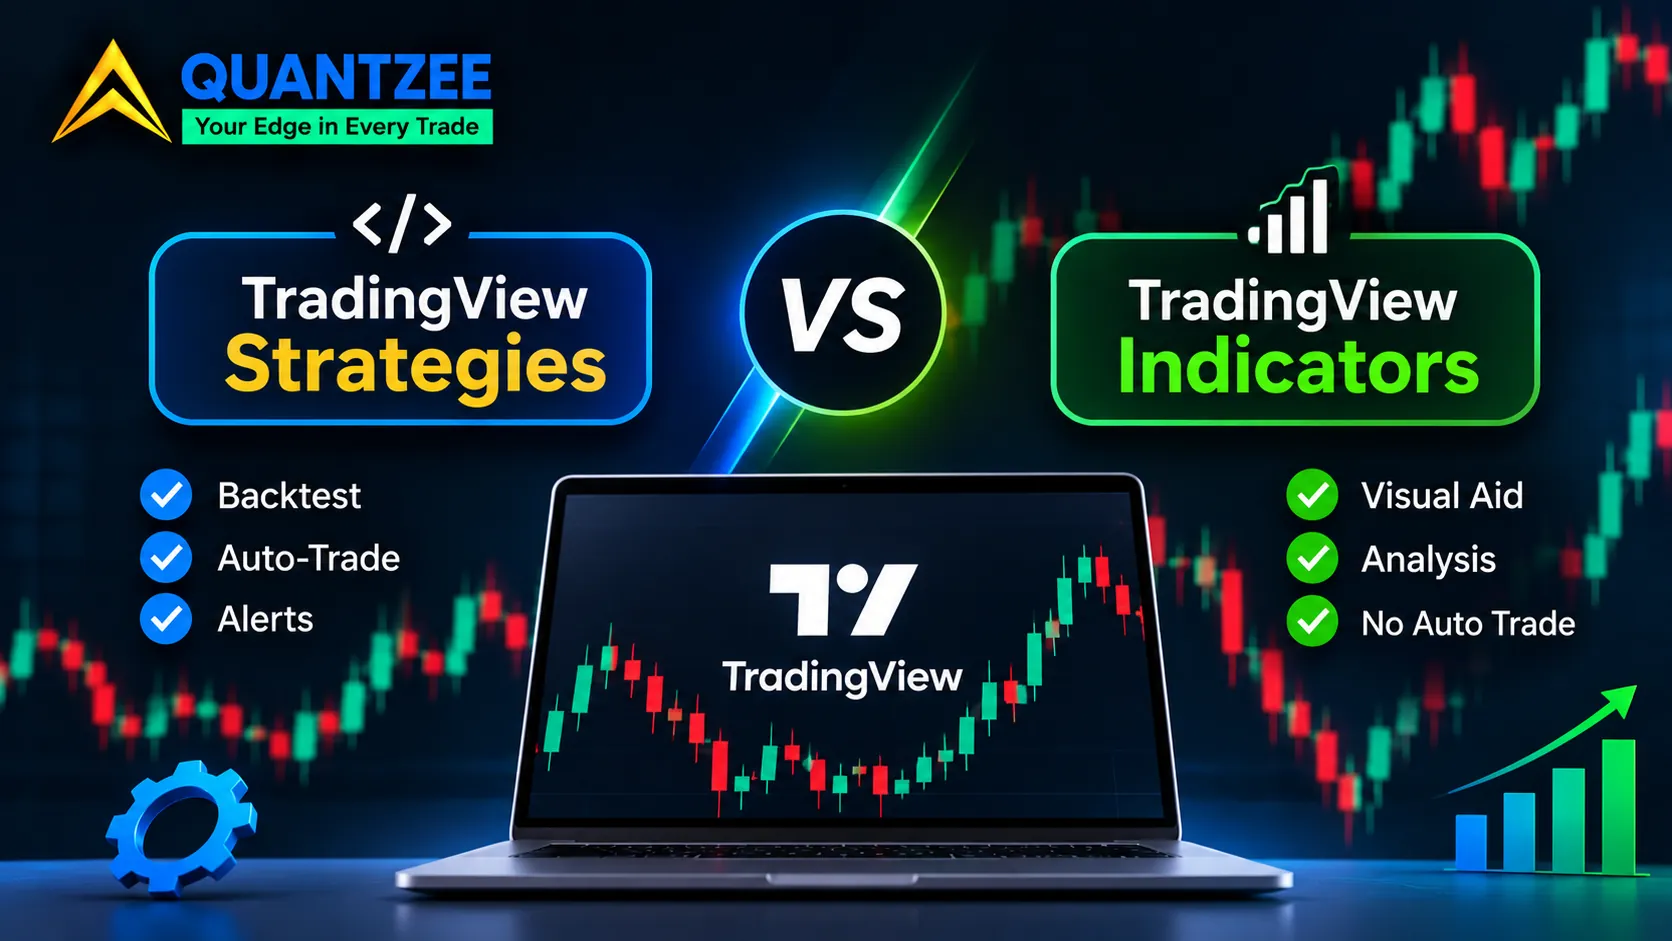
The short answer sits in a single line at the top of the script. A script that opens with indicator(...) can draw lines and fire alerts. A script that opens with strategy(...) can place simulated orders, and only that kind produces a performance report. A script can't be both. Two other pages already explain that split well, so we won't spend long on it. The useful part comes after it: how to tell in five seconds what's on your chart, what the platform's built-in strategies actually contain, and the four things an indicator is missing before it can be tested.
The five-second test: what is actually on your chart?
Add the script to a chart and look at the bottom of the screen. A strategy opens the Strategy Tester panel with an Overview tab, a Performance Summary and a List of Trades. You'll see net profit, a trade count, a max drawdown figure and a table of entries and exits with dates and prices. An indicator never opens that panel. It just draws on the price pane or in a pane beneath it, and the tester stays empty or isn't offered.
There's a second tell on the chart itself. A strategy usually prints small order markers, arrows or labels showing where it would have entered and exited, because it's placing simulated orders. Many indicators print arrows too, which is where the confusion starts. An arrow from an indicator is only a drawing. It isn't a trade, it has no size, it has no exit unless the author drew a second arrow, and it will never appear in a trade list.
Three signs, then, in order of reliability:
- The tester panel shows a trade list. That's a strategy.
- The tester panel is empty, but you see arrows or "buy/sell" labels. That's an indicator drawing its opinion.
- Open the source if it's visible and read line one.
indicatororstrategysettles it.
Pine Script, the language behind both, is covered in our own Pine Script glossary entry if you want the vocabulary. For this post you only need the distinction.
The declaration difference, in plain words
An indicator answers "what is the market doing?" It calculates values on each bar and shows them. It can also raise an alert when a condition becomes true. It has no concept of a position, a fill, an account balance or a cost.
A strategy answers a different question: "if I'd acted on these rules, what would have happened?" To answer it, the script has to say when to enter, when to leave and how much to trade, and the platform then simulates fills against historical bars. That's why the tester only exists for strategies. There is nothing for it to replay in an indicator.
People sometimes assume the difference is cosmetic, as if a switch could turn one into the other. It can't. Converting means rewriting the script's final stage so it issues orders instead of drawing. That's the subject of a later section, because it's the step most guides skip.
Where the built-in strategies live, and what they encode
TradingView ships a short list of ready-made strategies you can add without writing anything. You'll find them through the Indicators menu, under the built-ins category for strategies, and the names change a little from time to time, so check the list on your own account instead of trusting any article, including this one. We haven't reproduced the full list here for that reason.
What matters is the pattern they follow. The common ones are simple on purpose:
- A moving-average crossover. Buy when a faster average crosses above a slower one, sell or reverse when it crosses back.
- An oscillator threshold. Buy when a momentum oscillator drops below a low level and turns, sell when it rises above a high level.
- A channel breakout. Buy when price closes above the upper band of a channel built from recent highs, exit when it falls through the lower band.
Each one is a few lines. Each has a stated entry, a stated exit and nothing else. They exist as reference implementations: working examples of how to wire a signal to simulated orders, so a person learning Pine Script can read the source and copy the structure.
They aren't trading plans, and treating them as one is the first trap. A crossover with default lengths has no filter for trending versus ranging markets, no stop, no position sizing beyond a fixed quantity and no view on costs. Run it on a quiet range and it will whipsaw. Run it on a strong trend and it will look brilliant. Neither result says the idea is good or bad. It says the market you picked suited it or didn't.
A fair use of the built-ins is as a control. Add a plain crossover to the same chart and timeframe as the script you're evaluating. If your fancy strategy only matches the crossover's result, or does worse, the extra complexity hasn't earned anything yet.
Why "best TradingView strategy" can't be answered
It's the most natural question, and as worded it has no answer. Look at how the public library orders its results. Scripts are sorted by popularity, by editors' picks and by boosts. Those numbers measure attention: how many people clicked, saved or liked. They don't measure how a rule set behaved on data it never saw.
The difference matters because attention rewards the wrong things. A script with a spectacular equity curve on its default settings and one favourable symbol is easy to share and easy to boost. A script that shows a modest, honest result with realistic assumptions gets scrolled past. The ranking selects for the first kind.
There's also no common yardstick. One author tests on daily bars of a single index, another on five-minute bars of a crypto pair with leverage. Their headline profit numbers can't be compared, because the instrument, the period, the order size and the cost assumptions all differ. Even a clean library sort couldn't produce a meaningful "best".
So drop the question and replace it. We'll get to the replacement near the end.
What it takes to turn a favourite indicator into something testable
Say you've got an indicator you like, one that prints a buy arrow and a sell arrow. You want to know how it would have done. Four things are missing, and most indicator authors deliberately never state them.
1. An explicit entry condition
"The arrow appears" isn't a condition. The script has to say exactly what it checks and on which bar. Does it enter on the bar where the signal forms, or the open of the next one? That single choice can change results a lot, and an indicator never had to decide it.
2. An explicit exit condition
Many indicators only signal direction. They say "up" and later "down," but nothing says what closes the first trade. Is the opposite arrow the exit? A fixed profit target? A stop? A time limit? Without one, the tester has no way to close the position, or it closes on the next opposite signal by default, which may not be what the author intended.
3. A position size rule
A tester needs to know how much to trade: a fixed quantity, a fixed cash amount, or a percentage of equity. The choice shifts the profit figure and, more importantly, the drawdown. Leave it at a default and you're reading a number someone else picked for you.
4. An order type
Market, limit or stop? A market order fills at the next available price. A limit order might never fill. A stop order fills at a worse price when it triggers. The simulated result depends on which one the script uses, and an indicator, which only draws, was never forced to choose.
That's why authors rarely state them. Declaring a stop, a size and an exit turns a pretty signal into something that can be measured, and measurement can be unflattering. If a favourite indicator's author hasn't published these four things, you'll have to choose them yourself, and then you're testing your version of the idea, not theirs. That's fine. Just be clear about which one you tested.
Once you have a script that declares itself a strategy, the settings that decide how honest its result is (commission, slippage, order size, pyramiding) are a separate subject. We cover every one of them in our guide on how to backtest a TradingView indicator, which is the right next step after this post. We won't repeat that material here.
Three documented ways a strategy result lies
You don't have to take our word for what follows. TradingView's own help centre documents all three. According to the platform's help page on non-standard chart types, order fills in the tester use the chart's open, high, low and close values, so on synthetic bar types the strategy can fill at prices that never actually traded.
Fills on synthetic bar types
Heikin Ashi, Renko and similar chart types don't plot real traded prices. They plot values calculated from them. A strategy running on one of those charts is simulating fills at calculated prices. The result can look smooth and profitable, and it can't be reproduced by sending orders to a broker. The help page tells users to test on standard bar types if they want realistic results.
Calculation inside the bar after a fill
A strategy can be set to recalculate on every tick, or to act within the bar after an order has already filled. Historical bars only have four prices each, but a live bar updates continuously. The two can behave differently, so a result that depends on intrabar logic may not repeat when the strategy runs forward. Our post on why a backtest doesn't match live trading goes through this gap in detail.
Higher-timeframe requests with look-ahead on
Pine Script lets a script request data from a higher timeframe. If the request is configured to look ahead, the script can see a value on a historical bar that wasn't known until that higher-timeframe bar closed later. The strategy then appears to predict the future, a trap that seven published Pine strategies acting only on closed bars avoid by design. Per the platform's help page on strategies that peek into the future, this produces unrealistically good results, and the result vanishes in real time.
All three share a trait: the report looks fine. Nothing flags the problem. You have to know to check chart type, intrabar settings and any higher-timeframe request in the source. That last check needs the source to be visible, which brings up the next point.
Protected and invite-only scripts
Some library scripts hide their source. Protected scripts show the code to nobody but the author. Invite-only scripts add an access list on top of that. The author has reasons, mostly commercial, and hiding code is not proof of a bad script.
It does change what you can know. With the source hidden you can't read the entry logic, can't see whether a higher-timeframe request looks ahead, and can't check the order type. You're left judging the script by its output, and the output is exactly the thing that can mislead. This is a different risk from the script being poor. A hidden script might be excellent. You just can't audit it, so you can't tell, and every number it shows rests on trust.
A practical rule: if you can't read the logic, treat any performance report from it as a marketing claim, not evidence, and test a version you can read instead.
Alerts versus orders: where automation mistakes start
Here's a gap that catches people. An indicator has no performance report, yet it can still raise an alert, and an alert can drive a webhook that tells a bot or a broker bridge to act. So you can wire an indicator straight to live orders without ever having tested it, because there was nothing to test.
Look at it from the other direction. A strategy's tester shows simulated orders. An indicator's alert fires on a condition, with no position awareness at all. If the alert says "buy" twice in a row, nothing in the indicator knows you already bought. If it fires on a bar that later repaints, the signal was real for a moment and then wasn't. The webhook only receives the message. It doesn't know whether the signal was sensible.
Most automation mistakes start there. The trader sees a pretty indicator, wires its alert to a webhook, and skips the step where entries, exits and sizing get stated and measured. Our TradingView alerts to webhook setup guide covers the plumbing. Do the testing first. If you've been picking signal sources, our overview of TradingView indicators sets out how we think about them.
The honest question to ask instead
Forget "which strategy is best." Ask this instead: which rule set has a stated entry, a stated exit and a stated cost assumption that I can reproduce?
Each part earns its place:
- Stated entry. You can read exactly when it enters, on which bar, with which order type.
- Stated exit. You know what closes the trade, including the stop.
- Stated cost assumption. Commission and slippage are written down, not left at zero.
- Reproducible. You can run it yourself, on a standard chart type, on a period you pick, and get the same numbers.
A rule set that clears those four is worth testing properly, whoever wrote it and however few likes it has. One that fails any of them isn't necessarily bad, but it hasn't given you enough to judge. Once you've got a candidate, run it through a proper stress pass. Our stress testing checklist for a trading strategy lists what to break and in what order. You can also read the backtesting glossary entry if any of the terms above were new.
Methodology note and limits
This post draws on the platform's help centre pages cited above and on the public descriptions of two indicator and Pine tooling vendors who cover the declaration difference. It contains no performance figures for any script, ours or anyone else's, because none were measured for this article. The interface changes over time, so confirm the panel location and the built-in strategy names on your own account. Quantzee builds analytical software for chart analysis, not financial advice, and nothing here is a recommendation to trade. Backtested results don't predict future outcomes. For general investor education on risks, see the regulator resources at Investor.gov and FINRA's investor pages.