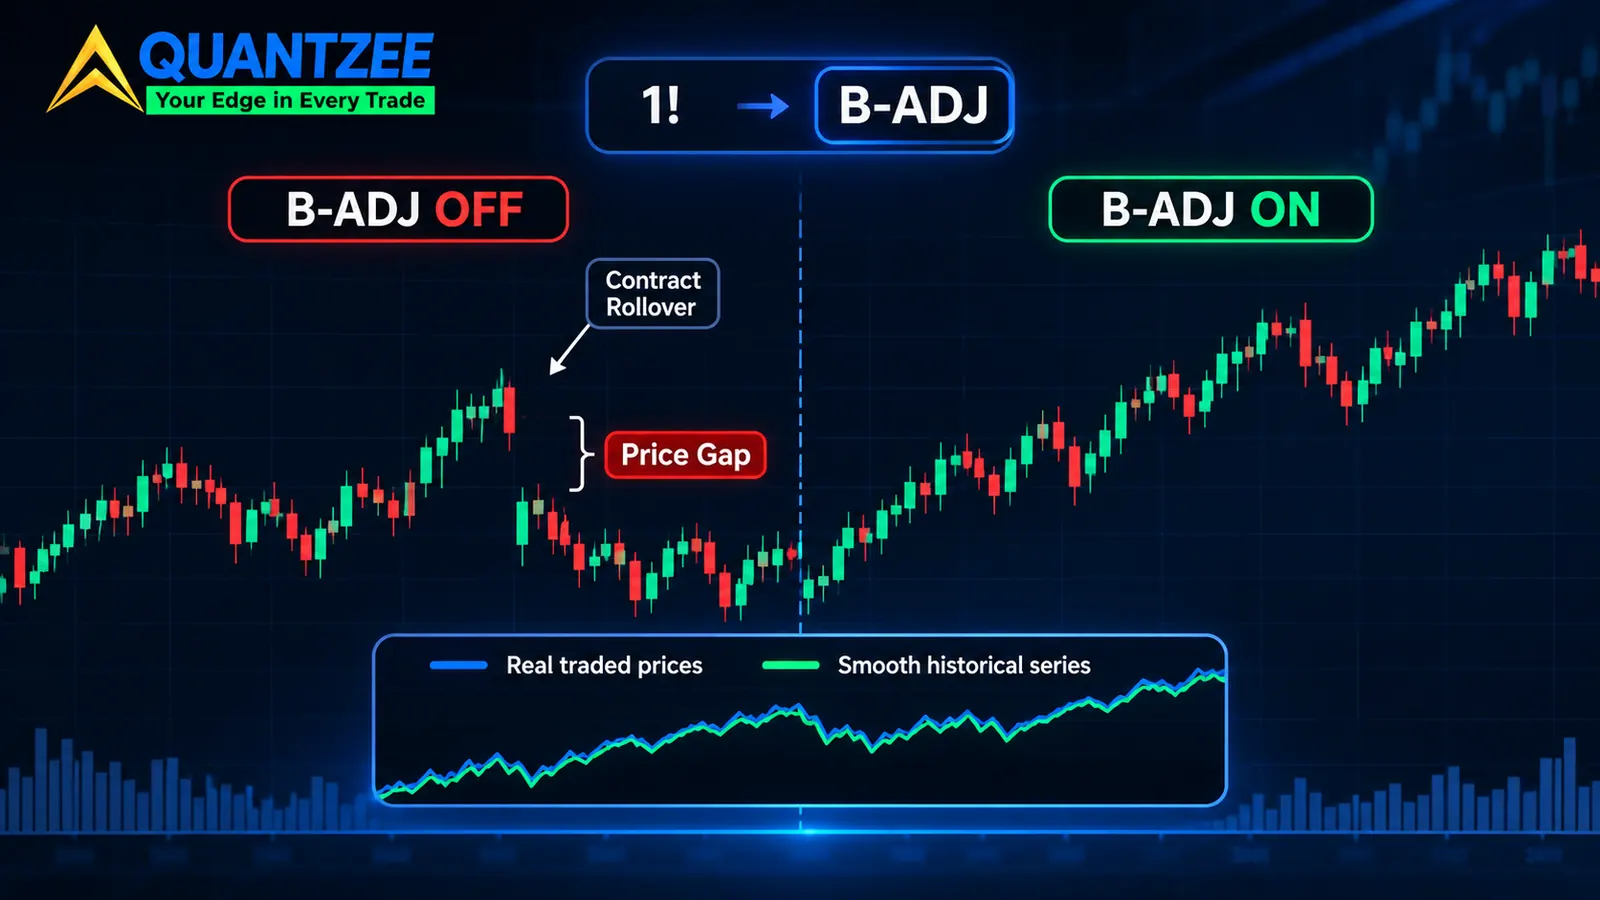
Short answer: on TradingView futures charts, a symbol like ES1! is not one contract. It's a chain of contracts stitched together, and the B-ADJ button decides how the joins are handled. With B-ADJ off, you see the prices that really traded, gaps included. With B-ADJ on, every older bar is shifted by the sum of past roll differences, so the gaps vanish but the old prices become numbers that never printed. Neither setting is wrong, but each one breaks a different kind of analysis, and a backtest run on the wrong one can record trades no trader could have taken.
This guide covers what 1! and 2! mean, the three ways a futures series can be joined, what the shift is worth in dollars, which indicators it breaks, and a short audit to run before you trust any futures backtest. If you're new to testing scripts, our guide on how to backtest a TradingView indicator covers the basics first.
Methodology: how we put this guide together
We read TradingView's own support page on continuous contracts, the three independent technical posts that rank for this topic, and the QuantStart reference on building continuous series for backtests. Every figure below is attributed to the page that published it. The sources were read on 11 November 2026. We did not count how many false trades a roll gap creates in a real strategy, so this post gives no such count. Instead, it gives you the audit to run on your own test. TradingView moves chart controls between releases, so treat the UI notes here as a guide and check them on your own screen.
What does 1! mean on TradingView futures charts?
Every futures contract expires, and the E-mini S&P 500 has four contract months a year: March, June, September and December. Each one trades for a while, then dies. A chart that showed only one contract month would stop every quarter, which makes it useless for reading a long-term trend or testing a strategy across several years of market history.
So TradingView builds a continuous series that strings those months together. According to TradingView's support page, "the 1! continuous contract represents the front or nearest expiration month contract." The 2! series represents the second-nearest month. When the front month ends, 1! moves on to the next one in line. That's why you see ES1!, NQ1!, CL1! and GC1! in symbol search alongside the dated contracts like ESZ2026.
Here's the catch: TradingView's page says 1! "rolls over to the next contract when the current front-month contract expires." Yet a published case shows the roll happening about a week before expiry (more on that below). The practical lesson is simple: the roll date is not a date you can assume, so read it from the data, not from a calendar.
The CFTC's futures market basics page is a good plain-English primer on how contract months and expiry work, if you want the background before going further.
Three ways to join tradingview continuous futures
Every continuous series has to answer one question. On roll day, the old contract closes at one price and the new contract trades at another. What should the series do with that difference?
There are three answers, and each one keeps something useful and throws something else away.
1. Raw splicing (no adjustment)
The old contract's bars are kept exactly as they traded. On roll day the series jumps to the new contract's price. Every historical bar is a real price, but the cost is a gap at each roll that isn't a market move at all. It's just the price difference between two contract months, driven mostly by carry and interest rates. On TradingView, this is what you get with B-ADJ off.
2. Back-adjustment (difference)
Each older bar is shifted up or down by the roll difference, so the join is smooth. Do this at every roll and the shifts add up over time. Point distances between bars are kept, while the price levels on old bars are not. This is what B-ADJ on gives you.
3. Ratio adjustment
Older bars are multiplied by the ratio of the new price to the old price instead of shifted. Percentage moves are kept, but point distances drift as you go back. Thortradecopier's article found that the two methods diverge more the further back you go: at a 2,000.00 bar, its ratio example gives 2,002.35 against 2,005.00 for difference adjustment, a 2.65-point gap worth about $132.35 per contract.
QuantStart's write-up on continuous futures contracts for backtesting makes the same point from the quant side: there is no single correct series, only the one that fits what you're measuring.
The arithmetic: what back adjusted futures data shifts, in dollars
This is the part most explanations skip, so here it is worked through step by step. The example comes from thortradecopier's article on back-adjusted data, and we quote it as published there.
The article uses eight rolls with these spreads: +4.25, +5.50, +3.75, +6.00, +5.25, +4.50, +5.75 and +5.00 points. Added together, they come to +40.00 points, so a bar that reads 4,240.00 on the back-adjusted chart actually traded at 4,240.00 minus 40.00, which is 4,200.00.
The article uses the E-mini S&P 500 multiplier of $50 per index point. On that basis, the 40-point distortion is worth 40.00 x $50 = $2,000 per contract. Note that the article calls these spreads illustrative numbers chosen for clean arithmetic, not observed quotes. The size of the real shift depends on the contract, the number of rolls in your window and the carry at each roll.
Don't re-use the $2,000 figure for a different market, because a Micro E-mini at $5 per point would turn the same 40 points into $200. Crude oil, gold and Treasury futures each have their own multiplier and their own carry. Check the contract specs and do the sum for the symbol you actually trade.
Why does it matter? Two years of quarterly rolls is eight joins, and five years is 20. The further back your backtest starts, the further the oldest bars sit from any price that ever printed.
Which indicators break on a shifted history?
The rule is easy to remember: if an indicator cares about the level of price, back-adjustment changes its answer. If it cares only about the change between nearby bars, it mostly doesn't.
Level-based logic that gets affected:
- A fixed price band, such as "short above 4,800."
- Round-number zones and psychological levels like 4,000 or 5,000.
- Long-horizon support and resistance drawn from years-old highs and lows.
- Any stop or target set in absolute price rather than distance.
- Percentage-based logic on a difference-adjusted series, because the base price is wrong, so 1% of it is wrong too.
Moving averages, RSI, MACD and ATR are mostly built from differences between bars, so they hold up far better. A 20-bar average shifts along with every bar inside it, so its shape stays the same, and a SuperTrend line rides ATR, so its distance from price survives too. Their absolute values still change, though. If your rule says "buy when the 200-day average is above 4,500," you're back to level logic.
Repainting is a related trap, because a series that gets rewritten at every roll means history can change after the fact, much like a repainting script. Our guide to non-repainting TradingView indicators explains how to spot logic that looks better in hindsight than it did live.
The B-ADJ button: should you turn it on?
On recent TradingView desktop layouts, B-ADJ sits in the strip of small toggles along the bottom-right of the chart, near ADJ (the dividend adjustment for stocks) and the session controls. The button lights up when it's active, and it only matters on continuous symbols like ES1!; on a dated contract there is nothing to join. TradingView changes its layout from time to time, so if you can't find it there, look in the chart settings under the symbol tab.
Treat it as opt-in and check its state every time you open a futures chart for analysis, because the setting can follow your layout from one symbol to the next.
Tradingwyckoff's guide gives the clearest decision rule on the page-1 results: "For discretionary trading you want B-ADJ OFF" and "for algorithmic backtesting you want B-ADJ ON." In our experience that split holds, with one refinement:
B-ADJ off when you're reading real levels. You want to know where buyers and sellers actually traded last March, so you need the prices that printed.
B-ADJ on when a backtest or an automated rule must not treat a roll gap as a market move. A strategy cares about distances and returns, not about whether 4,240 was a real print.
The refinement: if your strategy uses a level-based rule, neither setting gives a clean answer on its own. Run the test both ways, and if the results are very different, the strategy is leaning on the roll, not on the market.
The gap that isn't a gap
Now picture a breakout rule on a chart with B-ADJ off. On roll day the new contract opens 5 points above where the old one closed, so the chart shows a 5-point gap up, and a breakout system sees it as a fresh high and buys.
No trader could have taken that trade, because nobody held one continuous position across the old contract's close and the new contract's open. The gap is a seam between two different instruments with different expiration dates. A stop placed just under the old close can also get "hit" by a gap down that never happened in either contract.
A backtest can't tell the difference, so it records a real-looking trade with real-looking profit or loss. One such trade per quarter doesn't sound like much, but on a strategy that makes 30 trades a year, four fake ones is more than 13% of the sample. That's enough to turn a weak edge into a strong-looking one, or the other way round.
This is one of the quieter reasons a backtest and live trading drift apart. Our post on why your backtest doesn't match live trading covers the others, including fills, slippage and bar-close logic.
When does TradingView roll over futures contracts? The June 2024 mismatch
Even with the right adjustment setting, there's a second problem: your chart and your broker or automation tool may not roll on the same day.
TradersPost documented this with NQ1!, the continuous Nasdaq-100 futures symbol, in June 2024. According to its article, "TradingView rolled over their contract around June 14 and TradersPost rolled over theirs on June 19, 2024." The June contract itself expired on 21 June 2024.
For those five trading days, an alert that referenced NQ1! meant two different things depending on which platform interpreted it. On TradingView it pointed at the September contract, NQU2024. On the execution side it still pointed at the June contract, NQM2024. A signal computed on one contract month could be filled on another, at a different price.
Notice the dates, too, because TradingView's own support page says 1! rolls when the front month expires. Yet this case has TradingView rolling about a week before the 21 June expiry. That gap between documentation and behaviour is exactly why you should never hard-code a roll date into a script or a routine.
A safer workflow for futures rollover on TradingView
The fix the TradersPost article points to is the one we'd use too. It keeps the chart and the order apart, so each does one job.
- Chart on the continuous series. Use ES1! or NQ1! for analysis, with B-ADJ set to match the job (see above).
- Send orders against an explicit contract month. Put the dated symbol, like NQZ2026, in the alert message or the order ticket. Update it each roll period.
- Read the current contract in code. Pine Script exposes
syminfo.current_contract, which TradersPost suggests for identifying the real contract behind a continuous symbol. Log it on every alert so you can see which month a signal came from. - Watch the roll week. Volume moves to the next contract before expiry. A front-month series that hangs on too long can print thin, unrepresentative bars, a point thortradecopier's article also raises.
If you're automating, the execution window around a roll is also where fills drift most. Our breakdown of the futures automation fill gap at bar close goes deeper on timing. And if you're still setting up your account and data, start with how to trade futures on TradingView.
A five-minute audit before you trust any futures backtest
Run these checks on every futures test, whether it's your own script or someone else's results. Our team uses the same list when we build test runs for Quantzee's indicators.
- Check the symbol. Is the test running on a continuous series (1!) or a single dated contract? A single contract has no rolls, but it also offers only a few months of liquid, useful history.
- Check the adjustment setting. Note whether B-ADJ was on or off for the run. Write it next to the results, because a number without that label can't be compared with anything.
- List the roll dates inside the window. Quarterly contracts give four per year. Use
syminfo.current_contractto plot when the contract changed, rather than guessing from the calendar. - Flag trades near a roll. Mark any trade that opened or closed within one bar of a roll. Look at each one and ask whether it was a real move or just the seam.
- Re-run the other way. Run the test with B-ADJ flipped. If net profit or drawdown changes a lot, the strategy is sensitive to roll handling and needs a closer look before it goes anywhere near a live account.
When we've seen a test change sharply on that last step, it was almost always a level-based rule: a fixed price zone or an absolute stop. The fix was to rewrite the rule in terms of distance or ATR, then test again.
The National Futures Association's investor resources are worth a read too, especially on margin and contract size, before you size any futures position from a backtest.
Where this fits in your testing routine
Roll handling is one setting among many, and session times, bar type and data feed all change what an indicator sees. If you test on alternative chart types, our comparison of tick, range and point-and-figure charts shows how those interact with futures data.
The point isn't to pick one magic setting; it's to know which one your numbers came from, and whether the answer changes if you flip it. Quantzee's toolkits run on any TradingView symbol, futures included, and the same rule applies to them as to any other script: test on the series that matches the decision you're making. This is analytical software, not advice. Paper trade first.