Four Pages, One Missing Number
Search "scalping strategy" and four well-written pages show up. Between them they hand you entry rules, stop placement, and target sizing. One even derives a correctly-built breakeven win rate. What none of them hand you is a measured result on the timeframe they're describing. We went looking for that number ourselves. QuantZee ran a parameter sweep of SuperTrend across three instruments and eight timeframes. On the 1-minute to 5-minute band, the answer came back negative. Not marginal. Not mixed. Flatly negative, before a single dollar of the thin wins got eaten by cost. That's the gap this page fills. Not another rule set. The measurement the rule sets are missing.
Before we get to that sweep, credit where it's due. One of the four pages we read gets the cost arithmetic right. We're going to build on that work, not pretend we invented it.
What the Page-One Results Already Get Right
Four content competitors currently rank for this keyword: a trade-journal vendor, a futures-education site, a charting-tool vendor, and a forex guide. All four supply specific entry and exit mechanics. None of the four discloses a sample size or a date range behind its quoted win rate. The table below lays that out, so you can see it rather than take our word for it.
| Setup (source) | Entry / stop / target | Quoted win rate | Sample size & date range disclosed |
|---|---|---|---|
| Level 2 momentum / VWAP deviation / opening range breakout / micro pullback | Entries triggered on tape reads; stops $0.10–$0.20/share | 55–65%, 60–70%, 40–55% | None |
| Opening drive continuation / VWAP fade in balance / level reclaim | NQ example: $120 target, $80 stop | Not quoted — labelled "worth testing" | None |
| 9 EMA pullback with rejection candle (plus three more setups) | Target 1.5–2x risk; stop a few ticks beyond swing | 55–70%, labelled "illustrative ranges... not guarantees" | None |
| 1-minute forex scalp, four trading conditions | Not specified in exact ticks; targets sized against a 1.6 pip spread | Not quoted | None |
Read that last column again. Four pages. Four confident-sounding setups. Zero sample sizes. The two that quote win-rate ranges even hedge their own numbers in their own copy. One calls its range "illustrative." That's an honest admission that nothing behind it was measured.
The Cost Math, Taken One Step Further
The futures-education page in that table does something the other three skip. It works a real example through to a breakeven win rate. On an NQ setup with a $120 target and an $80 stop, the page adds $4 commission and $5 for one tick of slippage. That's $9 of total friction, shown as 15% of a 3-point target. Run that cost through the standard breakeven formula and the required win rate climbs from 40% to roughly 44.5%. That's a real number, properly derived. Per the source, it's the single most useful figure on page one for this keyword. It's also a one-way cost figure, measured against a wider futures target — and that's exactly where we want to extend it, not just repeat it.
A forex-focused competitor supplies the other half of the picture. Data from that page shows a 1.6 pip spread against a 6 pip target eating 27% of the move, stated one-way. Neither page carries the arithmetic to a round turn. Neither applies it to a target tighter than the ones they chose to illustrate.
Do both, and the picture changes fast. A round turn means you pay the spread or commission twice — once to get in, once to get out. The one-way 15% friction share on that NQ example becomes closer to 30% of the target once both legs and slippage on each side are counted. Now shrink the target from 3 points to something closer to a 5-pip scalp, on an instrument with a comparable spread. That same fixed friction consumes 40–55% of the move before direction has entered the picture at all. The arithmetic that looked survivable at a 3-point target gets considerably less forgiving at the tighter targets that actually define "scalping" for most readers. We're extending someone else's correct math here. The original one-way, wider-target derivation belongs to the page that built it first, and the round-turn, tighter-target extension is ours, worked out in the open so you can check it.
What a Published Sweep Actually Measured
Here's the part none of the four competitor pages attempt. We didn't stop at the cost arithmetic. QuantZee's own SuperTrend parameter sweep, published separately on this site, ran the mechanical signal that sits under most "best scalping settings" content against real market data and real transaction costs. The question it was built to answer: can a 1-minute to 5-minute holding period clear its own friction?
The test setup. A 45-combination grid per timeframe — ATR period at 7, 10, 14, 20, and 30, crossed with multiplier values from 1.0 to 5.0 in half-point steps. That grid ran across eight timeframes, from 1-minute up to daily, on three instruments: gold, silver, and bitcoin. Combined, that's 1,080 backtests. Fills were set at the next bar's open after the flip bar's close confirmed the signal, which rules out lookahead bias. Cost assumptions came from real spread and commission data, applied per instrument: 4 basis points round-trip on gold, 8 on silver, and 15 on bitcoin, which includes the taker fee plus a slippage allowance. The engine was vectorbt's signal-based portfolio simulation, with full equity reinvested per trade.
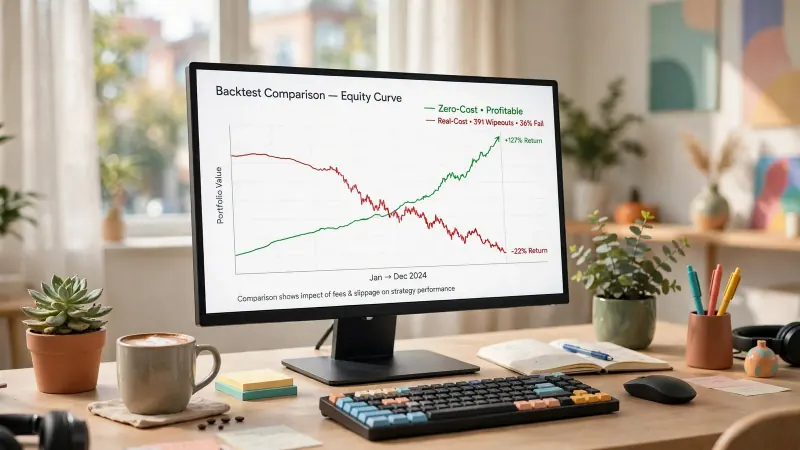
What we found. Not one of the 1,080 combinations was profitable on the 1-minute, 3-minute, or 5-minute timeframe, on any of the three instruments, even before real costs were applied. Once real costs went in, 391 of the 1,080 combinations — 36% — lost their entire notional outright. That loss concentrated exactly where trade count is highest and where cost compounds fastest: the sub-5-minute band. The settings that were profitable all clustered on the 1-hour and 4-hour timeframes instead. 95 of 360 settings cleared on gold. 93 of 360 on silver. 38 of 360 on bitcoin. The top-scoring gold setting — ATR 30, multiplier 2.5 on the 4-hour chart — returned a 42.9% win rate and a 1.01 Sharpe ratio across 340 trades, over a data set spanning nearly seven years. The top bitcoin setting dropped to a thinner 61 trades, which is its own caveat and worth stating plainly rather than burying in a footnote.
That same top-scoring gold setting illustrates the cost point from a different angle. At zero cost it returned 190.2%. At real cost, 153.3%. That's a $36,849 drag from friction alone, on a setup trading maybe a few dozen times a year — nowhere near the trade frequency a 1-minute strategy would generate. Scale that drag up to the trade count a 1-minute setup produces, and the arithmetic only gets worse. That tracks with what the sub-5-minute combinations actually did across the board: they lost outright, in bulk, before a single discretionary judgment about direction even entered the picture.
What That Sweep Does Not Prove
We want to be precise about the limits here. Overclaiming this result would undo the only real advantage this page has over the other four. The sweep tested one indicator — SuperTrend — on three instruments, none of which are equities or an index future. It does not test the four rule sets quoted on page one: the Level 2 momentum reads, the VWAP deviation and fade setups, the opening range breakout, the micro pullback, the 9 EMA rejection candle, or the forex 1-minute conditions. QuantZee has never backtested those specific strategies. This page does not claim otherwise, and it does not quote a win rate for any of them.
What the sweep does test, and the only question it answers, is narrower and more useful than a head-to-head comparison. Can a mechanical signal, run with correct fills and real per-instrument costs, clear the cost drag that a 1-minute to 5-minute holding period imposes? On three liquid instruments, with eight years of combined data behind them, the answer was no. That's a statement about the economics of short holding periods under real friction. It is not a verdict on every discretionary scalping method a trader might run.
The Random-Walk Control: Why an Unqualified Win Rate Tells You Nothing
There's a second QuantZee test worth bringing in here. It explains why quoted win-rate ranges with no sample size attached — like the 55–65%, 60–70%, 40–55%, and 55–70% figures on page one — can't be trusted on their own. That's true regardless of who publishes them.
We built 50 independent synthetic price series, each 1,000 bars long. Each was generated as a geometric random walk, calibrated to index-like daily volatility with zero drift and no shared structure between series. Each one was engineered to contain nothing a real trading signal could legitimately exploit. We then ran a simple fast/slow moving-average crossover against all 50, using one fixed parameter set with no per-series tuning. Trades averaged 37–38 per run. 22 of the 50 runs — 44% — came back with a positive return. 14 of the 50 — 28% — cleared a marketing-style bar: a 40%-or-higher win rate combined with a 1.3-or-higher profit factor. That's the exact kind of combined threshold vendors quote to claim a system "works."
Data from a control where nothing tradable exists still produced a positive, marketing-passable result more than a quarter of the time. This isn't a statement about any one of the four competitor rule sets specifically. We're not running their logic against this control, and we're not naming any of them here. It's a general statement about what an isolated win-rate figure is actually worth, when it's quoted without a sample size, a date range, or the method behind it: close to nothing, on its own, whoever is doing the quoting.
Execution Realities None of the Four Rule Sets Mention
Every one of the four page-one setups assumes execution happens cleanly at the stated price. In practice, four separate frictions sit between a signal and a filled order. A 1-minute to 5-minute target has almost no room to absorb any of them.
The fill assumption matters first. Our own sweep fills at the next bar's open, after the signal bar closes. That's a defensible, lookahead-free assumption, and it still isn't instant. A real scalp order has latency between the moment a condition triggers and the moment the order reaches the exchange. On most retail connections that's tens to low hundreds of milliseconds, depending on the venue. On a 5-pip or $0.10 target, that's not nothing. Add a thin order book, and a market order can walk through two or three price levels before it fully fills — a partial fill at a worse average price than the rule assumed. Around scheduled data releases, spreads widen sharply. A 1.6 pip spread sitting against a 6 pip target, in one competitor's own figure, can double or triple in the seconds around a release. That alone can turn a marginal setup into a losing one before a trader has reacted to anything.
Run any of the four quoted win rates through those four frictions, and the honest answer is that nobody — including the pages quoting them — has shown what survives. That's not an attack on the setups. It's the missing half of the page.
Order type adds a fifth friction nobody on page one names. A market order guarantees the fill but not the price, which is exactly the risk described above. A limit order fixes the price but not the fill, and on a 1-minute to 5-minute setup a missed fill often means the move already happened without you. Some of the four rule sets imply a market order at the trigger candle's close; none say so explicitly, and the difference matters more at tight targets than wide ones. A $0.10 slip on a $120 futures target is noise you can safely ignore. The same $0.10 slip on a 5-pip forex scalp can be the entire edge the setup was counting on in the first place, which is a very different risk profile hiding behind two setups that look similarly sized on paper. Before trading any of these rules live, decide which order type you intend to use and price the realistic slippage for that choice specifically, rather than assuming the backtest's fill logic will match what your broker actually does at the moment of execution.
How Many Trades Before a Win Rate Means Anything
One of the four competitor pages suggests 20–30 trades as an initial read on whether a scalp setup is working. That's not enough to separate a real edge from noise. Our own random-walk control shows why: 44% of runs, averaging 37–38 trades each, still produced a positive result on data engineered to contain zero edge. A sample in that range can't tell a working setup from a lucky one.
Two checks matter more than a quick initial read. First, hold to a floor of roughly 100 trades before drawing any conclusion. Not because 100 is magic — because it's the point where a handful of lucky or unlucky fills stop dominating the average. Second, check the parameter values next to the one you plan to trade, not just the single top cell in a backtest grid. In our sweep, the top-scoring gold setting sat at ATR 30, multiplier 2.5, on the 4-hour chart. What makes that result credible, rather than a fluke, is that the neighbouring combinations — ATR 20 and 30, multiplier 2.0 through 3.5 — clustered in a similar range instead of falling off a cliff. A single top cell surrounded by losers one step away, in either direction, is usually noise that happened to land on top.
The Timeframe Question the Whole Page One Avoids
Here's the structural finding our sweep actually surfaces. It's the one none of the four competitor pages engage with at all. Every profitable setting we found, across all three instruments, sat on the 1-hour or 4-hour chart. Nothing below 15 minutes cleared real cost on any instrument. Nothing below an hour produced the bulk of the profitable combinations. That doesn't prove a 1-minute entry can never work, under any rule set, on any instrument. It proves that for this mechanical signal, on these three instruments, with real transaction costs applied, the economics improved as the holding period lengthened and collapsed as it shortened.
Here's the honest condition for a reader running their own test. If your own backtest of a scalp setup shows a similar pattern — profitability concentrated on longer holding periods in your sample, and consistent losses once you shrink to sub-5-minute entries, even before costs — treat that as a signal. Test the setup a timeframe or two higher, rather than keep refining the 1-minute entry. It's not proof the 1-minute version is broken. It's a reason to check before assuming it isn't.
What Regulators Already Say About Short-Horizon Trading
None of the four competitor pages mention the regulatory backdrop a scalper actually trades inside, and it's worth knowing before you build a strategy around a short holding period. The SEC's investor bulletin on day trading risks states plainly that day traders can lose substantial capital quickly, and that promotional claims about day-trading systems routinely understate the risk involved — a caution that applies just as directly to a 1-minute scalp as it does to the slightly longer holding periods the bulletin was written for. FINRA's pattern day trader rules set out exactly how many same-day round trips a margin account can execute before extra capital requirements kick in, and those rules directly constrain how often a sub-5-minute strategy can actually be run. Read both before you plan a trade frequency, not after.
The Test Sequence Before You Risk Capital on a Scalp Setup
Before committing real money to any of the four setups above, or to a scalp rule set you've built yourself, run it through a sequence. Don't rely on a single backtest number.
Start with a next-bar-open, no-lookahead fill assumption and a real per-instrument cost model — commission plus a realistic slippage allowance, never zero cost. Require a sample of roughly 100 trades or more before trusting the result. Check the neighbouring parameter cells, not just the single top one. Then stress the setup against a random-walk control built on your own instrument's volatility profile, the way our 50-series test did, so you have a baseline for how often a rule with no real edge would still look profitable by chance. Finally, test one timeframe above and below your target entry. If the economics improve meaningfully as you lengthen the holding period, that's information worth acting on before you scale up the shorter version. We cover the full version of this sequence, including the specific thresholds we use internally, in our stress-testing checklist for trading strategies. It's worth working through end to end, rather than skipping to the parts that confirm what you already planned to trade.
If you're building or refining a signal to run this sequence against, our own research into which conditions actually hold up starts with the scalping indicators worth testing on TradingView. From there, our SuperTrend settings guide carries the full sweep behind the numbers above. Our piece on confluence versus correlation covers how multiple indicators interact, or just repeat each other, which matters once you start layering conditions onto a scalp entry. The random-walk methodology referenced throughout this page is detailed in full in our random walk indicator test.
None of this is a signal to trade, and nothing here is investment advice. QuantZee builds analytical software and publishes research like the sweep above — the decision, and the capital, stay with you. The right next step before risking money on any scalping setup is your own test, run against your own cost assumptions, using the stress-testing checklist above as the starting sequence rather than the finish line.