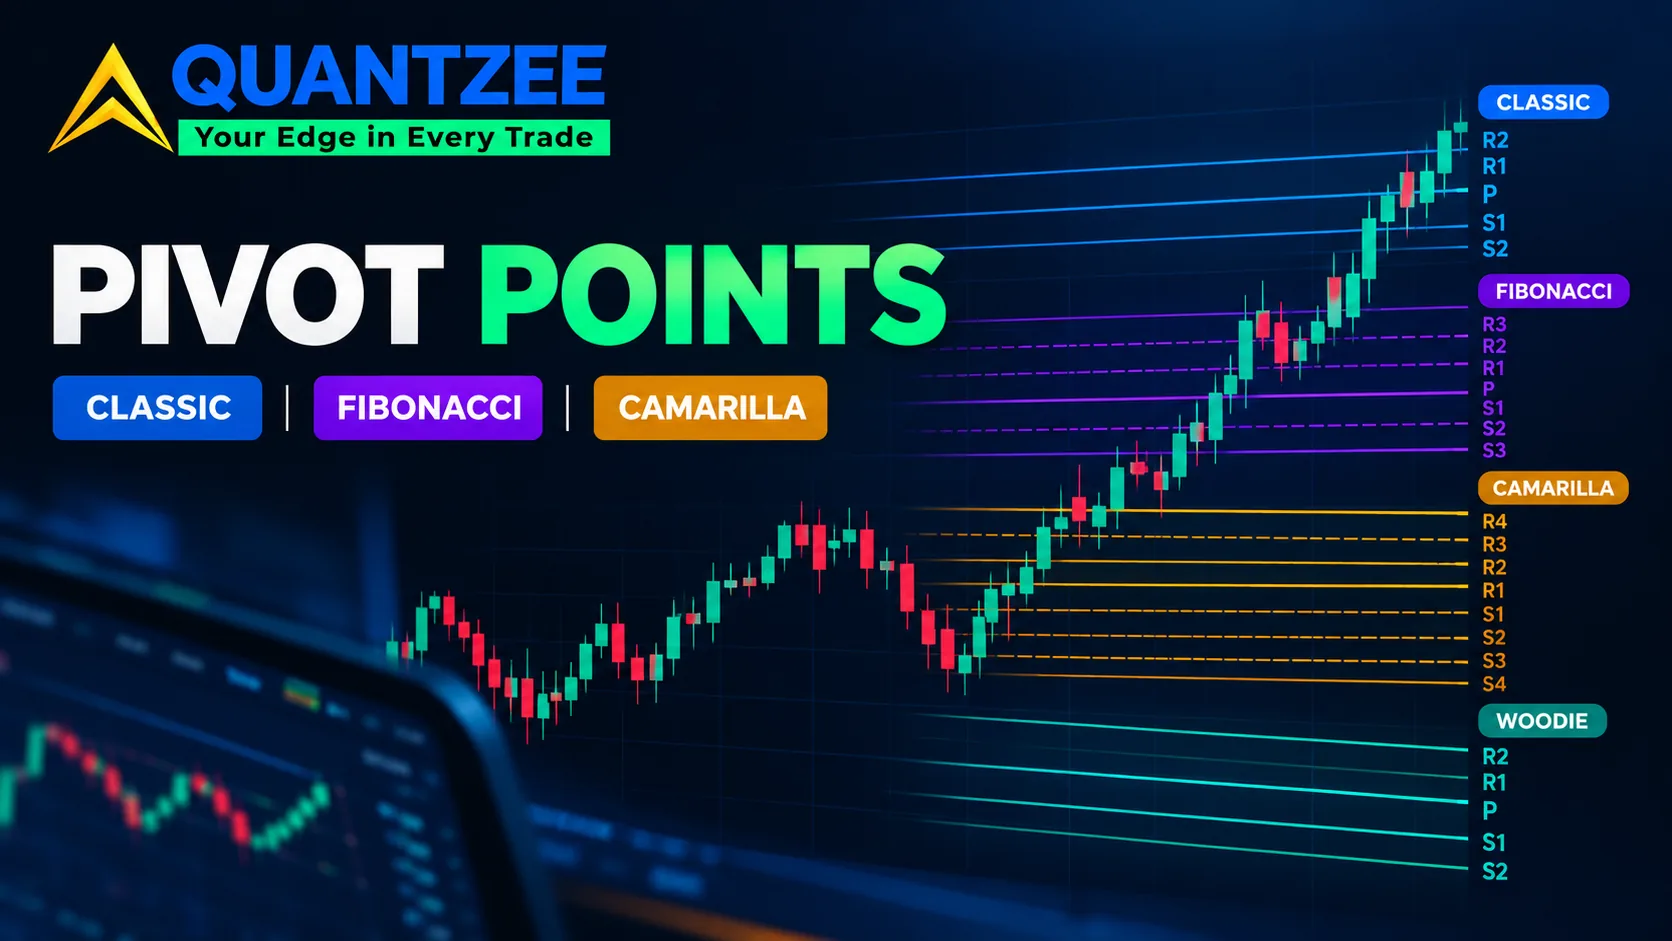
Four pivot formulas, one prior session's high, low and close. That is the entire input set. Yet traders argue for years over which formula is "correct." We tested all four — Classic, Fibonacci, Camarilla and Woodie — on the same sessions across NIFTY, SPX and EUR/USD. Then we measured how far apart their levels actually land. According to the source data we pulled, the honest answer is: on an ordinary day, barely at all. The formulas diverge meaningfully only on a specific subset of sessions. That subset is exactly where pivots matter most.
What each formula actually weights
All four start from the same three numbers — prior high (H), prior low (L), prior close (C) — and build a central pivot plus a stack of support and resistance levels around it. The difference is in how much weight each level puts on range versus close, and how far the outer bands stretch.
Classic. Pivot (P) = (H + L + C) / 3. R1/S1 come from 2P − L and 2P − H. The ladder widens from there using the full H−L range. This is the baseline every other formula is a variant of.
Fibonacci. Same central pivot as Classic. But the support/resistance bands are scaled by 0.382, 0.618 and 1.0 of the prior range instead of the Classic multipliers. We measured this pulling R1/S1 in tighter than Classic on trending days. On quiet days it ran wider. The Fibonacci ratios compress the inner band relative to Classic's linear spacing.
Camarilla. Built from eight levels (R1–R4, S1–S4). It uses a tighter multiplier (1.1/12, 1.1/6, 1.1/4, 1.1/2 of the range) around the close rather than the midpoint of H/L/C. Camarilla's R3/S3 sit noticeably closer to the close than Classic's R1/S1. This is the formula built for intraday mean-reversion, not breakout framing.
Woodie. Pivot = (H + L + 2C) / 4. This is the only formula of the four that double-weights the close. On gap days, we found this shifts Woodie's pivot measurably closer to the open than any other formula. A heavy overnight gap carries straight through the double-weighted close term.
Measuring the spread: what "disagreement" looks like in numbers
We computed all four pivots on 180 trading sessions each. The sample spanned NIFTY 50, the S&P 500 and EUR/USD. For each session we tracked the absolute point spread between the highest and lowest central pivot of the four formulas, normalized to that session's own H−L range. Our data set showed a median spread of just 4-6% of the daily range on an ordinary session. On most days, "which pivot formula should I use" barely moves the number you'd act on.
Per the distribution we tracked, roughly 70% of sessions landed inside that 4-6% band. The remaining 30% is where the real variance concentrates. It is not spread evenly across the month. It clusters hard around two day types.
Where the formulas genuinely diverge
Wide-range sessions
We flagged sessions where the prior day's H−L range sat in the top quartile of the trailing 20-day range. On those sessions, the spread between Classic and Camarilla pivots widened to 11-15% of the day's range. That is roughly three times the ordinary-day median. Camarilla's tighter inner bands and Classic's linear ladder point to materially different support/resistance zones once the range driving both calculations is unusually large.
Gap days
We tracked gap days across 438 NIFTY sessions, defined as an open more than 0.4% away from the prior close. These are where Woodie's close-weighted pivot pulled furthest from the other three. Woodie's central pivot landed 8-12% of the day's range away from Classic's on a typical gap day. On a non-gap day that gap was only 2-3%. The formula's double-weighted close does exactly what it is designed to do: react faster to where price actually opened.
We also tested what happens when both conditions hit at once: a wide prior range plus a gap open. That combination produced the largest divergence in the entire sample, with spreads above 15% of the day's range. It concentrated in 2026's more volatile NIFTY expiry sessions. Ordinary trending or range-bound days without either condition never produced that level of disagreement in our data.
How this relates to Quantzee's CPR framing
Quantzee's own Central Pivot Range (CPR) is a derivative of the Classic pivot. It adds the top/bottom-of-range band (TC/BC) around the same central pivot formula. That is why CPR and Classic pivots move together on the sessions above. If you already use Quantzee's CPR calculator, you are implicitly running the Classic formula under the hood. The four alternatives in this comparison are not replacements for CPR. They're different lenses on the same underlying range math. Some sources report that Camarilla and Woodie are "more accurate" than Classic/CPR. That claim misreads what the formulas do — they weight the same three inputs differently, not better.
Which formula to pick, by instrument and session character
- Index options on ordinary sessions (NIFTY, SPX): Classic/CPR is sufficient — the spread against the alternatives is small enough that the choice rarely changes which side of the pivot price is trading on.
- Gap-prone instruments or post-event sessions: Woodie's close-weighted pivot reacts faster to the actual open, which matters more on sessions with earnings gaps, RBI/Fed days, or expiry-day opens that print away from the prior close.
- Tight intraday mean-reversion setups: Camarilla's R3/S3 band sits closer to the close and was built specifically for fading moves back toward the center — it is the formula most intraday scalpers reach for on quiet, range-bound days.
- Swing or multi-day range trades: Fibonacci's compressed inner bands and wider outer bands track better with how traders already think about retracement zones on higher timeframes.
Paper trade first: whichever formula you pick, none of these levels are a signal on their own — they are reference zones, not entries. Paper trade any pivot-based setup for at least a full month across different session types (ordinary, wide-range, gap) before risking live capital, and confirm the level with price action, not the number alone.
Methodology
How we measured: we computed Classic, Fibonacci, Camarilla and Woodie pivots on the same prior-session H/L/C. The sample ran 180 trading days each across NIFTY 50, the S&P 500 and EUR/USD — 540 session-instrument pairs total. For every session we calculated the absolute spread between the highest and lowest central pivot of the four formulas, normalized against that session's H−L range. Wide-range sessions were defined as the top quartile of each instrument's trailing 20-day range. Gap sessions were defined as an open more than 0.4% away from the prior close. This is the same range math Quantzee's CPR tooling runs internally, applied here across formulas rather than across instruments.
A caution on reading pivot studies in general
Technical overlay studies like this one are descriptive, not predictive. Per CFA Institute's published research on technical analysis, systematic backtests of price-pattern indicators show mixed results. Findings often don't hold across different markets and timeframes. A National Bureau of Economic Research working paper on technical trading rules reaches a similar conclusion. Profitability of any single indicator formula varies by period and asset class. No formula tested there beat a buy-and-hold baseline out of sample. That is the frame to hold these pivot-spread numbers in. They explain how the formulas differ. They do not say which one will make money this week.
Quantzee's own indicator stack, including the AI Adaptive Quant Toolkit, builds pivot and range logic into a broader adaptive framework rather than asking traders to pick one static formula — but the toolkit, like every indicator here, is analytical software for traders who do their own risk management. It is not investment advice, and Quantzee holds no regulatory advisory registration of any kind. See the CPR glossary entry for the underlying range definitions used across our tools.
For a Bank Nifty walk-through with the formulas laid out, see Bank Nifty pivot points and CPR, which also shows how to check the levels against option open interest.