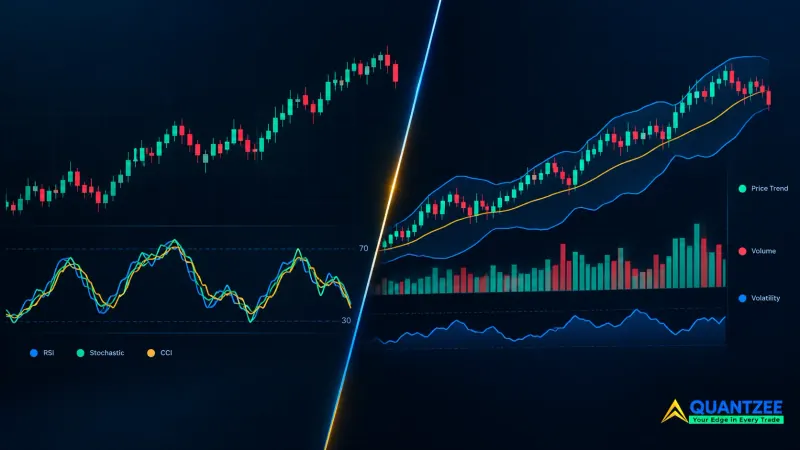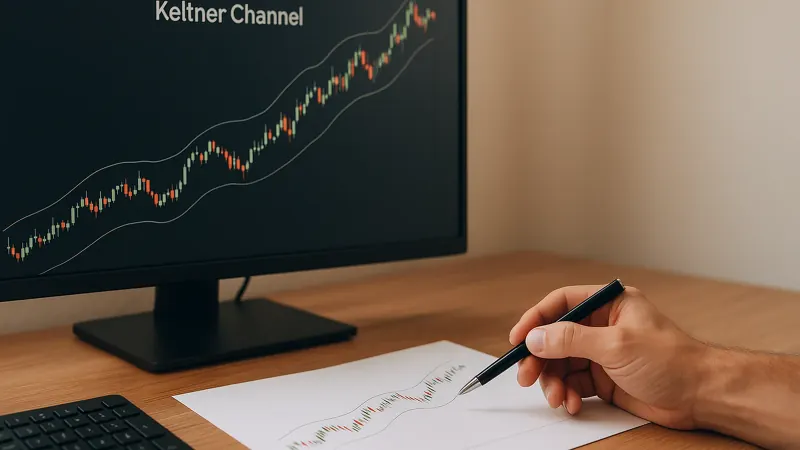
Forex trading is one of the most popular forms of trading and so is the increasing demand of Indicators for Forex Trading in Australia. The AUD/USD is among the most traded currency pairs on the planet, the Australian dollar is deeply tied to global commodity prices, and Australian traders sit right in the middle of the Asian session, one of the most consistent forex trading windows of the entire day.
Yet if you’ve spent any time searching for forex indicator guides online, you’ll have noticed they’re almost all written with European or American traders in mind. They explain what RSI does. They define Bollinger Bands. But they never tell you which indicators work during the Asian session, when most Australians are actually trading. They don’t mention how RBA rate announcements move AUD pairs differently from how Fed decisions move EUR/USD. They don’t explain why a trend-following setup that works perfectly on GBP/USD during the London open will generate constant false signals on AUD/USD at 9am AEST.
This guide closes that gap. We cover every major forex indicator — what it does, how it works, its real limitations, and critically, how to apply it to AUD/USD, AUD/JPY, and GBP/AUD during the sessions Australian traders actually trade in.
⚡ Key Takeaways
- The Australian dollar is a commodity currency — iron ore and gold prices drive AUD trends, making trend-following tools more effective during commodity-driven moves than standard mean-reversion signals.
- The Asian session (9am–1pm AEST) is a ranging environment — use RSI, Bollinger Bands, and ADX as oscillators; the London session (6–9pm AEST) is trending — switch to EMA crossovers and MACD.
- ADX is the essential session filter: below 20 signals a range (use oscillators); above 25 confirms a trend (use trend-following tools) — always check ADX before acting on any EMA or MACD crossover signal.
- RBA announcements can move AUD/USD 50–100 pips in minutes — turn off all indicators for 30 minutes before and after any release; no technical signal is reliable during this window.
- AI-powered indicators that synthesize multi-indicator logic into a single non-repainting buy/sell signal remove the cognitive load of manually monitoring ADX, RSI, Fibonacci, and session context simultaneously across AUD pairs.
What Are Forex Indicators? (And the Basic Framework You Need First)
Forex indicators are mathematical calculations applied to price data that produce visual signals on your chart. They don’t predict the future, they describe what has happened and suggest what might happen based on historical patterns. Understanding this distinction matters, because traders who expect indicators to be predictive get frustrated when they fail. Traders who use them as filters and probability tools get consistent results over time.
Leading Indicators vs Lagging Indicators: The Most Important Distinction
Every indicator is either leading or lagging, and understanding which category yours falls into changes how you use it.
| Type | What it does | Examples |
|---|---|---|
| Leading | Attempts to predict future price movements. Reacts quickly to current price action. More false signals, but catches turns earlier. | RSI, Stochastic, CCI, Parabolic SAR |
| Lagging | Confirms trends already underway using historical data. Slower to react, fewer false signals, but misses the start of moves. | Moving Averages, MACD, ADX, Ichimoku |
The practical takeaway: don’t use two leading indicators together, you’ll get the same signal twice and think it’s twice as confirmed. Don’t use two lagging indicators together for the same reason. The strongest setups combine one leading and one lagging indicator, so each fills the other’s blind spot.
Forex Trading in Australia: What Makes It Different
Every generic indicator guide on the internet is implicitly written for European or American traders. The sessions they assume, the pairs they use as examples, the volatility levels they calibrate for all of it reflects London or New York conditions. For Australian traders, applying these guides directly creates a specific set of problems.
The Australian Dollar Is a Commodity Currency
This is the most important characteristic of AUD pairs that no other guide mentions. The Australian dollar’s value is heavily tied to Australia’s key commodity exports that are particularly iron ore, gold, coal, and LNG. When commodity prices are rising, AUD tends to strengthen. When global risk sentiment turns negative and commodities sell off, AUD often falls faster than other major currencies.
What this means for indicators: During commodity-driven AUD moves, trend-following tools work exceptionally well because the trend has fundamental fuel behind it. Mean-reversion tools including standard RSI overbought/oversold signals can fail repeatedly during these periods because the commodity driver keeps pushing AUD in one direction despite technically ‘overbought’ readings.
The CCI (Commodity Channel Index) was literally designed for commodity markets and is unusually well-suited to AUD pairs for exactly this reason.
The Asian Session: Where Most Australians Forex Traders Trade in 2026
The Asian forex session (with the most active Australian trading hours approximately 9am–1pm AEST) is when AUD/USD, AUD/JPY, and NZD/USD are in their primary trading window. This session has a fundamentally different character from London or New York: lower volatility, tighter ranges, and more frequent reversals at key levels.
The direct consequence: EMA crossovers and MACD trend signals that work cleanly during the trending London session generate constant whipsaws during the ranging Asian session. Australian traders who apply London-session indicator logic to their morning AUD/USD trading are systematically using the wrong tools for their environment.
The RBA: Australia’s Most Powerful Forex Event
The Reserve Bank of Australia sets the official cash rate and releases monetary policy decisions on a regular schedule throughout the year. RBA announcements are among the highest-impact events in Australian forex — capable of moving AUD/USD 50–100 pips within minutes and sometimes establishing directional trends that last days or weeks.
Every indicator becomes unreliable in the 30 minutes before and after an RBA announcement. Bollinger Bands expand as volatility spikes. RSI readings become meaningless as price whipsaws. MACD signals lag badly. The right approach: turn off your indicators around RBA events and trade purely on the news outcome, then wait for price to settle before re-applying technical tools.
The AUD Pairs: Understanding What You’re Trading
Each major AUD pair has its own personality. The indicators that work best on each one differ, not dramatically, but enough to matter. Here’s what every Australian forex trader should understand about their primary pairs before choosing indicator setups.
| Pair | Session | Character | Typical daily range | Primary driver |
|---|---|---|---|---|
| AUD/USD | Asian + NY overlap | Trending when commodities move, range when quiet | 40–80 pips | Iron ore, gold, Fed/RBA rates |
| AUD/JPY | Asian session | Risk-sentiment barometer, volatile | 60–120 pips | Global risk appetite, BOJ policy |
| GBP/AUD | London open | High volatility, wide ranges | 120–200+ pips | BOE vs RBA divergence, UK data |
| EUR/AUD | London open | Slow-trending, large daily range | 80–150 pips | ECB policy, European economic data |
Forex Sessions for Australian Traders: When to Use Which Indicators
This is the section that no generic forex indicator guide ever covers and it’s the most practically useful information for Australian traders. The session you’re trading in determines which indicator approach to apply.
Peak Asian Session (9:00am – 1:00pm AEST): Range-Based Indicators
The Asian session is when most Australian forex traders are most active and it’s the session that most indicator guides implicitly ignore, because they’re written for London or New York traders.
Characteristics: Lower volatility, tighter ranges, more frequent reversals at key levels. Price tends to oscillate within a defined range rather than trending directionally. On AUD/USD during a typical quiet Asian session, you might see a 30–50 pip range across the entire 4-hour window.
Best indicators for this session:
- Bollinger Bands: The upper and lower bands define the session range. Price touching the upper band with RSI overbought is a reliable short signal during Asian ranging. Price at the lower band with RSI oversold is a reliable long signal.
- RSI (14): Works well as an overextension signal in a range. Key levels are 65/35 rather than the standard 70/30 — adjust your settings slightly to reduce the number of false signals during this lower-volatility session.
- ADX: Use ADX to confirm you’re actually in a ranging environment before applying mean-reversion tools. If ADX is below 20, you’re in a range — proceed with Bollinger + RSI. If ADX is above 25 and rising, a trend is developing — switch to trend-following tools.
- Support & Resistance levels: During the Asian session, the most reliable setups come from price reacting at well-defined levels: previous day’s high/low, Asian session open, round numbers (e.g. 0.6500 on AUD/USD). Automated key level tools save significant time here.
Asian session rule: Never apply trend-following EMA crossovers or MACD signals during a quiet Asian session without first checking ADX. A reading below 20 means those tools will generate continuous false signals in both directions.
Peak London Session (6:00pm – 9:00pm AEST): Trend-Following Indicators
The London open brings a significant pickup in volatility and directional momentum across all major pairs — including AUD pairs. This is when breakouts from the Asian session range typically occur, and when sustained trends develop.
Characteristics: Higher volatility, genuine directional momentum, trend-following indicators become reliable. GBP/AUD becomes most active during this window. AUD/USD often breaks its Asian session range in one direction.
Best indicators for this session:
- EMA Crossovers (9/21 or 20/50): EMA crossovers that are meaningless during the Asian session become useful signals during London, when momentum behind the cross tends to follow through.
- MACD: MACD crossovers during London open — particularly when accompanied by expanding histogram bars — are among the most reliable trend-continuation signals available to Australian forex traders who trade in the evening.
- ATR (Average True Range): Use ATR to set appropriately wide stop losses during the high-volatility London open. GBP/AUD can move 100+ pips in a single London session — stops that would be adequate during the Asian session will get swept away here.
- Bollinger Band Breakout: When price breaks cleanly outside the Bollinger Bands during the London open with expanding band width, it often signals the start of a sustained directional move — the opposite of how Bollinger Bands are used in the Asian session.
London session rule: Try to avoid RSI overbought/oversold as reversal signals in a trending London open, RSI can stay ‘overbought’ for extended periods while price continues higher.
Peak New York Session / London-NY Overlap (11:00pm – 1:00am AEST)
For Australian traders willing to trade late, the New York session and especially the London-New York overlap is the highest liquidity period of the entire forex day. This is when USD pairs see the most decisive moves, driven by US economic data.
AUD/USD is particularly active during this window because both AUD (Asian session) and USD (New York session) are trading simultaneously. Trend-following indicators work best here. MACD and EMA crossovers on the 15-minute chart are reliable during high-volume NY session moves.
The Best Forex Indicators for Australian Traders in 2026
Every guide on the internet lists the same indicators. What they don’t do is tell you which ones to use on your specific pairs, during your specific sessions, and why. Here’s the complete breakdown.
1. Moving Averages (SMA and EMA)
A moving average calculates the average price over a defined number of periods, creating a smoothed line on your chart that filters out short-term noise and reveals the underlying trend direction.
SMA (Simple Moving Average): Weights all periods equally. Slower to react, cleaner appearance. Better for identifying the big-picture trend direction.
EMA (Exponential Moving Average): Weights recent periods more heavily. Reacts faster to new price action. Better for intraday trading and generating entry signals.
Key setups for Australian forex traders:
- 9 EMA / 21 EMA crossover: Core intraday setup for 15-minute and 1-hour charts during trending sessions. 9 EMA above 21 EMA = bullish. Below = bearish. Most reliable during the London open on GBP/AUD and EUR/AUD.
- 50 EMA as trend filter: Price above the 50 EMA on the 1-hour chart = long bias only. Below = short bias only. One of the most effective single filters for eliminating counter-trend trades.
- 200 EMA as macro bias: On the 4-hour or daily AUD/USD chart, the 200 EMA tells you the dominant trend direction. This is your weekly directional bias, everything else is noise within it.
Real limitation: Moving averages are lagging indicators. In ranging Asian session conditions, crossovers produce constant whipsaws. Always check ADX before acting on any MA crossover signal.
| Pros | Cons | |
|---|---|---|
| Moving Averages | Clear trend direction, dynamic support/resistance, works on all timeframes | Lagging — misses the start of moves. Whipsaws in ranging markets. Needs confirmation. |
2. MACD (Moving Average Convergence Divergence)
MACD measures the relationship between a 12-period and 26-period EMA, with a 9-period signal line. It combines trend direction and momentum strength in a single indicator, making it one of the most information-dense tools available.
Five ways to read MACD for AUD pair trading:
- Zero line cross: MACD above zero = fast EMA above slow EMA = bullish bias. Below zero = bearish bias. Use as a broad directional filter, not a precise entry.
- Signal line cross: MACD crossing above its signal line = buy signal. Crossing below = sell signal. Most reliable on 1-hour charts during London open trending conditions.
- Histogram expansion: Growing histogram bars = strengthening momentum. Use as confirmation that a trend has real force behind it.
- Histogram contraction: Shrinking bars = weakening momentum. A warning that the trend may be exhausting, tighten stops or consider exiting.
- Divergence: Price makes a new high but MACD histogram doesn’t = bearish divergence. One of the most reliable early warning signals for AUD/USD reversals, particularly useful ahead of RBA meetings.
Best use for Australian traders: London open trend trading on GBP/AUD and EUR/AUD. Strong commodity-driven AUD/USD trends. Avoid as a standalone signal during the quiet Asian session.
| Pros | Cons | |
|---|---|---|
| MACD | Combines trend and momentum, generates clear crossover signals, histogram visually shows momentum changes | Lagging indicator. Less effective in sideways markets. Can produce false signals during choppy Asian session. |
3. RSI (Relative Strength Index)
RSI measures the speed and magnitude of recent price changes on a 0–100 scale. Above 70 traditionally signals overbought; below 30 signals oversold. In practice, experienced traders use RSI in three distinct ways and the one most guides focus on (overbought/oversold) is the least reliable of the three.
- Range reversals (Asian session): RSI reaching 65–70 near the top of AUD/USD’s Asian session range is a reliable short signal. RSI reaching 30–35 near the bottom is a reliable long. This is where RSI earns its keep for Australian morning traders.
- Trend confirmation (London/NY): In a genuine uptrend, RSI consistently stays between 40–80. Readings consistently above 50 confirm trend health. Use this as a filter, not an entry signal.
- Divergence: AUD/JPY making new highs while RSI makes lower highs = bearish divergence. One of the cleanest early warnings for risk-sentiment reversals on this pair.
Real limitation: RSI’s fixed 70/30 thresholds don’t adapt to volatility. During a strong commodity-driven AUD/USD trend, RSI can stay above 70 for days while the trend continues, generating repeated false short signals. In these conditions, don’t fade RSI overbought. Wait for confirmation from MACD or ADX that momentum is genuinely fading.
| Pros | Cons | |
|---|---|---|
| RSI | Identifies overbought/oversold conditions, divergence signals, simple to read | Can stay overbought/oversold for extended periods in trends. Fixed thresholds don’t adapt to volatility. |
4. Bollinger Bands
Bollinger Bands place two standard deviation bands around a 20-period moving average. The bands expand in high volatility and contract in low volatility, making them useful both as a range-trading tool and a breakout signal tool depending on the session.
Range mode — Asian session (most useful for Australian traders):
- Flat bands + price oscillating = range environment
- Price at upper band + RSI above 65 = short toward middle band
- Price at lower band + RSI below 35 = long toward middle band
- Target: 20-period middle band. Stop: just outside the band touched.
Breakout mode — London open:
- Narrow bands (a ‘squeeze’) = low-volatility buildup, breakout imminent
- Price breaks outside bands with bands expanding = start of directional move
- This is how GBP/AUD often behaves after a quiet Asian session squeeze during morning, explosive move at London open
Critical mistake to avoid: Using Bollinger Band range logic during a breakout environment will get you caught fading a strong move. Using breakout logic during a range environment has you chasing false breakouts. Identify the session and market context first.
| Pros | Cons | |
|---|---|---|
| Bollinger Bands | Measures volatility, provides breakout and reversal signals, visually intuitive | Doesn’t indicate direction. Can be misread in transitioning conditions. Requires session context. |
5. ADX (Average Directional Index)
Developed by J. Welles Wilder, ADX measures trend strength on a 0–100 scale without indicating direction. It’s the most underused indicator in Australian retail forex and arguably the most important one for navigating the session-switching nature of AUD trading.
- ADX below 20: Ranging market. Use oscillators and mean-reversion tools. Avoid EMA crossovers and MACD.
- ADX 20–25 rising: Trend developing. Begin transitioning to trend-following tools.
- ADX above 25: Strong trend. EMA crossovers and MACD work reliably. Trail stops rather than using fixed take-profits.
- ADX above 40: Extreme trend strength. Countertrend trades very high risk. Ride the trend until ADX begins falling.
ADX is often used alongside the +DI and -DI lines (directional movement indicators) to add directional context. When +DI crosses above -DI alongside rising ADX, it’s a bullish trend confirmation. The reverse signals a bearish trend, a powerful combination for AUD/USD during strong commodity moves.
| Pros | Cons | |
|---|---|---|
| ADX | Objectively measures trend strength, works as a market condition filter, prevents wrong-tool mistakes | Lagging — reflects past strength. Doesn’t indicate direction on its own. Slow to react to sudden news events. |
6. Stochastic Oscillator
The Stochastic compares a closing price to the high-low range over a specified period, on a 0–100 scale. Above 80 signals overbought; below 20 signals oversold. It’s often compared to RSI because both are momentum oscillators, but they work differently and have different strengths.
The Stochastic reacts faster than RSI to price changes, making it better suited to shorter timeframes and the quick reversals of the Asian session. For Australian scalpers targeting AUD/USD range reversals on 5-minute or 15-minute charts, Stochastic combined with a key support or resistance level provides faster, more precise entry signals than RSI.
For slower-moving markets: The Stochastic’s signal line (a moving average of the main Stochastic line) helps filter out noise. Waiting for both lines to cross below 80 (for shorts) or above 20 (for longs) rather than just touching the extreme levels reduces false signals during choppy conditions.
| Pros | Cons | |
|---|---|---|
| Stochastic | Faster than RSI, includes signal line for filtering, effective in range conditions | More prone to false signals in trending markets. Less useful on longer timeframes. |
7. Fibonacci Retracement
Fibonacci retracement draws horizontal levels at key ratios (23.6%, 38.2%, 50%, 61.8%, 78.6%) between a significant high and low. The theory supported by decades of trader observation is that after a major price move, retracements tend to pause or reverse at these ratios before the original trend resumes.
Why Fibonacci is particularly relevant for AUD pairs:
- After RBA-driven moves: When the RBA unexpectedly hikes or cuts rates and AUD/USD makes a sharp 80–150 pip move in minutes, the 38.2% and 61.8% Fibonacci retracement levels frequently provide the highest-probability entry points for traders who missed the initial move but want to join the new trend.
- After commodity price spikes: When iron ore prices surge and AUD/USD trends higher over several days, Fibonacci levels drawn from the start of the commodity-driven move to its peak identify the pullback zones where the trend is most likely to resume.
- Fibonacci extensions for targets: The 127.2% and 161.8% Fibonacci extensions project where price may run to after a breakout. Useful for setting take-profit levels on GBP/AUD London open breakout trades.
| Pros | Cons | |
|---|---|---|
| Fibonacci | Highlights natural support/resistance, works across all timeframes, excellent with other indicators | Subjective placement can vary between traders. Not all retracements respect Fibonacci levels. Requires confirmation. |
8. Parabolic SAR
Parabolic SAR (Stop and Reverse) plots dots above or below price to indicate trend direction and potential stop loss levels. When dots are below price, the trend is bullish. When above, bearish. As the trend continues, the dots accelerate closer to price, tightening the trailing stop automatically.
Where Parabolic SAR works well for Australian traders: Strong trending conditions, commodity-driven AUD/USD moves, GBP/AUD London open directional sessions, and risk-on AUD/JPY rallies. The automatic trailing stop mechanism is particularly useful for traders who struggle to exit winners, as the SAR does the trailing mechanically.
Where Parabolic SAR fails: Ranging Asian session conditions. In a sideways market, Parabolic SAR flips constantly back and forth, generating a stream of losing stop-and-reverse trades. Only use it when ADX confirms a trend is in play (above 25). Never use Parabolic SAR without checking ADX first.
9. CCI (Commodity Channel Index)
The CCI measures how far price has moved from its statistical average. It was originally designed for commodity markets which makes it unusually well-suited to AUD pairs, since the Australian dollar is fundamentally a commodity currency.
Unlike RSI, CCI has no fixed upper or lower limit. Readings above +100 indicate the asset is trading above its statistical average (strong upward momentum). Readings below -100 indicate the asset is trading below average (strong downward momentum). This unbounded nature makes CCI better than RSI for catching strong commodity-driven AUD trends that push well beyond standard overbought levels.
Quick Reference: Which Indicator for Which Situation
| Indicator | Best session | Best pair | Leading/Lagging | Skill level |
|---|---|---|---|---|
| EMA crossover | London open | GBP/AUD, EUR/AUD | Lagging | Beginner |
| MACD | London / NY | AUD/USD, GBP/AUD | Lagging | Beginner |
| RSI | Asian (range) | AUD/USD | Leading | Beginner |
| Bollinger Bands | Asian (range) / London breakout | AUD/USD, AUD/JPY | Lagging | Beginner |
| ADX | All sessions — filter tool | All AUD pairs | Lagging | Intermediate |
| Stochastic | Asian (scalping) | AUD/USD | Leading | Beginner |
| Fibonacci | Post-RBA / post-data | AUD/USD, GBP/AUD | Neither | Intermediate |
| Parabolic SAR | Trending sessions only | AUD/USD (trending) | Leading | Intermediate |
| CCI | Commodity-driven trends | AUD/USD (especially) | Leading | Intermediate |
Best AI-Powered Trading Indicators for Australian Forex Traders That Are a Better Alternative to Traditional Indicators for Forex Trading in Australia
Every indicator covered above requires you to monitor multiple conditions simultaneously: ADX for context, RSI for timing, Fibonacci for level validation. For experienced traders, this becomes intuitive. For those still developing their eye, or for traders with limited session windows, AI-powered signal tools offer a significant practical advantage.
A well-built AI forex indicator synthesises multiple inputs simultaneously and outputs a single, clear buy or sell signal directly on your chart. The result: you get the benefit of multi-indicator confluence without the cognitive load of manually monitoring five tools at once.
What separates a professional AI signal tool from a poor one:
- Non-repainting: The signal that appears on your live chart stays there after the candle closes. It doesn’t move, disappear, or retroactively change. This is the single most important quality to verify before using any signal tool live.
- Adaptive to market conditions: A good AI tool should be selective. Firing on high-probability setups, not generating signals constantly in low-conviction ranging conditions.
- Session-aware: The best tools adjust their sensitivity based on current volatility, meaning they naturally produce fewer signals during the quiet Asian session and more during trending London conditions.
- Works across all AUD pairs: AUD/USD, AUD/JPY, GBP/AUD etc. The tool should perform consistently across your full suite of trading instruments.
Quantzee’s indicator toolkit delivers all of this on TradingView — an AI trading indicator suite with non-repainting signals that work across all forex pairs and every other market available on the platform. You can learn more about all the available indicators by going through given link: quantzee.com/indicators
Final Thoughts
The best forex indicators for Australian traders are not fundamentally different from those used anywhere else. But how and when you apply them must be built around the actual conditions of AUD pair trading, the commodity currency dynamics of the Australian dollar, the ranging character of the Asian session, the trending character of the London open, and the market-moving impact of the RBA.
Start with just two or three indicators. Master them on one pair in one session. Build from there. And if you want a complete AI-powered toolkit that brings trend, momentum, key levels, and signal confirmation into one non-repainting system, then explore what Quantzee offers at quantzee.com/indicators.
Explore Quantzee Indicators
- AI TrendPulse — trend detection with false breakout filter
- SuperTrend Pro+ — volatility-adjusted signals for forex pairs
View all indicators · See pricing