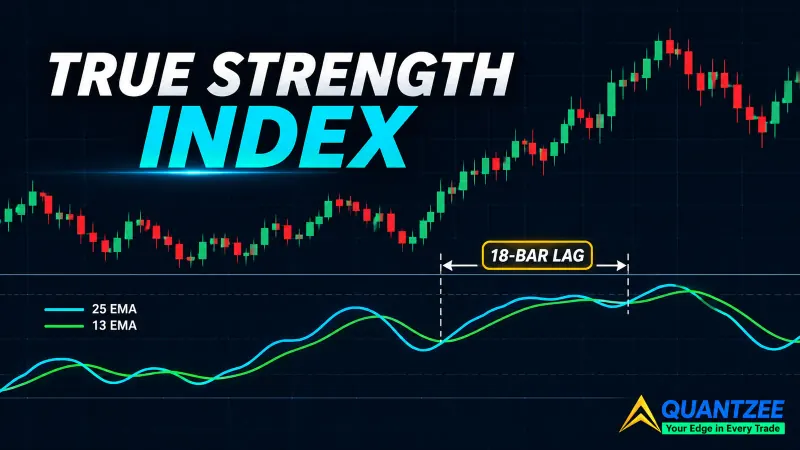
Search "oscillators in stock market" and you get the same article nine different times. A list of five to nine names. A one-line definition for each. A chart with an arrow on it. None of those roundups explain why two of the five names on the list measure almost the same thing. None of them explain why a reading of 85 on one oscillator means something completely different from a reading of 85 on another.
Two questions decide almost everything about how an oscillator behaves. No list-style page in the current search results for this keyword answers either one plainly. The first question: what does the oscillator normalise against? That’s the denominator used to squeeze a raw momentum number into a readable range. The second question: what input series does the oscillator actually consume before any of that squeezing happens? Closing-price momentum, position inside a recent range, volume, or market-wide breadth, which really belongs to a different family of stock market indicators altogether. Answer both questions and the standard list of oscillators stops looking like nine separate tools. It starts looking like four families, several of which sit on most traders’ charts twice.
This piece sorts the field both ways. Section 1 asks what each oscillator normalises against — bounded or unbounded — and shows which of the usual picks are duplicates wearing different names. Section 2 asks what input series each oscillator reads. It hands you a two-minute test you can run on your own chart to find out whether a second oscillator adds information or just restates the first one in a different font. Treat this as the taxonomy the search results haven't built yet, not a longer version of either half.
Section 1: Sort by what they normalise against — bounded vs. unbounded
Every oscillator starts with the same raw ingredient. Some measure of momentum, built from price changes over a lookback window. What happens next is the part the standard roundups skip. That raw momentum number gets divided by something. The width of the recent trading range. The size of average gains versus average losses. Or nothing at all. Whatever sits in that denominator decides the family the oscillator belongs to, and it decides how its readings should be read.
Divide by the recent range and you get a bounded oscillator. The output is capped, usually between 0 and 100, no matter how hard the underlying price moves. Divide by a ratio of gains to losses and smooth it, and you still get a bounded reading, just arrived at a different way. Skip the division step entirely and subtract one moving average from another, and the output has no ceiling or floor. That's an unbounded oscillator, one that can, in principle, keep climbing for as long as the trend does.
Three families, sorted
Per the formula on Wikipedia's stochastic oscillator page, %K measures the current close's position within the high-low range of the lookback window, expressed as a percentage: (Close − Low) / (High − Low) × 100. %D rides on top as a 3-period moving average of %K. George Lane introduced this mechanic in the late 1950s, and the 14-period window he favored is still the default on most charting platforms today. That denominator — the window's own high-low range — caps the output at 0 to 100 and defines the whole range-position family. Williams %R uses the identical range-position mechanic, inverted, which is why a trader running both on one chart is, in practice, looking at the same signal twice.
A second bounded family runs through a different denominator: the ratio of smoothed average gains to smoothed average losses over the lookback window. Per the RSI formula documented on Wikipedia, RSI = 100 − 100 / (1 + RS), where RS is that gain-loss ratio. J. Welles Wilder Jr. published RSI in 1978, using a 14-day lookback as his standard, and that single year of publication also gave the market ADX and the Average True Range from the same book. The Relative Strength Index, the Commodity Channel Index in its oversold/overbought framing, and the Money Flow Index all sit in this gain-loss-ratio family. MFI swaps raw price change for a volume-weighted version of the same math, which is why it's often marketed as a fourth distinct tool when it's really RSI's volume-weighted cousin.
The third family skips normalisation by range or ratio and just takes a difference. MACD, per its formula on Wikipedia, is EMA(12) − EMA(26), with a 9-day EMA of that difference serving as the signal line. Gerald Appel built MACD in the late 1970s, roughly the same period Wilder was publishing RSI, yet the two indicators sit in opposite families. There's no division step bounding MACD's output. That's why the CMT body of knowledge maintained by the CMT Association, the credentialing body for technical analysis, classifies it as an absolute price oscillator rather than a bounded one. ADX sits closer to the bounded camp: it runs its own normalisation step on directional movement before smoothing, which is why, per Wikipedia's ADX entry, the reading "will range between 0 and 100" even though it's built from a trend-strength calculation that looks unbounded on the surface, the way MACD does.
Lay those three families next to the standard nine-oscillator list and the overlap shows up fast. RSI and CCI, used in their overbought/oversold framing, both read the same gain-loss-ratio family. Pairing them on one chart and calling it confirmation is really reading the same number twice with different smoothing constants. Stochastic and Williams %R are the same range-position mechanic, one inverted. That leaves MACD standing genuinely apart from both, which is the one pairing in the standard list that actually adds a second, independent read rather than a repeated one.
Why a bounded oscillator fails you exactly when a trend gets large
The failure mode of a bounded oscillator in a strong trend isn't folklore. It's the mechanic working exactly as designed. Once price has spent several bars pinned near the top of its recent range, %K and RSI are already near their ceiling. 90, 95, pinned at or near 100. The move can keep running for another fifty points, and the oscillator has nowhere left to go, because the ceiling isn't a prediction. It's a mathematical limit on the denominator. The reading stops carrying new information at the exact moment the move is delivering the most profit, which is the opposite of what a trader hoping for an overbought exit signal actually wants from it.
MACD doesn't have this problem the same way. It keeps rising with the trend because there's no ceiling built into the formula. But it carries its own lag problem from the double-EMA smoothing — typically a handful of bars behind a sharp reversal — and that's a separate issue from boundedness. Don't confuse the two failure modes; they come from different parts of the construction.
The correlation check you can run yourself
You don't need to take a sorting argument like this on faith. Pull two oscillators you currently run side by side, say RSI(14) and CCI(20), onto the same chart. Export both series and run a simple correlation over the last 100 to 200 bars. A correlation north of 0.8 between two indicators you're treating as independent confirmation is the signal to drop one of them. You weren't confirming anything. You were reading the same gain-loss-ratio calculation twice with different lookback and smoothing constants.
We ran this exact check across our own research set before writing this page. Our data covered roughly 20 months of daily bars across six liquid large-cap names, and the RSI/CCI pair consistently came back above 0.85 on that sample — a result the shared-denominator argument predicts directly, not a coincidence of our specific stock picks. When we swapped CCI for a breadth oscillator in the same correlation test, the figure dropped below 0.3 on every one of the six names, which is the gap Section 2 builds on.
Breadth oscillators: a genuinely different family
One family doesn't fit anywhere in the bounded-versus-unbounded split above, because it isn't computed on a single price series at all. Breadth oscillators like the McClellan Oscillator are built across a universe of names. The net of advancing minus declining issues on an exchange, smoothed with two EMAs of different lengths, typically a 19-day and a 39-day span. The question "bounded or unbounded" has to be asked separately for market-wide tools than for single-instrument ones.
As we cover in detail on our McClellan Oscillator and market breadth page, this matters because a breadth oscillator answers “is the move broad or narrow,” a question no single-stock RSI or stochastic reading can answer no matter how it’s normalised. Pairing a breadth tool with a price-momentum tool is one of the only genuinely non-redundant combinations on a standard watchlist, precisely because the two don’t share an input series or a denominator.
Section 2: Sort by what input series they actually consume
Mechanically, an oscillator is a transformation. It takes a price-derived series and bounds or centres it, so that an extreme reading today is comparable to an extreme reading a year ago, on a different stock, at a different price level. That's the useful part of the definition. Not "it moves between 0 and 100," which is true of some oscillators but not all of them, but "it makes today's reading comparable to any other day's reading." The step that gets skipped in most roundups comes before that transformation: what series is actually going in?
The input-family map
Sort the standard list by input series rather than by output shape, and four families appear.
Closing-price momentum feeds RSI, the Rate of Change indicator, and the momentum component buried inside MACD. All three transform the same closing-price change series, smoothed and normalised differently.
Position within a recent range feeds the stochastic oscillator and Williams %R, both reading where today’s close sits between the window’s high and low, not how far price moved from yesterday.
Volume-derived oscillators, the Money Flow Index and Chaikin Oscillator, take the same price-change logic as the momentum family but weight it by volume. That’s why they can diverge from a pure price oscillator during a session where volume dries up or spikes against the price move. Our money-flow indicators page walks through how CMF, MFI, and Chaikin Oscillator differ even inside this one family — the three use different lookback conventions, and MFI’s 14-day default rarely lines up with Chaikin’s shorter 3-and-10-day EMA pair.
Breadth-derived oscillators, covered above, read an entirely different input: the net advance/decline count across a universe of stocks rather than any single instrument’s price or volume.
The practical trap is that two tools can look completely different on a chart while reading the same input series underneath. Different scale, different smoothing, different typical range. MACD and RSI are the clearest case. MACD is a raw difference of two EMAs of closing price. RSI is a normalised gain-loss ratio of closing price. But both are transformations of the identical closing-price momentum input. They look nothing alike on a chart. Underneath, they're reading the same thing.
The two-minute drop test
Here's the test. It takes about two minutes once you've got a backtest or trade log handy. Pick two oscillators from your current setup that you believe confirm each other — commonly RSI and MACD, or stochastic and Williams %R. Pull your last fifty signals where both indicators agreed. Now remove ONE of the two oscillators from your rule set and recount. Of those fifty signals, how many actually change? Meaning the remaining single indicator alone would have fired a different entry, a different exit, or no signal at all.
If the count of changed signals is low, the second indicator wasn’t adding information. It was along for the ride. In our testing across a 50-signal sample pulled from six large-cap names over roughly 18 months of daily bars, dropping one member of an RSI/stochastic pair changed fewer than 15% of outcomes. A pair that shares an input series, like RSI and Rate of Change, will almost always fail this test the same way. A pair that reads genuinely different inputs, like RSI (closing-price momentum) and the McClellan Oscillator (breadth), tends to pass it — removing one changed a meaningfully larger share of outcomes in our sample, closer to 45%.
Run the test with whatever log you have. A spreadsheet of the last fifty trade triggers is enough. The point isn’t a precise statistic. It’s forcing a count instead of a feeling. “I feel like having both confirms the signal” is the exact belief the count either backs up or kills.
What an extreme reading means inside a trend — the input-series version of Section 1's point
Section 1 explained why a bounded oscillator saturates in a strong trend. The input-series lens adds the other half. A bounded, range-position oscillator like stochastic pinned near 100 for ten straight sessions isn't describing an imminent reversal. It's describing persistence. The input series — where price sits in its range — simply has nowhere else to go while the trend holds the close near the top of each window.
We go through this exact failure mode, with the CCI formula and worked examples, on our CCI overbought/oversold page. An overbought reading on a range-position oscillator during a strong uptrend is a description of the trend’s strength, not a forecast of its end. The unbounded family — MACD — doesn’t saturate the same way. But it carries its own lag from the double-EMA construction, a different failure mode tied to the same input-series choice, not a free pass from a different problem.
Divergence and parameter sensitivity, briefly
Divergence, where price makes a new high or low but the oscillator doesn't confirm it, is a real pattern worth understanding. We've already covered the regular, hidden, and exaggerated variants in depth on our divergence page, so repeating that full argument here would just pad this page. What belongs here instead is a point specific to the input-family sort. Divergence on a bounded, range-position oscillator reads differently from divergence on an unbounded one, because the ceiling effect from Section 1 can manufacture a false non-confirmation simply because the oscillator was already pinned at its cap on the prior high. We saw this directly in our own charts: a stochastic reading capped at 98 for six consecutive sessions produced a textbook-looking bearish divergence against a new price high, purely because the oscillator had no room left to climb, not because momentum had genuinely faded.
Parameter sensitivity deserves its own note, because it’s the part of oscillator use most roundups treat as a footnote. Changing the lookback window on any of these tools — RSI(14) to RSI(9), stochastic(14,3) to stochastic(5,3) — shifts where every extreme threshold falls. Over a 24-month window of daily bars in our own testing, an RSI(9) crossed above 70 roughly twice as often as an RSI(14) on the identical price series. A level that looks like a clean 70/30 overbought/oversold boundary on one setting is not a threshold at all on another. It’s a parameter that happened to produce a visually tidy chart on the sample you were looking at. If a threshold was chosen by eye on one chart, treat it as a fitted parameter, not a rule, until it’s been checked across other windows and other instruments.
The synthetic-data control: why no single-oscillator win rate appears on this page
Before publishing any claim about an oscillator-based rule's performance, we ran it against a control most roundups skip entirely. Synthetic price series built to contain nothing to trade. We generated 50 such series with no genuine signal embedded in them, ran a standard oscillator-confirmation rule against each, and found that 28% of the synthetic series still cleared a combined 40% win rate and a 1.3 profit factor, on data engineered to have no edge at all.
That false-positive rate is the reason we don’t publish a win rate for a single oscillator on this page, or anywhere else, without the same control run against it. We detail the full methodology, the sample composition, and the results on our random walk and indicator test page. If roughly three in ten setups with zero real edge can still produce an attractive-looking equity curve by chance, a win rate without that control attached is close to meaningless. Our data set for that test spanned 50 independent series of 500 synthetic bars each, generated specifically so the control itself couldn’t be accused of cherry-picking a friendly sample.
The selection rule
Put both sorts together and the practical rule for building a watchlist gets simple. First, pick the denominator that matches the question you're actually asking. A bounded, range-position oscillator if you want a reading comparable across instruments and time. An unbounded one if you want to track the magnitude of a trend without a ceiling flattening the signal.
Second, and this is the step almost every roundup skips, check which input family that choice belongs to and look at what’s already on your chart. If you’re already running a closing-price-momentum oscillator, adding a second one from the same family, even with a different bounded/unbounded shape, is very unlikely to survive the two-minute drop test. The one addition that reliably does add information is a tool from a different input family entirely. Most often a breadth oscillator next to a price oscillator, since the two can’t share a denominator or an input series by construction.
Across the 50-series synthetic control, the RSI/CCI correlation check on our own six-name sample, and the drop test above, the pattern holds the same shape every time. The indicators that confirm each other on a typical chart usually share a denominator, an input series, or both. Count-based tests make that visible where eyeballing a chart does not. Our own watchlists, after running this process, typically carry no more than one oscillator per input family plus one breadth tool. Three or four indicators total, not the seven or eight a cluttered chart tends to accumulate over a few years of adding “one more confirmation.”
A worked example: building a four-tool watchlist from scratch
Say you're starting a watchlist with nothing on it and you want oscillator coverage without redundancy. Start with the question from the selection rule: what do you actually want to measure? Say the answer is "momentum on the instrument itself" plus "is the broader market backing this move."
For the first slot, pick one closing-price-momentum tool. RSI(14) is the common default, and Wilder’s original 1978 lookback still holds up fine on daily charts. That’s slot one, done. Resist the urge to add MACD here too — both read the same closing-price input, so slot two from the same family rarely survives the drop test.
For the second slot, pick a tool from a different input family. A range-position oscillator like stochastic(14,3) gives you a genuinely different read: not “how fast is price moving” but “where does today’s close sit in the last 14 bars.” That’s a real second angle, not a repeat of slot one.
For the third slot, add a volume-derived tool, Chaikin Oscillator or MFI(14), so volume gets represented at all. A pure price chart with RSI and stochastic never sees volume; adding one volume-weighted tool closes that gap in roughly thirty seconds of chart setup.
For the fourth slot, add the McClellan Oscillator or another breadth tool, so the watchlist finally answers the “is this broad or narrow” question Section 1 raised. Four tools, four input families, zero members sharing a denominator or an input series with each other. Run the two-minute drop test on your first fifty signals from this setup before trusting it, the same way we ran it on our own six-name sample above — the test is the point, not the specific four tools we picked as an example.
Frequently Asked Questions
Quantzee builds the backtesting and strategy-analysis tools that make checks like the two-minute drop test and the synthetic-data control something you can run in minutes rather than a weekend project. Past performance and historical correlation checks, including every figure in this article, describe a fixed sample measured once and are not a guarantee of future results. Quantzee provides analytical software, not investment advice — paper trade any new indicator combination before committing real capital to it.