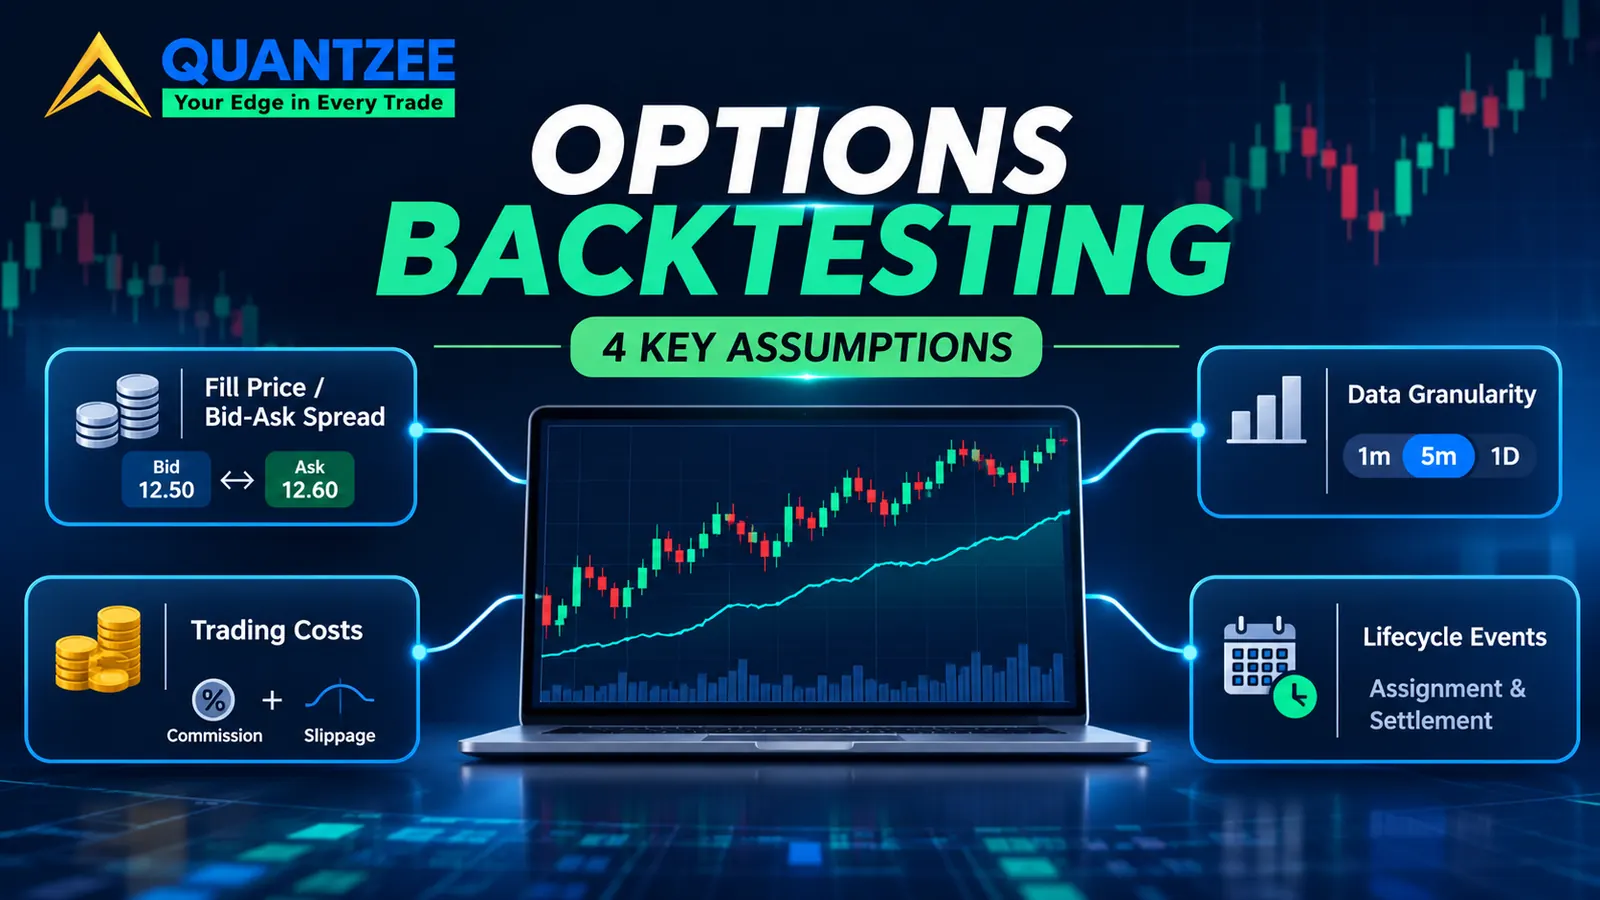
Options backtesting has a quiet problem. Four settings decide most of the answer before any historical price gets read: the fill price, the data granularity, the cost model and the lifecycle events. Get one of them wrong and a short-premium strategy can look profitable on a chart and lose money in an account, without a single price in the dataset changing, and currency pairs add four costs that exist only in FX on top. This post goes through each assumption, gives you the question that exposes it, and shows what our own option-selling test measured when we ran it honestly.
Short version: if a backtester won't tell you how it fills an option order, you can't trust its equity curve. It doesn't matter how long the history is or how nice the report looks.
Why options backtesting breaks in places a stock backtest doesn't
A stock backtest has one price per bar and a spread that is usually a cent or two. An options backtest has a whole chain. Each date carries dozens of strikes across several expirations, and each contract has its own bid, its own ask, its own volume and its own open interest. Every one of those can be missing, stale or thin on the day you test.
That's why the general rules in our guide on how to backtest a TradingView indicator are necessary but not enough here. Splitting your data, freezing the rules and counting your tests all still apply. But options add a layer underneath: the engine has to invent a trade price for a contract that may never have traded at that price. We've already covered the general version in the five assumptions behind any backtesting software. This piece stays narrow and goes deep on what is specific to options.
We read the page-one results for this keyword before writing. Most are product pages and tool listicles. The two real method guides do mention costs. Neither puts a number on what the bid-ask spread does to a short-premium result, and none of them checks whether a strike was tradeable on the date. That gap is where the four assumptions live.
Assumption one: the fill price (mid, bid or ask)
Every short option trade has two fills, the open and the close. If your engine fills both at the midpoint, it quietly assumes you got paid half the spread on the way in and half on the way out. In real trading, a seller who needs a fill usually gets something closer to the bid when opening and the ask when closing. So the spread gets paid twice per round trip.
Here's a simple illustration with made-up but typical numbers. Say a put quotes $1.10 bid and $1.30 ask, so the mid is $1.20. A mid-fill engine books a $1.20 credit. Suppose the option later decays to a $0.40 bid and $0.50 ask, with a mid of $0.45. The engine buys it back at $0.45 and records a $0.75 profit per share, or $75 per contract on a 100-share multiplier.
Now fill at the quoted prices. You sell at $1.10 and buy back at $0.50. That's $0.60 per share, or $60 per contract. The spread alone took 20% of the trade's profit, and nothing about the market changed. On a strategy that wins small and often, that 20% is frequently the whole edge.
The vendor pages handle this lightly. According to the OptionsPilot method guide, its engine uses mid-price fills, and it adds one sentence warning that "you won't always get filled at the mid." Option Alpha's backtester page offers slippage as a setting but, as of our re-read in November 2026, doesn't state a default or say whether the base fill is the mid or the quote. Neither is a scandal. But neither tells you the number you actually need.
The question to send: "On open and close, does your engine fill at mid, at the quoted bid and ask, or at mid plus a slippage amount? If slippage, what is the default, and is it per contract or a share of the spread?"
Assumption two: data granularity
Many options datasets are end-of-day snapshots, taken once a day near the close. That's fine for a strategy that only acts at the close. It breaks the moment your rules depend on anything that happens during the session.
Think about a stop at 2x the credit received. With end-of-day data, the engine only sees one price per day. If the option traded through your stop at 11:00 and came back by 15:30, the backtest never sees the breach. The trade survives on paper and dies in real life. Rolls work the same way. A rule like "roll when the short strike is touched" needs to know when the touch happened, and a daily snapshot can't tell you that.
Intraday data fixes some of this but brings its own catch. One-minute bars are only as good as the quotes inside them. Option Alpha's product page says it runs on 1-minute historical options data rather than end-of-day data, which is the right direction for intraday rules. It's still worth asking what "1-minute" means for a deep out-of-the-money contract that might go 20 minutes without a quote update.
The question to send: "Is your chain data end-of-day or intraday? If intraday, is it trades, quotes or derived bars, and how do you handle a minute with no fresh quote on a given strike?"
Assumption three: the cost model
Commissions, exchange fees, regulatory fees and slippage often get rolled into one number in a settings box. That's convenient. It also hides how big the total really is next to the edge you're testing.
The OptionsPilot guide gives a useful example: a strategy making $5 per trade before costs, against $1.30 in round-trip commission and $0.50 in slippage. That's $1.80 of friction, or 36% of a $5 gross. The example is good. It just stops before the hard part, which is that short-premium structures often have small average wins and a few large losses. Friction comes off every trade, winners and losers alike.
Our data says the same thing. In one phase of our own signal-driven option-selling research, we measured costs at roughly a quarter of the mean gross loss per structure. The exact ratio was about 26%: around 100 units of cost against a mean gross loss of 384 units per structure. In that same phase, 58% of legs hit their stop. That cost share is large enough to flip a verdict on its own. A structure that looks marginal before costs is often clearly negative after them. The point isn't the exact figure. It's that the cost model is a first-order input, not a footnote you add at the end.
If you want the mechanics of how slippage enters a fill, our slippage glossary entry covers it in more detail than this post needs.
The question to send: "Break your default cost model into commission, exchange and regulatory fees, and slippage. Show each per contract per side, and tell me which ones are switched on by default."
Assumption four: lifecycle events
Stocks don't get assigned. Options do. A backtest that ignores the contract's lifecycle will report a P&L that never existed.
Early assignment. Most US equity options are American-style. Per the SEC's Investor.gov glossary, an American-style option can be exercised at any time up to expiration. A short in-the-money put can be assigned early, and you end up holding shares you never planned to hold, often over a weekend. If the engine always holds the short leg to expiry, it never records that.
Dividend risk on short calls. When a stock is about to go ex-dividend, a holder of an in-the-money call may exercise early to capture the dividend. A short call or a call spread can then be assigned the day before ex-date. If the engine ignores dividends, it books a full spread profit that a real account might not have kept.
Settlement at expiry. Many index options are cash-settled and European-style. Equity and ETF options are physically settled. An engine that cash-settles everything at the close will miss the overnight gap risk of holding stock that came from an assignment. That gap can be bigger than the premium you collected.
The Investor.gov definition of assignment and FINRA's investor overview of options both explain these mechanics in plain terms. They're worth reading before you trust an engine that never mentions them.
The question to send: "Does your engine model early assignment on American-style contracts, ex-dividend exercise on short calls, and the difference between cash and physical settlement? If not, which of these does it simply ignore?"
Chain liquidity: the assumption behind the assumptions
All four assumptions above rest on one more: that the strike you traded in the backtest could actually be traded on that date. Historical datasets often carry a theoretical or last price for every listed strike. A price in the field doesn't mean anyone was quoting it in size.
The check is simple. Look at contract volume and open interest on the trade date, not the price column. A strike with 0 volume and open interest in the low double digits is a strike where your fill is fiction, whatever the engine prints. Exchange statistics give useful context here. Data from Cboe's options market statistics shows how volume concentrates in a small part of the market. Most activity sits in index products and the most active names, near the money and in the nearest expirations. Far strikes and far dates are much thinner.
A practical rule we use: filter the chain before the strategy picks a strike. Set a minimum daily volume and a minimum open interest per contract, and a maximum spread as a share of the mid. Then let the rules choose only from what's left. It's cruder than modelling the full order book, and it's far more honest than trusting a price field. It also exposes strategies that only "work" because they keep picking strikes nobody traded.
Why an out-of-sample split doesn't rescue a bad fill model
One of the method guides on page one recommends splitting data into in-sample and out-of-sample periods. That's correct advice and you should do it. But it solves a different problem.
An out-of-sample split protects you from overfitting, meaning you tuned the rules to noise in one period. It does nothing about a bias that sits in both periods. If the engine fills at mid in 2023, it also fills at mid in 2024. The out-of-sample half inherits the same flattering assumption, so it "confirms" the in-sample result. Two halves with the same error agree with each other perfectly. That agreement tells you nothing about the error.
The fix comes in a different order. Settle the four assumptions first. Then split, then stress. Our stress-testing checklist covers what to do once the fill and cost model are honest: widen costs, shift entries, drop the strongest days and see what's left.
What our own options backtest showed, and what it didn't
We tested a short option-selling structure driven by a technical signal. The setup was a signal-triggered short strangle on index options, with an iron condor version as a second arm. The window was 438 trading days, from January 2025 to October 2026. The gate was frozen before the run and never loosened. The full write-up, with every figure, is in the backtest we published because it lost money.
The headline result is currency-free on purpose. The strangle lost money at zero trading costs across the window. The defined-risk iron condor lost about 2.6 times more per day than the strangle, also at zero cost. A bounded sweep of 18 structure variants, covering strike distance, wing width and stop size over 40 trading days, passed 0 of 18.
A loss at zero friction is a structural fact. No cost model can rescue it, because no non-negative cost turns a negative into a positive. That's why we always run the zero-cost case first. It tells you in one pass whether you're arguing about an edge or arguing about whether costs happen to be small enough.
Here's what the result does not say. It doesn't say option selling loses money. It doesn't say the index we tested is hard to trade. It measured one signal, wrapped in two structures, over one 438-day window. It answers one question: did this signal, sold this way, clear our gate? The answer was no. Reading it as a verdict on option selling in general would be wrong, and we don't. The useful lesson for this post is about method. The signal correlated 0.4610 with the underlying's later move, which is real information. It correlated only 0.0844 with the premium pain the short structure actually took, because a short option also loses to implied volatility changes and to the timing of decay. A backtest that checks direction alone would have missed this completely.
Four questions to send any options backtesting software vendor
These are written so you can paste them into an email or a support chat as they are. A vendor that answers all four clearly has done the work. One that dodges them is telling you something too.
- Fills: On both open and close, do you fill at mid, at the quoted bid and ask, or at mid plus slippage? What is the default slippage, and in what unit?
- Granularity: Is the chain data end-of-day or intraday? If intraday, is it quotes, trades or built bars, and what happens to a stop when a strike has no fresh quote in a given minute?
- Costs: List the default commission, exchange and regulatory fees, and slippage per contract per side, and which are on by default.
- Lifecycle and liquidity: Do you model early assignment, ex-dividend exercise on short calls, and cash versus physical settlement? Can I filter strikes by volume, open interest and spread width on the trade date before the strategy selects them?
When we compared vendor pages against this list for this post, none of the three we reviewed answered all four on the page itself. That doesn't make the tools bad. It means the answers live in support docs, settings and fine print, and you need to go and get them before you trust a curve.
For the vocabulary behind these questions, our backtesting glossary entry covers the general terms. If you're building your own engine rather than renting one, the vectorbt entry explains the vectorised approach we used for the sweep above. Quantzee builds analytical tools for testing ideas like these. It's software for research, not advice, and nothing here is a recommendation to trade any strategy.