Search for a liquidity indicator on TradingView and you get a wall of scripts, each with a tidy rectangle on a tidy chart. Every screenshot looks convincing. That's the problem. A zone drawn on a finished chart always looks like it was waiting for price, because by the time you see it, price has already shown you what happened next.
So the useful question isn't "which script is best." It's "what did this zone look like on the bar where it first appeared, and would I have been able to act on it?" This post gives you four checks that answer that, then applies them to two real listings using only what their authors published about them. It isn't a ranked list, and nothing here is a hit rate. No popular liquidity script publishes one, and we won't invent one.
Key Takeaways
- A liquidity script sees swing extremes, wick rejections and relative volume. It can't see resting orders, because that data isn't in the chart feed.
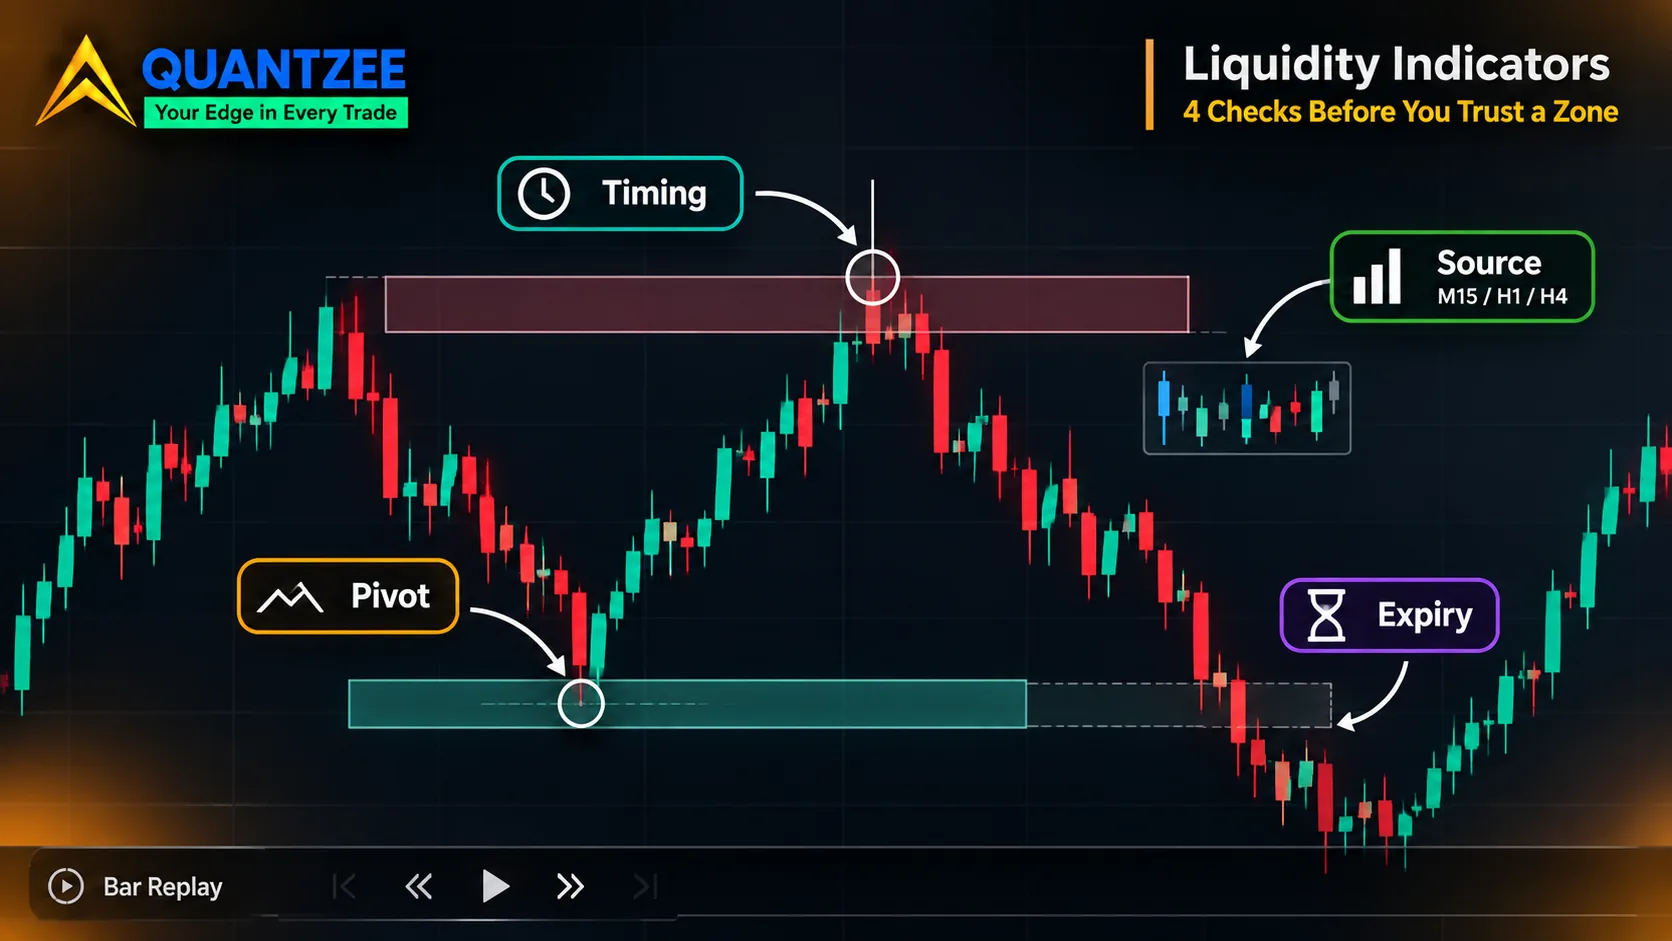
- Check one is commitment timing: does the zone exist on the bar that formed it, or is it attached later once a following bar confirms it?
- Checks two to four cover the pivot rule, the source series, and what happens to a zone after price touches it.
- A 0-10 zone score is a weighting choice, not a probability. Popularity counts measure attention, not accuracy.
What a liquidity indicator can and can't see
The word "liquidity" in an indicator name promises more than the chart can deliver. Real resting liquidity means stop orders and pending orders sitting at price levels. Per the explanation on Investor.gov's stop order entry, a stop order becomes a market order once its trigger price trades. Nothing in an OHLC bar tells you how many of those orders exist or where.
What a script actually works from is the price and volume series. That means three things: swing highs and lows, where the market has turned before; wick rejections, where price poked past a level and snapped back; and unusual relative volume. From those it infers where stops probably sit. The inference is reasonable. It's still an inference, and every zone you see is a guess about order flow dressed up as a measurement.
If you're new to the concept itself, our pages on buy-side versus sell-side liquidity and the four-bar sequence of a liquidity sweep cover what the zones are meant to represent. Here we care about something narrower: whether the drawing tool is honest about when it knew what it knows.
Check one: commitment timing
This is the check that matters most, and the one the product pages skip. When does the script commit to a zone? There are two broad behaviours.
In the first, the zone appears on the bar that formed it, or at the first bar where its rule can be evaluated using only data available at that close. In the second, the script waits for a later bar to confirm the idea and then places the label or box back on an earlier bar. On a live chart that second kind is invisible until the confirming bar prints, but on the history it sits neatly on the exact candle that mattered. Scroll back and it looks prescient. It wasn't.
Data from the LuxAlgo roundup of seven liquidity zone indicators (dated 19 March 2025, around 2,800 words) raises this exactly once. It warns that a level drawn back to an earlier turning point shouldn't be treated as available before the later structure developed. That's the right warning. The roundup doesn't then apply it to the other six tools, and it says plainly that it isn't a measured performance ranking.
How to test it yourself takes about ten minutes. Load the script, open Bar Replay, and step forward one bar at a time across at least 50 candles. Each time a new zone or label appears, note which bar it appears on and which bar it is attached to. If those are the same bar, the script commits at the close. If the label shows up two or three bars after the candle it marks, that's retroactive placement. Our guide on testing any TradingView indicator for repainting walks through the replay routine in more detail, including the reload comparison and the alert-mode check.
One caution. Replay isn't a perfect lens, because some higher-timeframe requests behave differently under replay than live. Treat a replay result as a strong hint, then confirm on a live chart with the script running through a few closes.
Check two: the pivot rule
Almost every zone starts from a swing point, and a swing point needs a definition. The usual one is "a high with N lower highs on each side." That number N, the bars on the left and right, quietly sets two things.
First, it sets lateness. With 5 bars on the right, a swing high can't be confirmed until 5 bars after it printed. On a 15-minute chart that's 75 minutes. Every zone built on that pivot was knowable only after that delay, whatever bar it was drawn on. Second, it sets how many zones exist at once. A pivot length of 2 floods the chart with levels, and a length of 10 leaves a handful. More zones means more chances that price touches one by accident, which flatters any "it respected the zone" story.
Ask of any script: what is the pivot length, can I change it, and does the zone get drawn at the pivot bar or at the confirmation bar? A script that hides the number behind a "sensitivity" slider is making this choice for you. Move the slider and watch the zone count. If it jumps from 4 to 30, the zones were never a property of the market. They were a property of the setting.
Check three: the source series
Some scripts compute zones from the chart's own timeframe. Others pull a fixed higher timeframe, such as the daily or four-hour series, and project it onto whatever chart you have open. That's useful, and it brings a trap with it.
While the higher-timeframe bar is still forming, its high, low and close are provisional. A zone derived from that bar's current extreme can move, or vanish, until the bar closes. On a 5-minute chart looking at a daily source, you may watch a "daily liquidity zone" shift for hours. After the daily close the history looks stable, so the historical chart gives no hint that it moved while you were watching. Pine Script's own documentation on repainting describes how data requested from other timeframes can differ between historical and realtime bars, and that's the mechanism at work.
There's also a chart-type trap that is easy to miss. Zones drawn on synthetic bar types such as Heikin Ashi, Renko or Range bars sit at prices computed from averages or fixed brick sizes. Those prices may never have traded. A "liquidity zone" at a level where no order could have rested is a drawing about the drawing. Run these scripts on standard candlesticks unless the author explicitly says otherwise.
Check four: expiry and housekeeping
What happens to a zone after price touches it, or trades straight through it? Some scripts remove it. Some grey it out. Some leave it on the chart indefinitely.
The leave-it-forever approach does the most damage to your judgment. Over months the chart fills with old rectangles, and price will eventually reach one of them, because price eventually reaches most levels. Each of those touches reads like confirmation. The ones price sliced through cleanly are buried under the clutter or scrolled off screen. You end up remembering the hits and forgetting the misses, and the script gets credit for accuracy it never earned.
A fair script has a stated lifecycle: a zone is created under rule X, marked as touched under rule Y, and retired under rule Z. If you can't find those three rules in the description, you can't judge how often the zones "worked." Then look at the history for a handful of retired zones and count how many were breached outright versus held. You're not computing an edge. You're checking whether the script even lets you see the failures.
Two real listings, read against the checks
Here's the audit applied to two scripts, using only what each author wrote on the listing. We haven't run either one through a replay session for this post, so there's no claim below about how they behave on your chart. This is a read of their stated rules, and where a listing is silent we say it's silent.
Liquidity Zones [Zen]
The Liquidity Zones [Zen] listing describes marking the two liquidity pools bounding the current move and flagging a grab only after price has proven the reversal, "never on the touch." It's a protected-source script, but the author states the rules precisely: a sweep requires an excursion beyond the zone edge by a minimum fraction of average range, a close back inside, and then displacement confirmation inside a window. Equal levels are collapsed on a tolerance.
On check one, the listing is unusually direct. It discloses that labels are placed retroactively on the sweeping bar and never move once closed. That is the honest version of the second behaviour described earlier. You know the label will land on an earlier candle after confirmation, so you know not to read it as a live signal. On check two the listing gives tolerance and window rules but, from what the description publishes, leaves the reader to look inside the settings panel for exact pivot values. On expiry, the description frames the output as the pools bounding the current move, which implies old ones get replaced, but check the lifecycle yourself before relying on that. It publishes no performance data.
Strong Liquidity Zones
The Strong Liquidity Zones listing is open source and, per the page at the time we read it, carries roughly 1.6K boosts and about 19,000 views. It detects three independent footprints, swing pivots, wick-rejection traps and volume spikes, merges overlapping detections into clusters, and scores each cluster from 0 to 10 on confluence, diversity, strength and recency. Its description says zones are created only on confirmed bars and won't flicker.
Notice what that does and doesn't address. "Only on confirmed bars" speaks to flicker within the current bar, which is a real benefit. It doesn't say whether a zone is attached to the pivot bar or to the later bar that confirmed it, and the listing makes no formal statement on repainting. Because the code is open, you can read it and find out. That's the advantage of open source here: check one becomes a code-reading exercise rather than a guess. No hit rate is published.
The scoring question: a 0-10 score isn't a probability
That 0-10 score is worth a pause, because numbers carry authority they haven't earned. A score built from confluence, diversity, strength and recency is a weighted sum. Someone chose the weights. Someone chose that recency counts, and by how much. Change the weights and the ranking changes, with no new information about the market.
A probability says "out of 100 similar zones, about N held." A score says "this zone ranks above that one under my formula." The first needs a counted sample and a definition of "held." The second needs neither. If a script doesn't tell you what a score of 8 historically meant for outcomes, an 8 is a ranking and nothing more. Using it to choose between two zones on one chart is reasonable. Reading it as "80% likely to hold" is not.
It's also why popularity is a poor proxy. Boosts and views, like the 1.6K and 19,000 above, tell you how many people noticed a script. They say nothing about how often its zones worked. Publishing an honest hit rate would take a fixed definition of a hold, a fixed instrument and period, zones recorded at the moment they were committed instead of as they look on history, and a count of every zone including the failures. The MQL5 article on building a zone-flip detector (roughly 6,500 words) gets part of the way. It states exact numeric rules and uses the prior completed bar to avoid look-ahead, then reports no counts, no accuracy and no false-flip rate from six months on one pair.
A short worked audit you can run in 15 minutes
Pick any liquidity script and one zone it drew in the past few weeks. Then do this, with a notepad open.
- Note the zone's price range and the bar it appears to start on.
- Open Bar Replay and rewind to 20 bars before that bar. Step forward one candle at a time.
- Record the exact bar on which the zone first appears on screen. Is it the same as the bar it's attached to?
- Write down what you knew at that moment: the last close, the nearest swing, where price sat relative to the zone, and whether the pivot rule had finished confirming.
- Keep stepping until price touches the zone. Record whether the script marks the touch, and what it does to the zone afterward.
- Repeat for 5 more zones, including at least 2 that price broke through.
When you finish, you'll have a one-page answer to the questions that matter: how many of the 6 zones were visible before the move, how many only after, and whether the script let you see the failures. That small sample proves nothing statistical. It does tell you whether the tool is designed to be used live. Our own rule set for marking and grading order blocks uses the same principle: write the rule down first, so two people reading the same chart reach the same zones.
Where this leaves a toolkit like ours
We'd rather be plain about this. The same four checks apply to our own indicators. If you're comparing options, the SMC Toolkit Pro page is the place to read how structure and liquidity are handled, and you should run it through the replay routine above like anything else. Our guide to affordable TradingView indicators covers how we think about comparing paid tools in general. Quantzee builds analytical software for chart reading. It isn't investment advice, and nothing here predicts what any zone will do next. Paper trade a script on your own instrument before you size anything off its zones.
The simplest rule to leave with: a zone is only as useful as the information available on the bar where it first appeared.