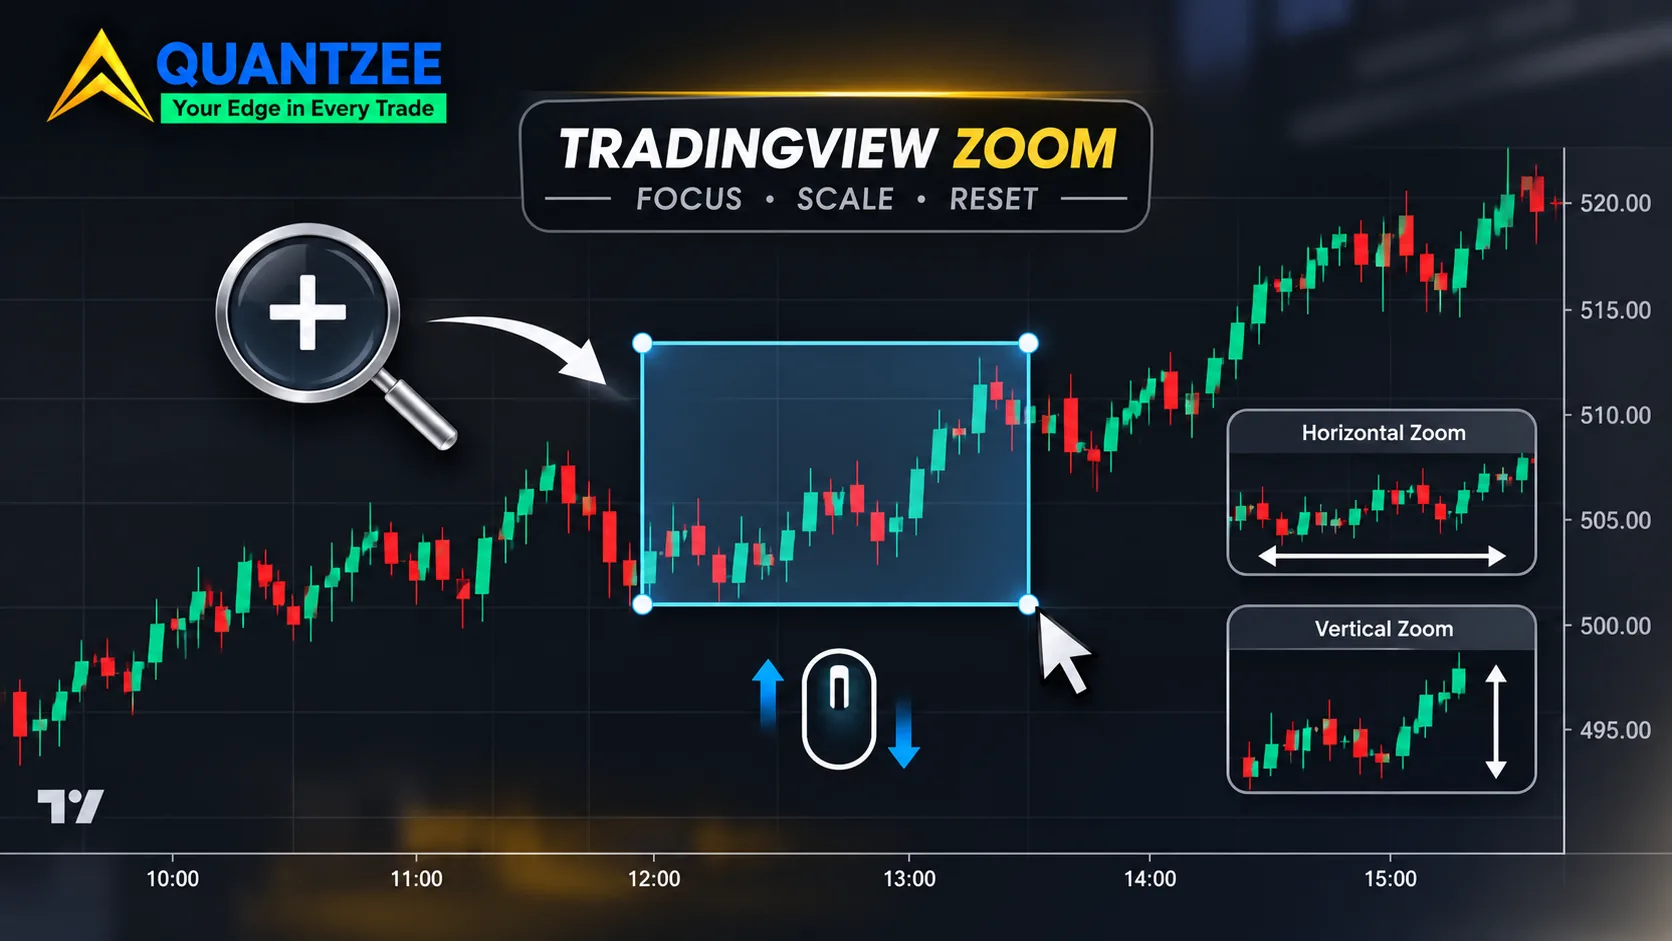
To zoom in on TradingView, scroll the mouse wheel over the chart, hold Ctrl (Cmd on a Mac) and scroll to zoom into a focused area, press Ctrl and the up arrow, or drag either axis. That's the whole "how". The part nobody covers is the cost: how to zoom in on TradingView is a two-minute question, but the zoom level you land on quietly changes what your chart appears to say.
This guide gives you the full control set first, because you came for it. Then it covers the three reasons a chart feels stuck, the difference between zooming and stretching an axis, and a short routine that makes a zoom level repeatable. If you've ever re-opened a chart tomorrow and found yesterday's trend line looked wrong, the routine is for you.
Key Takeaways
- Zooming has six input methods. The wheel, Ctrl or Cmd plus wheel, keyboard arrows, the toolbar magnifier, axis dragging and the mobile pinch all do slightly different things.
- Dragging the price axis stretches the chart's aspect ratio. It doesn't change how much history you can see.
- The number of bars in view and the price-to-bar ratio decide how steep every trend line looks. Neither is saved with your analysis unless you write it down.
- Zoom never changes an indicator value. A moving average or oscillator is computed from the data series, not from the pixels.
Every way to zoom in on TradingView, in one table
We compared the keys below against TradingView's own published shortcut list rather than copying another blog's table, because key bindings differ between products. Per the TradingView Advanced Charts shortcut documentation, the library lists the following, and on macOS you can use the Cmd, Option and Shift keys in place of Ctrl, Alt and Shift. That page documents the charting library, not every surface of the consumer app, so if a key does nothing on your setup, check the shortcut dialog inside the app itself.
| Action | Windows / Linux | Mac | What it does |
|---|---|---|---|
| Zoom in (keyboard) | Ctrl + Up arrow | Cmd + Up arrow | Shows fewer bars, anchored to the right edge |
| Zoom out (keyboard) | Ctrl + Down arrow | Cmd + Down arrow | Shows more bars |
| Zoom into a focused area | Ctrl + mouse wheel | Cmd + mouse wheel | Zooms around the cursor position |
| Pan left or right | Shift + mouse wheel | Shift + mouse wheel | Moves the time axis without zooming |
| Nudge one bar | Left / Right arrow | Left / Right arrow | Shifts the view by a single bar |
| Jump further | Ctrl + Left / Right | Cmd + Left / Right | Moves the view by a larger step |
| Reset the chart | Alt + R | Option + R | Restores the default view |
| Log scale on or off | Alt + L | Option + L | Switches the price axis between log and linear |
| Percent scale on or off | Alt + P | Option + P | Switches the price axis to percent change |
The rest are gestures rather than keys. A plain mouse wheel over the chart zooms the time axis in the default setup. The magnifier on the left toolbar lets you draw a box around the area you want, and the matching zoom-out control only appears after you've zoomed in once. Dragging along the bottom time axis stretches or squeezes the bars. Dragging along the right-hand price axis stretches the price range (more on that below). On a phone or tablet you pinch with two fingers, and the same horizontal-versus-vertical split applies: a horizontal pinch changes the bar spacing, a vertical one changes the price scale.
Why the chart feels stuck, and how to reset it
Most "TradingView won't zoom" complaints come down to one of three things. They look the same from the outside, so it helps to check them in order.
A locked price scale. If the scale is locked, the price axis refuses to refit when the bars change. You zoom out and the candles sit in a thin strip at one edge. Right-click the price axis and look at the auto-scale and lock entries.
The second cause is a dragged time axis. If you dragged the bottom axis hard, the bar spacing may be so narrow that the chart looks frozen, because every further scroll step moves a sliver of a pixel. Press Alt + R (Option + R on a Mac) to reset the view and the spacing returns to normal.
Third, and the sneakiest: browser zoom stacked on top of chart zoom. Browser zoom is Ctrl and the plus or minus key, and it resizes the whole page, so the chart pane gets fewer or more pixels to work with. The W3C's guidance on resizing text explains why pages are expected to respond to browser zoom at all, and a chart pane is one of the things that responds. Press Ctrl + 0 to return the browser to 100 percent before you judge the chart. If you've already read our companion piece on zooming out and why the price axis flattens, this is the same family of problem seen from the other direction.
Zooming the chart versus scaling an axis
These feel identical and they aren't. Zooming changes which bars are in view. Scaling an axis changes how those bars are drawn.
When you drag the time axis, you change the bar spacing, so the number of bars in view changes. That is a real zoom. When you drag the price axis, you don't load more or less history at all. You change how many pixels each price unit gets, which stretches or flattens every candle vertically. The data in view is identical. The picture isn't.
The reason this matters is that a trend line has an angle on screen, and the angle comes from two numbers: pixels per bar horizontally and pixels per price unit vertically. Their ratio is the price-to-bar ratio. Change either one and every line on the chart tilts, even though no price moved.
Three settings control that ratio, and they do different jobs:
- Auto-scale refits the price range to whatever bars are visible. It makes the chart readable, and it's also the reason the same trend looks steeper or flatter as you scroll, because the vertical range keeps changing underneath you.
- Log scale spaces equal percentage moves equally instead of equal point moves. On a long uptrend it flattens the early part of the chart and changes line angles. The mechanics are covered in the general article on semi-log plots.
- Lock price to bar ratio, found in the price scale menu, holds the vertical-to-horizontal relationship fixed, so a zoom keeps the angle of a line instead of redrawing it.
For a trend line angle to be repeatable, you need all three pinned: auto-scale off or at least understood, the log or linear choice stated, and the ratio locked.
The same line at two zoom levels: a worked example
Here's the arithmetic, and it's deliberately plain arithmetic rather than a screenshot. Take a pane that is 900 pixels wide and 450 pixels tall. Imagine a rising trend line that climbs 10 price points across 40 bars. In price terms it is the same line every time: 0.25 points per bar.
| View A | View B | |
|---|---|---|
| Bars in view | 100 | 400 |
| Visible price range (auto-fit) | 20 points | 40 points |
| Pixels per bar | 9 | 2.25 |
| Pixels per point | 22.5 | 11.25 |
| Run of the line (40 bars) | 360 px | 90 px |
| Rise of the line (10 points) | 225 px | 112.5 px |
| Apparent angle | about 32 degrees | about 51 degrees |
Same line, same data, same slope in price terms, and it looks like a gentle grind in View A and a steep climb in View B. Anyone who judges a trend by its angle ("steeper than 45 degrees tends to be unsustainable") gets opposite answers from the same chart in 2026 and the same chart a minute later.
Be precise about what this does and doesn't show. A line drawn by anchoring two points is stored in price and time coordinates, so zooming afterwards doesn't move it. What zoom changes is the angle you perceive, which pivots look significant enough to anchor to, and where you decide a break has happened. In View A, a three-bar dip looks like a swing low worth anchoring. In View B it's a few pixels of noise, so you skip it and draw a different line through different points. That is how two zoom levels produce two lines and two break bars. The chart didn't change. The decision about what counts did.
No chart screenshots are included in this piece, and none of the figures above come from a market. They're the geometry of the pane, which anyone can check with a calculator.
The bar count is the hidden variable in pattern recognition
Patterns are a statement about shape, and shape depends on how many bars are on screen. A tight flag at 150 bars in view can be a plain range at 600. A "breakout" at 60 bars can be an inconsequential wiggle inside a larger consolidation.
This is why two people can look at the same symbol and timeframe and disagree about whether there's a setup. They're often looking at different bar counts without knowing it. Our own trend-line protocol, laid out in how to draw trend lines the same way twice, already fixes the anchors, the wick-versus-body choice and the scale. The visible bar count is the one input that protocol leaves to the screen, and it deserves the same discipline.
The same thing applies to volume-based tools. Which window you look at changes what the profile says, as the walk-through on which volume profile period answers which question shows, and the anchor you choose for a VWAP changes its meaning in a similar way, covered in choosing the anchor that actually matters. In each case the lesson is the same: the view is part of the analysis.
How do you count the bars in view? The simplest route is the date range tool on the drawing toolbar, which reports the number of bars it spans. Drag it from the left edge of the pane to the right edge and write down the count. It takes ten seconds.
A repeatable zoom routine
Four steps. None of them are clever, which is the point.
- Fix a bar count per timeframe. Pick a number such as 150 on the 1-hour chart and 250 on the daily, and use it every time. The exact number matters less than the fact that it's the same.
- Lock the price-to-bar ratio. Open the price scale menu and turn on the lock, so that further zooming keeps line angles from shifting under you.
- Choose log or linear once. Decide, then leave it. Mixing the two is a quiet way to make two reads incomparable.
- Save a named layout and write its name beside the read. Layouts are saved with the shortcut Ctrl + S (Cmd + S on a Mac). Check on your own account that reopening the layout restores the range you expect. If it doesn't, the bar count in your note carries the information instead.
The note itself can be one line: symbol, timeframe, layout name, bar count, log or linear. It adds almost no time, and it means that when you revisit a call next month you can rebuild the same view.
Replay mode: stepping bars at a changing zoom
Bar replay adds one more way to fool yourself. When you step forward bar by bar and zoom as you go, each step quietly changes how many bars are in view and what the auto-fit range is. Two passes over the same session at different zooms are not comparable, even though the underlying bars are identical, for the reasons in the table above.
So set the bar count and ratio lock before you press play, and leave the zoom alone until the pass is over. If you need to inspect a candle up close, use the magnifier, finish your inspection, then reset to your saved view before stepping again.
What zoom does not change
It's worth stating this plainly so nobody over-reads the article. Zooming doesn't alter an indicator. A moving average, an RSI or any other oscillator is calculated from the data series, not from what's drawn on screen, so its numeric value at a given bar is identical at every zoom level.
What changes is how your eye reads the indicator's line. An oscillator panel looks more jagged when it's squeezed into fewer vertical pixels. That's a visual effect, and it's the same visual effect as the trend-line angle above. If you're deciding with numbers, read the numbers. If you're deciding with shapes, record the zoom.
If you use a signal tool on top of price, the same split holds: its output doesn't depend on your zoom, but your reading of it does. When you're comparing tools on how reproducible their output is, the criteria in what to look for in a TradingView signal tool are a sensible companion. Quantzee's toolkit is analytical software for studying charts, not a source of advice, and none of the steps in this guide are a recommendation to buy or sell anything.