Most futures scalping guides describe a style and stop there. They tell you to take two or three ticks, cut losers fast and trade the busy hours. What they skip is the arithmetic that decides whether the style is possible at all. A two-tick target on the Micro E-mini Nasdaq-100 (MNQ) is worth $1.00 gross. A normal round-turn commission can swallow all of it before the market has done anything, and so can the fill difference you get when an automated setup acts on a bar-close alert.
This post works through that arithmetic for the three contracts people actually scalp: the E-mini S&P 500 (ES), the Micro E-mini S&P 500 (MES) and MNQ. It varies the two inputs that move the answer most, target size and contract class, and it shows how far the result swings when only the slippage assumption changes. It is arithmetic, not a backtest and not a recommendation. Everything below can be reproduced with a pencil.
The Short Version: Tick Value Sets the Whole Game
Every scalp is a bet that price moves a few ticks your way before it moves the same few ticks against you. The cost of placing that bet is fixed per trade, in dollars. So the only question is how big that fixed cost is next to what a tick is worth.
According to the CME Group contract specifications, the three contracts move in the same quarter-point increment but pay very differently for it:
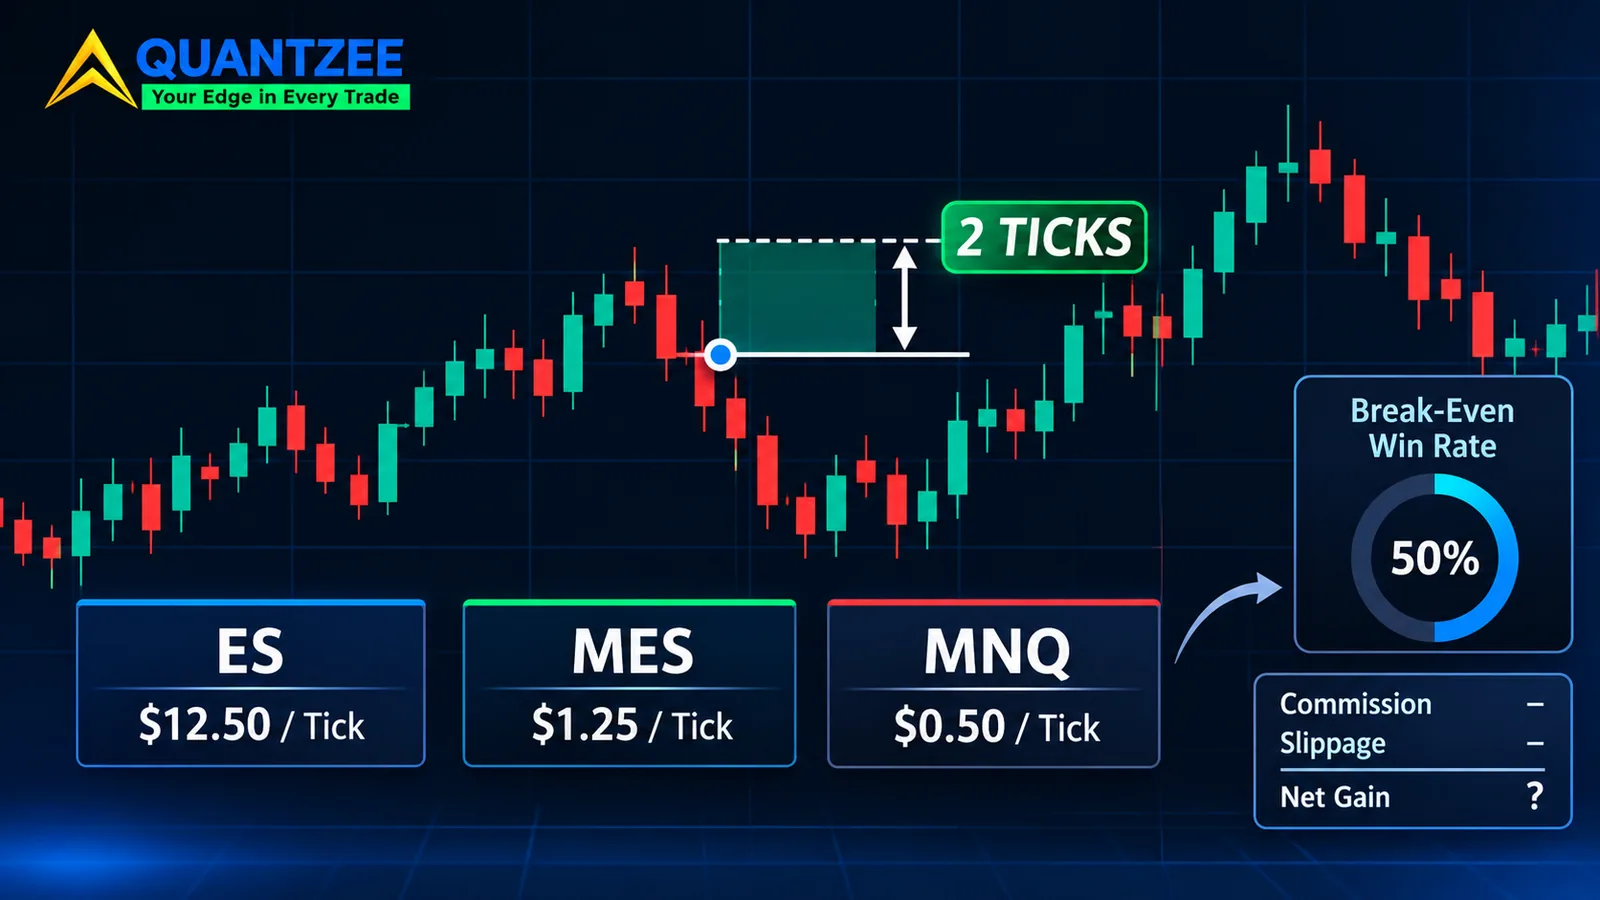
- ES: 0.25 index points per tick, worth $12.50 ($50 per full point).
- MES: 0.25 index points per tick, worth $1.25 ($5 per full point).
- MNQ: 0.25 index points per tick, worth $0.50 ($2 per full point).
Source: the CME Group Micro E-mini S&P 500 contract specifications, plus the matching ES and MNQ pages on the same site. Contract terms can be revised, so confirm the figures on the exchange page before you size anything off this post. CME's own pages are the authority here, not a broker blog and not this article.
Notice what that table implies. The tick on MNQ is worth 25 cents less than a dollar. Any fixed per-trade cost measured in whole dollars looks enormous against it. Keep that in mind as the grid gets built.
The Break-Even Win Rate Formula for a Symmetric Scalp
Take a scalp with a target of T ticks and a stop of the same T ticks. Call the tick value v. Call the total cost of one round turn c, in dollars. That cost has two parts: commission and fees, and slippage.
A winner pays T times v, minus c. A loser costs T times v, plus c. Set expected profit to zero and solve for the win rate p:
p = 0.5 + c / (2 × T × v)
It helps to express cost in ticks instead of dollars. Divide c by v and call the result k. Then the formula collapses to p = 0.5 + k / (2T). A coin-flip entry needs 50%, and every tick of cost pushes the requirement up by half a tick's worth divided by the target. The smaller the target, the harder each tick of cost bites.
If the stop is wider than the target, say S ticks against a target of T ticks, the general form is p = (S + k) / (T + S). A 2-tick target with a 4-tick stop on ES, with 0.82 ticks of total cost, needs (4 + 0.82) / 6, or 80.3%. Widening the stop to make a high hit rate feel comfortable simply moves the cost into the other column.
Methodology: What Went Into the Grid and What Did Not
We built the grid from three inputs and nothing else. The first is the tick value from the exchange specification above. The second is a commission-and-fees assumption per round turn. The third is a slippage assumption in ticks, applied once per round turn, meaning the combined adverse fill across entry and exit.
The commission figures are assumptions, not quotes for any named broker, and we did not pay them. They are illustrative round-turn totals including exchange and clearing fees: $4.00 for ES, $1.00 for MES and $1.00 for MNQ. Real schedules vary by broker, volume tier and fee pass-through, so treat them as a middle case and rerun the formula with your own number. Converted to ticks, those costs are 0.32 ticks on ES ($4.00 divided by $12.50), 0.80 ticks on MES ($1.00 divided by $1.25) and 2.00 ticks on MNQ ($1.00 divided by $0.50).
The slippage assumption is the soft spot, and the grid shows it on purpose. Published break-even figures usually fix slippage at one tick and move on. According to a 2026 guide from the backtesting provider test-max.com, a worked example assumed one tick of slippage and acknowledged it was optimistic for market orders. We could not find any page that measured the number. So the grid runs three cases: zero adverse ticks, half a tick, and a full tick per round turn.
No backtest produced any of this. The numbers are algebra on stated inputs. That is a strength, because anyone can check it, and a limit, because it says nothing about how often any entry rule wins. We have not measured that and make no claim about it.
The Grid: Required Win Rate by Target Size and Contract
Each cell is the win rate a symmetric scalp must beat just to break even, using p = 0.5 + k / (2T). Anything above 100% is shown as such: no win rate can cover it, and the setup loses money even if every trade wins.
Zero slippage (commission only)
| Target = stop | ES | MES | MNQ |
|---|---|---|---|
| 1 tick | 66.0% | 90.0% | 150% (impossible) |
| 2 ticks | 58.0% | 70.0% | 100.0% |
| 3 ticks | 55.3% | 63.3% | 83.3% |
| 5 ticks | 53.2% | 58.0% | 70.0% |
Half a tick of slippage per round turn
| Target = stop | ES | MES | MNQ |
|---|---|---|---|
| 1 tick | 91.0% | 115% (impossible) | 175% (impossible) |
| 2 ticks | 70.5% | 82.5% | 112.5% (impossible) |
| 3 ticks | 63.7% | 71.7% | 91.7% |
| 5 ticks | 58.2% | 63.0% | 75.0% |
One full tick of slippage per round turn
| Target = stop | ES | MES | MNQ |
|---|---|---|---|
| 1 tick | 116% (impossible) | 140% (impossible) | 200% (impossible) |
| 2 ticks | 83.0% | 95.0% | 125% (impossible) |
| 3 ticks | 72.0% | 80.0% | 100.0% |
| 5 ticks | 63.2% | 68.0% | 80.0% |
For the arithmetic itself, a calculator is a better tool than a table in a blog post. You can type in your own commission, your own slippage and your own stop. This grid exists so you can see the shape of the answer before you open one. A futures break-even calculator such as the one on TradeCalc converts a commission into the whole ticks needed to cover it, and it states plainly that it leaves spread and slippage out, which is the missing half of this grid.
How to Read the Grid Without Fooling Yourself
Look at the ES column at two ticks. With half a tick of slippage, the rules need to win 70.5% of trades just to break even. Most discretionary traders would be thrilled with 55%. A hit rate in the 70s over a meaningful sample is rare enough that a strategy claiming it deserves a hard second look, not a celebration. Our team treats any quoted scalping win rate above 65% as a prompt to ask how fills were modelled before asking anything else.
Now drop to MNQ at two ticks and zero slippage. The requirement is exactly 100%. Winners net nothing, because a $1.00 target is eaten by a $1.00 round turn, and losers lose $2.00. Add any slippage at all and the trade cannot pay. That is not a verdict on the Nasdaq micro. It is a verdict on a 2-tick target at that tick value.
Five-tick targets on ES look civilised: 53.2% to 63.2% depending on slippage. But a five-tick ES target is 1.25 index points, or $62.50 gross, and a five-tick stop risks the same. At that size you are no longer paying the cost of a scalp. You are paying the cost of a very short intraday trade, and the arithmetic improves because the style quietly changes.
Why Slippage, Not Commission, Is the Bigger Term at the Smallest Targets
Commission is a number on a schedule. Slippage is a distribution you only learn by trading. On ES, commission at the assumed $4.00 is 0.32 ticks. One tick of adverse fill is more than three times that. On a one-tick target, a single tick of adverse slippage on one side is the whole $12.50 target.
That is why the three grids above diverge so sharply on the top row. ES at one tick needs 66.0% with no slippage and 91.0% with half a tick. The gap, 25 percentage points, comes entirely from an assumption nobody measured. Our own reading of the published break-even figures is that they look firm only because one slippage value was picked and never varied.
Slippage also is not constant. It widens when the book thins, when a scheduled release hits, and when your order is a market order chasing a fast tape. Our slippage glossary entry covers the mechanics. The practical point for the grid is that your slippage on a quiet midday limit fill and your slippage on a stop-out into a news spike are different numbers, and a stop is exactly the order type that fills worst.
Micro vs Full-Size: The Cheaper Contract Is Not the Cheaper Trade
Micros are sold as the low-risk way to practise. For learning position control, that holds. For scalping cost, it runs the other way.
Compare friction per round turn with one tick of slippage included. ES costs $4.00 plus $12.50, or $16.50. MES costs $1.00 plus $1.25, or $2.25. MNQ costs $1.00 plus $0.50, or $1.50. The micros look cheaper in dollars. Measure the same friction against the dollars you put at risk on a 2-tick stop and the picture flips: $16.50 against $25.00 of risk on ES is 66%; $2.25 against $2.50 on MES is 90%; $1.50 against $1.00 on MNQ is 150%.
The reason is structural. Commission schedules are rarely proportional to contract size. A micro's fees are rarely a tenth of a full contract's, yet its tick is a tenth of the size (or a twenty-fifth, in MNQ's case). So the cost per unit of risk climbs as the contract shrinks. test-max.com makes a similar point, noting that micros carry a heavier commission load per dollar of exposure than the full E-mini, which is the wrong direction for a high-frequency style.
The workable reading: if you want to practise a 2-tick routine, the MES is the least punishing micro. If your rules need a 1-tick or 2-tick edge, the contract with the biggest tick relative to its fees, ES, is the only one in this set where the arithmetic is not hopeless on paper. Whether you can afford ES risk is a separate question, and our position sizing glossary entry is the place to start on it.
A Worked Example: 20 Trades a Day on ES
Suppose a 2-tick symmetric scalp on ES, half a tick of slippage, $4.00 round-turn commission, so k = 0.82 ticks. A trader wins 55% of trades. The gross edge per trade is (2 × 0.55 − 1) × 2 ticks = 0.2 ticks. Subtract 0.82 ticks of cost and the net is −0.62 ticks, or −$7.75 per contract per trade.
Over 20 trades that is −$155 a day on one contract, from a 55% hit rate that most people would call good. Raise the win rate to the 70.5% break-even line and the daily result is zero. The example is hypothetical and stands in for no real account. It shows how thin the margin is, not how any rule set will behave.
Liquidity: Where the Arithmetic Breaks Before the Rules Do
All the grids assume you get filled at the price you intended, plus a small slippage term. That assumption is only close to true in the hours when the book is deep. ES and MES trade against the same deep S&P futures book, which is why the micro tends to fill close to the touch during the regular US session. MNQ follows the Nasdaq-100 book, which moves in larger point swings per minute, so the same tick of slippage arrives more often.
Depth drops in the overnight session, around the cash close, and in the minutes either side of major scheduled releases. In those windows a half-tick slippage assumption is generous. A scalp rule that works on the grid at 70.5% required during the cash open may need 83% or more in a thin hour, because slippage per round turn has doubled. The rule did not get worse. The arithmetic under it did.
Volatility matters as well. An ATR reading tells you how far price travels per bar, which tells you whether a 2-tick target is a normal wiggle or half a bar's range. Our ATR glossary entry explains the calculation. A target smaller than the noise floor gets hit and stopped within a single candle, which leads straight into the backtesting trap below.
What a Scalping Rule Set Must Specify Before It Can Be Costed
You cannot cost an idea. You can only cost a rule set, and a rule set that leaves any of the following open cannot be costed at all:
- The exact entry condition, down to which bar close or tick triggers the order.
- The target in ticks, and whether it is a resting limit order or a market exit.
- The stop in ticks, and whether it is a stop-market or stop-limit.
- A maximum holding time, so a trade that goes nowhere has a defined exit.
- A session filter that says which hours the rule trades and which it sits out.
Leave the stop type open and you cannot assign slippage, since a stop-market fills worse than a resting limit. Leave out the holding time and you cannot count trades per day, and trade count multiplies every cost in this post. Leave out the session filter and the thin-hour problem above is silently averaged into a figure that describes no actual hour.
Why a One-Minute Replay Backtest Flatters a Scalp
This is where the grid meets tooling. A 1-minute bar contains a high and a low, but not the order in which they happened. If a bar's range covers both your 2-tick target and your 2-tick stop, a simple replay has to guess which came first. Many engines guess in the strategy's favour, or always take the target. On a scalp, where a 2-tick target sits well inside a typical bar, that guess fires constantly.
Three mechanisms usually produce the gap between a replay result and live fills:
First, fills at the signal bar's close or at the exact limit price, when live trading would have filled later or not at all. A resting limit that price merely touched may never have been filled, because the queue ahead of it was served first. Second, same-bar ambiguity, as above. Third, the zero-commission default: many platforms start with commission set to zero and slippage set to zero, so a replay that nobody reconfigured reports the top-left cell of the grid and calls it the answer.
Our page on the backtest versus live trading mismatch goes through the general version of this problem. The scalping version is harsher, because the cost sits as a larger share of each trade. If your tool lets you set commission and slippage per trade, set them from the grid before you look at a single equity curve.
Where an Indicator Fits, and Where It Does Not
An indicator can help define an entry condition, which is only the first line of the checklist above. It cannot move the tick value, shorten the queue or cancel the commission. A trend filter such as SuperTrend Pro+ can narrow which bars you act on. Fewer trades means fewer round turns, and fewer round turns is the lever that actually lowers total cost. Our scalping indicator comparison for TradingView carries an illustrative-performance caveat and an execution-latency section, and both apply to everything here. A signal on a chart and a fill at your broker are separated by your own reaction time and the broker's routing.
Quantzee is analytical software, not advice. Nothing in this post says a scalp will or won't work for you. Paper trade first, with commission and slippage switched on at the grid values, and only judge the result once the sample is large enough to mean something. Our piece on scalping cost math versus measurement covers how many trades that takes, and the scalping versus day trading cost comparison shows what happens to the same arithmetic when the holding period lengthens.
Regulatory Context Worth Knowing
Futures are leveraged products, and a small tick value does not make the exposure small. The Commodity Futures Trading Commission publishes investor education on futures risk, and the National Futures Association maintains broker background checks and member rules. Both are worth reading before you trade any contract in this post, and neither is affiliated with Quantzee.
Using the Grid: A Five-Step Routine
- Pull tick value and tick size for your contract from the exchange specification page and write down the date.
- Get your real round-turn commission and fees from your own statement, not a marketing page.
- Convert cost to ticks (dollars divided by tick value) and add slippage at 0, 0.5 and 1 tick.
- Apply p = 0.5 + k / (2T), or (S + k) / (T + S) for an uneven stop, and read off the required win rate for each case.
- Compare the three results with the win rate your rules showed in a replay that had costs switched on. If the replay beats the required rate only in the zero-slippage case, the edge depends on an assumption you have not measured.
Frequently Asked Questions
If you want the bigger picture before choosing a target size, see how scalping fits among the other intraday index setups and their position-size maths.