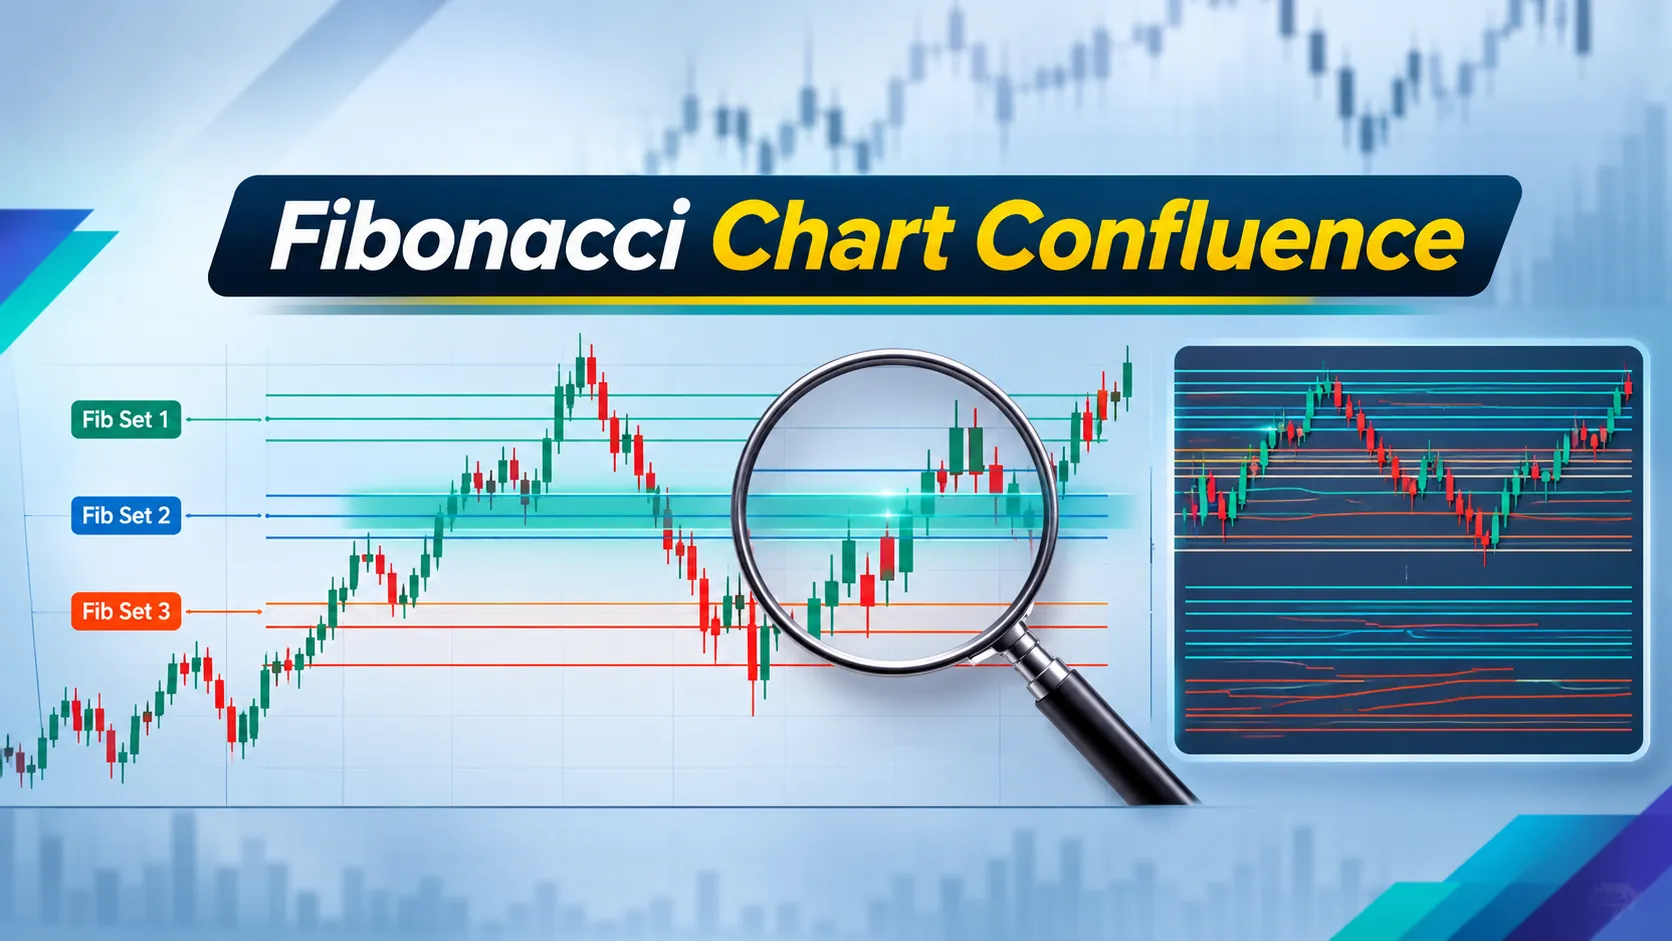
Open any Fibonacci chart tutorial and you'll reach the same advice within a few scrolls: draw levels from more than one swing or timeframe, and where they land together you have a stronger zone. It sounds like evidence piling up. Our view is that most of it is arithmetic. Every level set puts seven lines on the chart. Three sets put twenty-one lines across a finite price range, and at any tolerance a trader would actually accept, some pair of those lines will sit close together almost every time.
So we counted. Across 5 instruments and roughly 10 years of daily and weekly bars, we measured how often Fibonacci levels from three distinct-anchor level sets coincide within a volatility-normalised tolerance, and how often lines placed at random, at exactly the same density, coincide under the same rule. The short version: a two-set coincidence showed up on 63% to 82% of the dates we checked. Random lines managed 54% to 74%. The average number of coinciding pairs was almost identical between real and random. The full numbers, the method and what they do and don't mean are below.
Why a Fibonacci chart confluence question is about anchors, not intervals
Credit where it's owed first. The strongest page on the first screen for this topic, LuxAlgo's guide to multi-timeframe Fibonacci levels, already makes the most important point. According to that guide, copies of one measurement are not independent evidence, and switching the chart interval without switching the anchors creates no new measurement. It also refuses to hand out a universal proximity band such as 1%, and tells readers to set the tolerance per instrument before testing anything.
That's right, and it's where most multi timeframe Fibonacci levels advice goes wrong. A Fibonacci retracement is a function of two prices: a swing high and a swing low. If you draw it from the March high to the June low on a daily chart, then flip to a 4-hour chart and draw it from the same March high to the same June low, you've drawn the same seven lines twice. The candles look different, but the input is identical. Agreement between those two sets isn't confluence. It's a photocopy.
Real independence needs different anchors. A level set from the most recent daily swing, another from an older daily swing that shares no pivot with it, and a third from a weekly swing whose endpoints are different prices again. Only then can a coincidence between sets mean anything at all. Where LuxAlgo's guide stops is the next question: once you have genuinely distinct anchors, how often do their levels agree anyway, purely because there are a lot of lines? It performs no measurement and gives no count. That's the gap this post tries to close.
We hit the anchor problem in our own counting before we'd written a line of this article. Our first pass used the last two consecutive daily swings as two of the three sets. Every single date was rejected by the distinct-anchor check, all 538 of them on SPY, because two consecutive swings share their middle pivot. The low that ends one leg is the low that starts the next. If you've ever drawn "two" retracements off back-to-back swings and celebrated where they agreed, you were partly measuring the same price twice. We fixed it by skipping a leg, so the two daily sets come from non-overlapping swings.
The line density arithmetic
Here's the arithmetic that the usual advice skips. The standard ratio set is 0%, 23.6%, 38.2%, 50%, 61.8%, 78.6% and 100%. That's 7 lines per set. With two sets you have 7 × 7 = 49 cross-set pairs that could coincide. With three sets you have three pairs of sets, so 3 × 49 = 147 cross-set pairs.
Now pick a tolerance. Say any two lines within 0.25 ATR of each other count as "the same zone," and say you're looking at a window of 10 ATR around current price (5 above, 5 below). For one pair of lines placed independently in that window, the chance they fall within tolerance is about 2 × 0.25 / 10 = 5%. That's small for one pair. But the chance that none of 49 pairs coincide is roughly 0.95 raised to the 49th power, about 8%. So two full sets in that window agree somewhere around 92% of the time, before price has done anything meaningful at all. With three full sets, the "no agreement" chance falls to roughly 0.05%.
In practice not every line falls inside the window you care about. If only 3 lines from each of three sets are nearby, you have 27 pairs and the agreement chance is still about 75%. If 4 lines from each set are nearby, it's 48 pairs and about 91%. This is the same effect as the birthday problem: individual coincidences are rare, but the number of possible pairs grows with the square of the number of lines, so some coincidence becomes close to certain fast.
The approximation isn't exact. Lines inside one set are evenly spaced rather than independent, and windows have edges. That's precisely why a measured null matters more than the back-of-envelope figure. Still, the direction is not in doubt: adding level sets mostly adds lines, and lines produce coincidences on their own.
Why the tolerance has to be volatility-normalised
"Levels within 0.5% of each other" sounds precise. It isn't portable. On a quiet instrument with a daily range of 0.4%, a 0.5% band is wider than a typical day, so almost any two nearby lines qualify. On crude oil futures, where a 3% day is ordinary, the same 0.5% band is a sliver, and coincidences become rare. The percentage rule quietly makes confluence common on calm markets and scarce on violent ones, which tells you about the instrument's volatility rather than about Fibonacci.
Expressing tolerance as a multiple of average true range fixes that. A 0.25 ATR band means "a quarter of a typical bar's range" on SPY, on EUR/USD and on gold alike, and on daily or weekly bars alike. It's the volatility-normalised figure LuxAlgo's guide asks readers to choose for themselves and then leaves unspecified. We used 0.25 × ATR(14) of daily bars as the main setting and re-ran everything at 0.5 × ATR to see how sensitive the result is. We took the same approach in our comparison of Fibonacci extensions against ATR and structure targets, and for the same reason.
How we measured the coincidence count
This is the methodology, stated fully, because a coincidence rate without it is unreadable.
- Instruments: SPY, QQQ, GLD, EUR/USD spot and front-month WTI crude oil futures (CL). Data from Yahoo Finance daily OHLC bars.
- Date range: bars from January 2015 to 16 November 2026. The first 300 bars were used only to warm up pivots and ATR, so evaluation dates start in early 2016.
- Intervals: daily bars, and weekly bars built from the same daily data (Friday close).
- Anchor rule: a fractal pivot needs 3 bars on each side that it exceeds. Pivots must alternate high and low, and a new leg only counts if it covers at least 3 × ATR(14) of that interval. This follows the house precedent on our Fibonacci retracement swing-selection page: a stated confirmation count and a minimum swing size in ATR multiples, fixed in advance.
- The three level sets: (1) the most recent confirmed daily leg, (2) an older daily leg that shares no pivot with the first, and (3) the most recent weekly leg confirmed at least one full week before the evaluation date, so nothing from the future leaks in.
- Distinct-anchor check: if any anchor price in one set sits within 0.1 ATR of an anchor in another set, the date is thrown out. On SPY that removed 208 dates; across all five instruments it removed 1,443.
- Levels: 0, 23.6, 38.2, 50, 61.8, 78.6 and 100% of each leg.
- Window and tolerance: only lines within 5 daily ATRs of the closing price count. Two lines from different sets "coincide" if they are within 0.25 × daily ATR(14).
- Sampling: every 5th trading day, to limit overlap between neighbouring dates. That left a sample of 1,226 evaluation dates across the five instruments, each comparing 3 pairs of sets.
- The null: for every evaluation date, we replaced each level set with 7 lines drawn uniformly at random between that set's own swing high and swing low, then applied the identical window and tolerance. That was repeated 200 times per date, so each instrument's null figure rests on tens of thousands of random draws.
The script and raw output files are kept with our research notes. Nothing here involves trade entries, exits or returns. It's a count of line coincidences and nothing more.
What the coincidence count found
Three figures matter. "Any pair" means at least one line from one set coincided with a line from another set. "Triple" means a single price zone where lines from all three sets met. "Pairs per date" is the average number of coinciding cross-set pairs.
| Instrument | Dates | Any pair: real | Any pair: random | Triple: real | Triple: random | Pairs/date: real | Pairs/date: random |
|---|---|---|---|---|---|---|---|
| SPY | 303 | 69.6% | 61.1% | 15.5% | 7.7% | 2.84 | 2.89 |
| QQQ | 277 | 62.8% | 54.1% | 13.7% | 8.6% | 2.27 | 2.49 |
| GLD | 226 | 70.8% | 63.1% | 9.7% | 9.2% | 2.69 | 2.70 |
| EUR/USD | 232 | 82.3% | 73.8% | 20.3% | 11.2% | 3.42 | 3.43 |
| CL futures | 188 | 74.5% | 67.1% | 29.3% | 17.0% | 3.66 | 3.62 |
Read the random columns first. Lines with no Fibonacci logic at all, scattered inside the same swings, produced at least one "confluence" on 54% to 74% of dates. That's the floor any confluence claim has to clear, and it's high. A trader drawing three sets will see agreement most days whether or not the ratios mean anything.
The real Fibonacci sets did clear it, by about 7 to 9 percentage points on every instrument. That's a consistent gap, so it's worth asking where it comes from. The pairs-per-date column gives the first clue: the average number of coincidences was nearly identical, real versus random, on all five. Real sets don't produce more agreement. They spread their agreement over slightly more dates.
Where the excess comes from
We had a suspicion and tested it. The 0% and 100% lines are not Fibonacci levels in any real sense. They are the swing high and swing low themselves. Swing extremes cluster in real markets, because price returns to prior highs and lows, and that's support and resistance doing its thing rather than any ratio. Random lines inside the span never sit exactly on the extremes, so they can't pick up that effect.
So we re-ran the count using only the five interior ratios (23.6% through 78.6%), with 5 random lines per set in the null. The gap on "any pair" collapsed to between 0.9 and 2.9 points:
- SPY 54.1% real vs 51.8% random
- QQQ 45.5% vs 44.6%
- GLD 55.3% vs 52.6%
- EUR/USD 65.5% vs 62.6%
- CL 61.2% vs 58.5%
Most of the edge real sets had over random lines came from the swing points, not from 38.2%, 50% or 61.8%. A small residual remains, and with roughly 200 to 300 dates per instrument we wouldn't lean on a 1 to 3 point difference in either direction.
Triple coincidences are the one place where real sets looked meaningfully different. They met in one zone more often than random lines on 4 of 5 instruments, and that held with interior ratios only on SPY, QQQ, EUR/USD and CL, though not GLD. Triples are rare events, though: on GLD the interior-only count was 4.0% real against 4.5% random, which on 226 dates is a handful of occurrences. Our data supports "triples are worth a closer look with a bigger sample," not "triples are a signal." We measured whether lines meet. We did not measure whether price reacts at those zones, which is a separate and harder test.
Sensitivity: doubling the tolerance
At 0.5 × ATR, everything rises, as the arithmetic predicts. Random lines produced at least one coincidence on 60% to 80% of dates, and real sets on 67.5% to 89.2%. Average pairs per date roughly doubled to between 4.9 and 7.2, and again matched random to within about 0.25 pairs on every instrument. Widening the tolerance makes confluence easier to find. It doesn't make the real levels any more distinctive.
What survives if confluence doesn't
None of this says Fibonacci levels are useless. It says the specific claim "agreement between level sets marks a stronger zone" mostly measures how many lines you drew. Strip that away and two honest uses remain.
The first is organisation. A retracement grid is a consistent, rule-based way to label where price sits inside a move: shallow pullback, half-way, deep pullback. That labelling is useful for writing rules, journaling trades and comparing setups, even if the ratios have no special predictive power. It's where our Fibonacci retracement post already landed, and the count above doesn't change that conclusion.
The second is the swing points themselves. The excess agreement we found came from 0% and 100% lines, meaning prior highs and lows. If you want an objective zone, prior structure is a better candidate than an interior ratio, and you don't need a Fibonacci tool to mark it.
There's a parallel with indicators. In our piece on why three indicators often say one thing, the "confirmation" from stacking oscillators largely came from their shared input. Fibonacci confluence has a cousin of that problem, and the line-density effect sits on top of it. Our harmonic patterns tolerance test ran into the same issue from another angle: loosen the ratio tolerance and patterns appear everywhere.
A disclosure rule for anyone publishing a Fibonacci hit rate
If you read or publish a claim like "price respected the 61.8% level 70% of the time," ask for four things. Without them, the number can't be checked or compared, and per the count above, it may be no better than random lines.
- The anchor selection rule. How were swing highs and lows chosen, and was the rule fixed before looking at the outcome? "Obvious swings" is not a rule.
- The interval. Daily, weekly, 15-minute? A level set from one interval can't be compared with a rate from another.
- The tolerance. How close is "respected"? State it in ATR multiples, or at minimum give both the percentage and the instrument's typical range.
- The sample. Instruments, date range and the number of events counted. A rate from 14 trades tells you very little.
Add a fifth if you can: the null. What would the same count look like with random lines at the same density? That single comparison is what turns an observation into a finding. The NIST/SEMATECH e-Handbook of Statistical Methods is a free reference for setting up that kind of baseline comparison properly. None of the three page-one guides we read for this topic reports a counted sample, and none reports a null.
The practical procedure for a Fibonacci chart
If you still want to work with multi-set levels on Fibonacci charts, and plenty of systematic traders do, this keeps the process honest:
Pick anchors by a written rule. A fractal pivot with a fixed confirmation count and a minimum swing size in ATR is enough. Draw only the level sets that rule produces, and never add an extra set because the chart looks bare. Check that no two sets share an anchor; consecutive swings almost always do. Set the tolerance in ATR before you look, and keep it the same across instruments. Then record which zones meet the tolerance before the trade, not after. Hindsight is the point where every chart starts showing confluence, because there's always some pair of lines near wherever price turned.
Finally, treat a two-set coincidence as the base case, not as news. On our sample it happened on most dates even for random lines. If you're going to give any agreement extra weight, a triple at a tight tolerance is the only version our count didn't rule out, and it still needs its own reaction test. Quantzee's toolkit is built around this kind of rules-first workflow, where the anchor logic and tolerance are explicit settings rather than a judgement made while staring at the chart. It's analytical software, not a source of trade signals.